
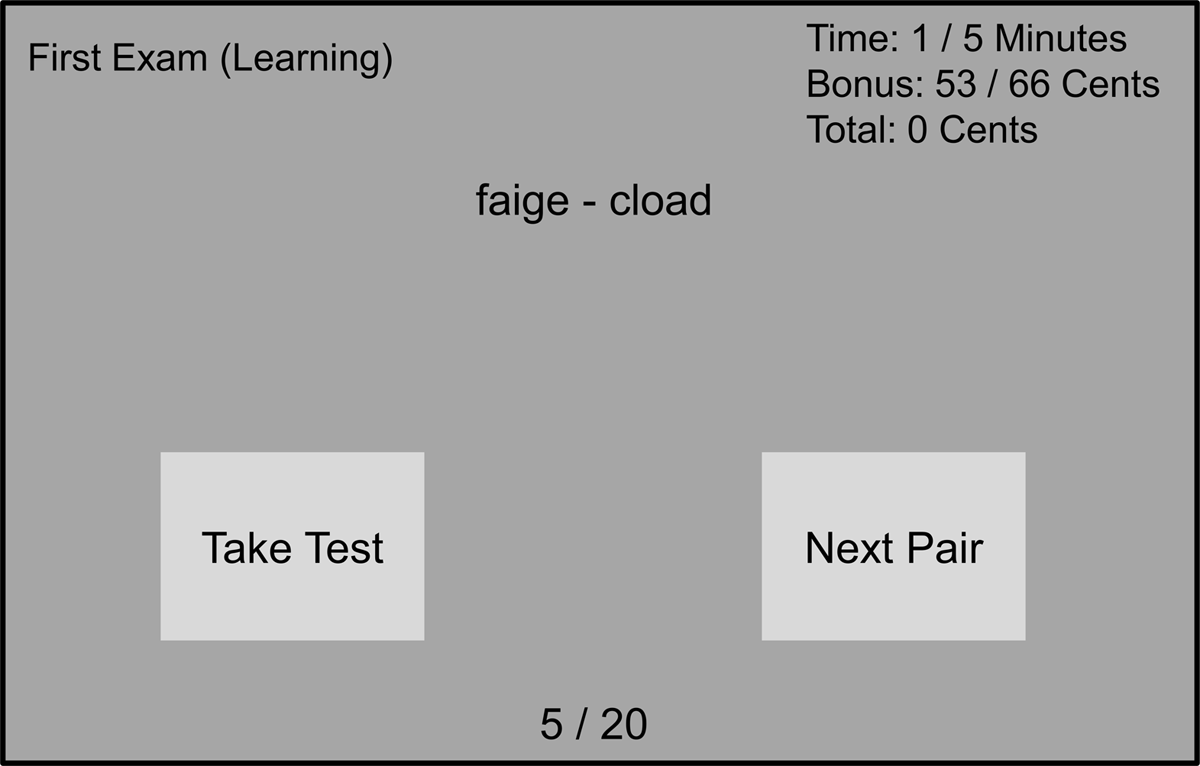
Figure 1
Task display. The task display as presented to participants during the study phase in Experiment 1. The display showed the pseudoword pair in the middle, an indication of the type of exam in the top left, an index indicating which word pair the participants was studying at the bottom, and the time, bonus, and total earnings counters at the top right. Additionally, the display included two light-gray buttons on which the participants could click at any point to either continue to the next pair, or take the test.
Table 1
Descriptive Statistics Experiment 1.
| TEST | MEAN OVERALL STUDY TIME IN SECONDS (SD) | MEAN STUDY TIME PER WORD PAIR IN SECONDS (SD) | MEAN NUMBER OF WORD PAIRS VIEWED (SD) | MEAN GRADE (SD) | MEAN PROPORTION OF PASSED TESTS (SD) |
|---|---|---|---|---|---|
| NR | 181.2 (68.6) | 5.2 (3.3) | 37.6 (13.0) | 7.7 (1.7) | 0.85 (0.27) |
| R1 | 175.2 (69.4) | 5.4 (3.3) | 35.8 (12.1) | 7.5 (1.8) | 0.82 (0.28) |
| R2 | 95.5 (71.4) | 3.7 (2.9) | 27.3 (13.0) | 6.9 (1.9) | 0.68 (0.43) |
[i] Note: Mean values, averaged over both passed and failed tests, for overall study time in seconds, study time per word pair in seconds, number of word pairs viewed (values higher than the total amount of included word pairs per test reflect the repeated studying of certain pairs), grade, and percentage of passed tests for NR (single chance), R1 (first test opportunity), and R2 (resit opportunity) in Experiment 1. Standard deviations are presented in parentheses.
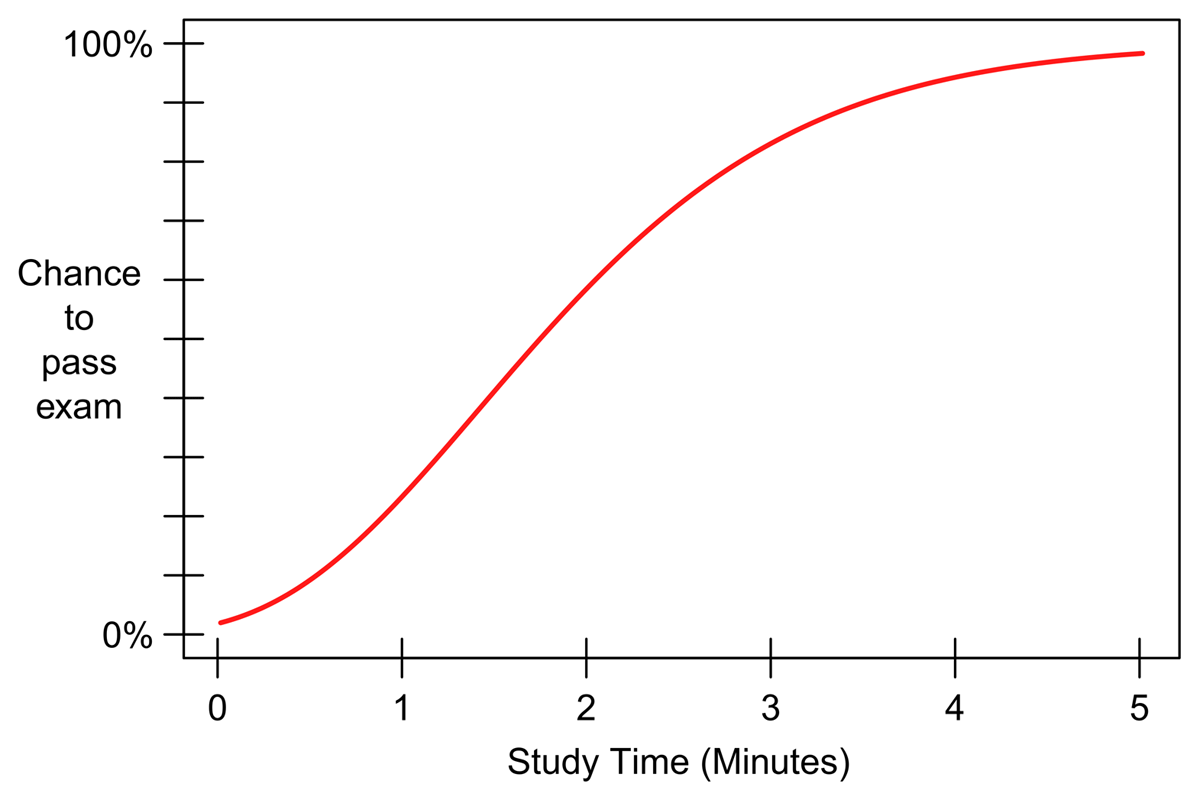
Figure 2
Passing probability function. The passing probability function used in Experiment 2.The function relates the investment of a maximum of 5 minutes of study time to the probability of passing an exam consisting of 10 3-alternative multiple-choice questions.
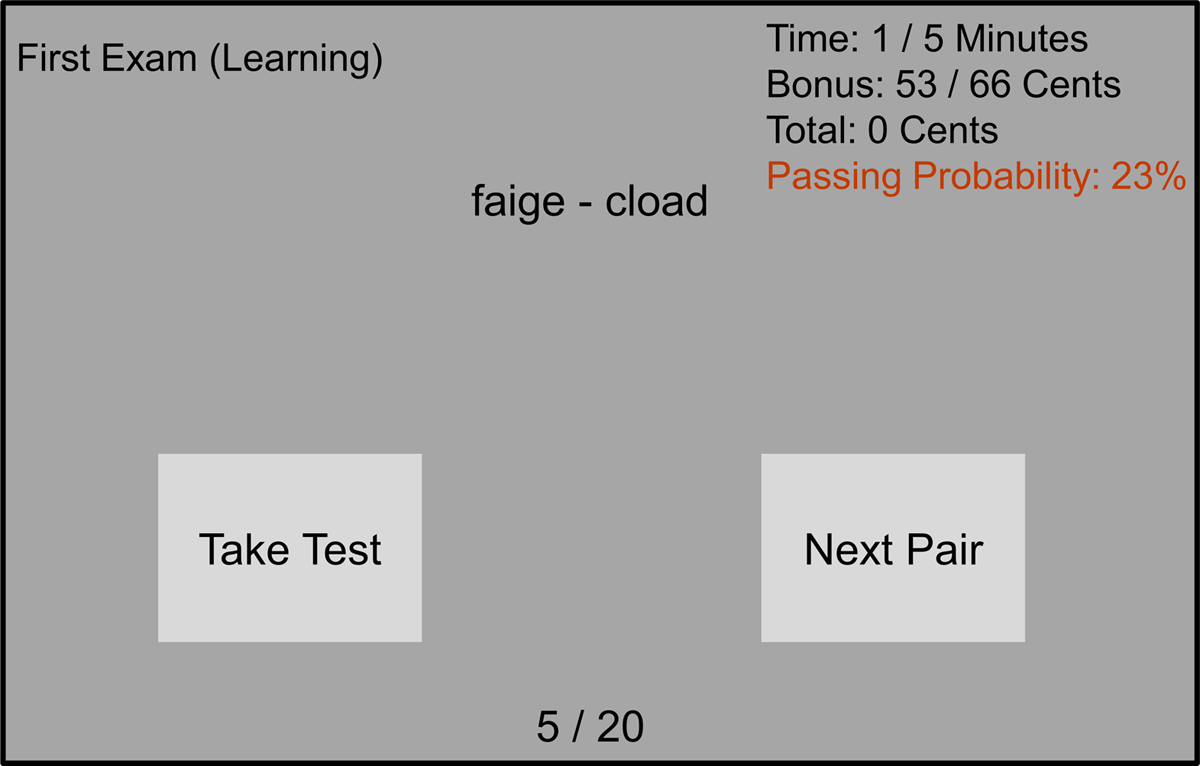
Figure 3
Task display. The task display as presented to participants during the study phase in Experiment 2. The display showed the pseudoword pair in the middle, an indication of the type of exam in the top left, an index indicating which word pair the participants was studying at the bottom, and the time, bonus, total earnings, and passing probability indication counters at the top right. Additionally, the display included two light-gray buttons on which the participants could click at any point to either continue to the next pair, or take the test.
Table 2
Descriptive Statistics Experiment 2.
| TEST | MEAN OVERALL STUDY TIME IN SECONDS (SD) | MEAN STUDY TIME PER WORD PAIR IN SECONDS (SD) | MEAN NUMBER OF WORD PAIRS VIEWED (SD) | MEAN GRADE (SD) | MEAN PROPORTION OF PASSED TESTS (SD) |
|---|---|---|---|---|---|
| NR | 168.3 (72.7) | 5.9 (3.3) | 31.0 (11.0) | 7.1 (1.7) | 0.74 (0.29) |
| R1 | 164.8 (78.7) | 5.9 (3.1) | 30.0 (10.3) | 7.2 (1.8) | 0.77 (0.30) |
| R2 | 101.2 (51.5) | 4.3 (2.8) | 25.3 (11.2) | 6.9 (2.5) | 0.81 (0.34) |
[i] Note: Mean values, averaged over both passed and failed tests, for overall study time in seconds, study time per word pair in seconds, number of word pairs viewed (values higher than the total amount of included word pairs per test reflect the repeated studying of certain pairs), grade, and percentage of passed tests for NR (single chance), R1 (first test opportunity), and R2 (resit opportunity) in Experiment 2. Standard deviations are presented in parentheses.
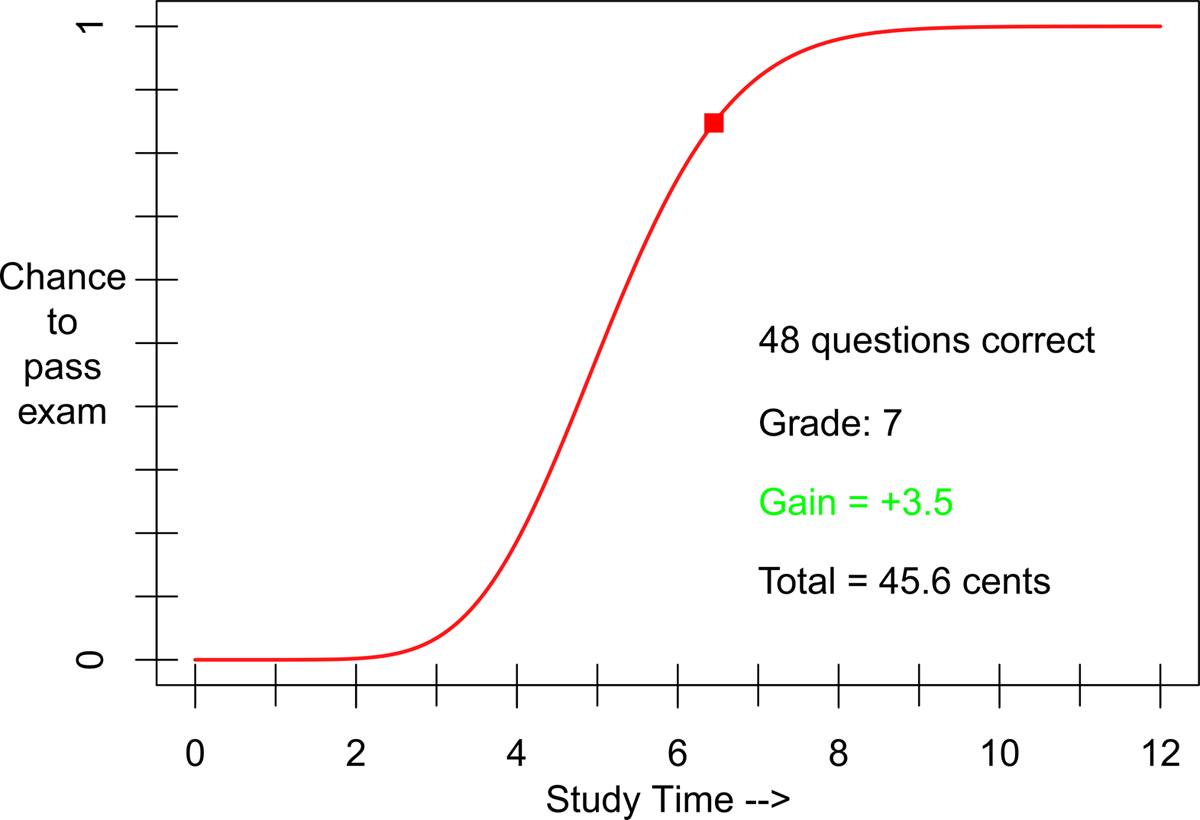
Figure 4
Stimulus material. The plot used as the stimulus material. Depicted is the relationship between hypothetical study time investment (x-axis) and the probability of passing a simulated exam (y-axis). Also depicted is the feedback, consisting of the outcome of the simulated exam, shown after participants invested their desired amount of hypothetical study time. Due to the arbitrary nature of the number of study-time units, the numbers on the x-axis were not presented to participants during the experiment, but are included in the figure for clarity.
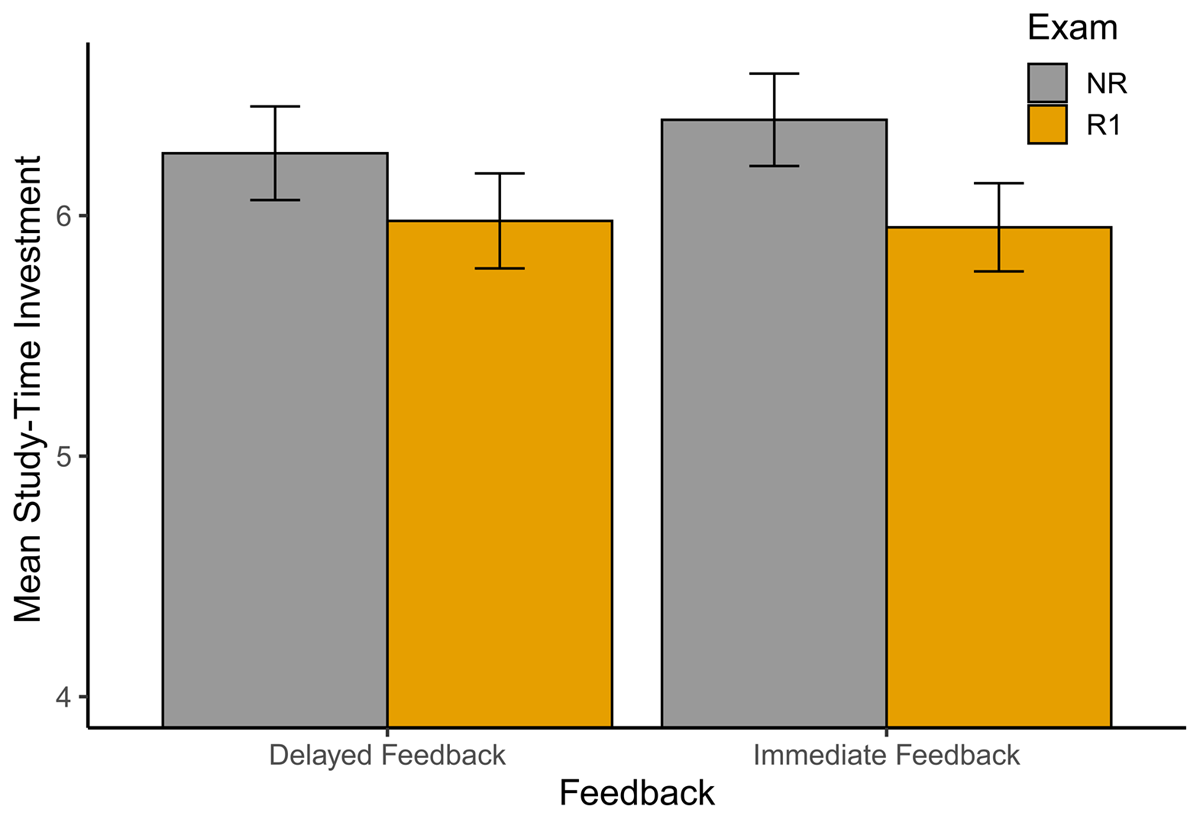
Figure 5
Mean study-time investment. Mean study-time investments for NR (single exam) and R1 (first exam with resit opportunity), per feedback condition (immediate vs. delayed). Error bars represent the 95% confidence intervals for the means.
Table 3
Frequency Distribution Table.
| COURSE | DISTRIBUTION OF ANSWERS (%) | ||
|---|---|---|---|
| ‘STUDY LESS’ | ‘STUDY THE SAME’ | ‘STUDY MORE’ | |
| Social Psychology | 0 (0%) | 8 (11.1%) | 64 (88.9%) |
| Developmental Psychology | 0 (0%) | 17 (23.6%) | 55 (76.4%) |
[i] Note: Frequencies, with proportions in parentheses, of the number of participants that answered ‘study less’, ‘study the same’, or ‘study more’ to questions about two courses (Social Psychology and Developmental Psychology) for a questionnaire study that asked about how participants’/students’ study habit for an exam would have changed if they knew in advance they would have no option to resit in case of failure.
Table 4
Contingency Table Developmental Psychology Exam.
| ‘HOW MUCH TIME DID YOU PUT INTO THE PREPARATION OF THE EXAM?’ | ‘DID YOU PASS THE EXAM?’ | ||
|---|---|---|---|
| NO | YES | TOTAL | |
| ‘A lot, so that I could obtain a high grade’ | 0 | 12 | 12 |
| ‘A good amount that would ensure me of passing the exam’ | 6 | 26 | 32 |
| ‘Just enough to hopefully pass the exam’ | 7 | 16 | 23 |
| ‘Very little, so I did not expect to pass the exam’ | 5 | 0 | 5 |
| Total | 18 | 54 | 72 |
Table 5
Contingency Table Social Psychology Exam.
| ‘HOW MUCH TIME DID YOU PUT INTO THE PREPARATION OF THE EXAM?’ | ‘DID YOU PASS THE EXAM?’ | ||
|---|---|---|---|
| NO | YES | TOTAL | |
| ‘A lot, so that I could obtain a high grade’ | 0 | 8 | 8 |
| ‘A good amount that would ensure me of passing the exam’ | 8 | 15 | 23 |
| ‘Just enough to hopefully pass the exam’ | 12 | 14 | 26 |
| ‘Very little, so I did not expect to pass the exam’ | 11 | 4 | 15 |
| Total | 31 | 41 | 72 |
Table 6
Contingency Tables Developmental Psychology Exam.
| ‘HOW MUCH TIME DID YOU PUT INTO THE PREPARATION OF THE EXAM?’ | ‘IMAGINE YOU HAVE PLANNED YOUR VACATION…’ | ||
|---|---|---|---|
| ‘STUDY MORE’ | ‘STUDY THE SAME’ | TOTAL | |
| ‘A lot, so that I could obtain a high grade’ | 8 | 4 | 12 |
| ‘A good amount that would ensure me of passing the exam’ | 22 | 10 | 32 |
| ‘Just enough to hopefully pass the exam’ | 20 | 3 | 23 |
| ‘Very little, so I did not expect to pass the exam’ | 5 | 0 | 5 |
| Total | 55 | 17 | 72 |
Table 7
Contingency Tables Social Psychology Exam.
| ‘HOW MUCH TIME DID YOU PUT INTO THE PREPARATION OF THE EXAM?’ | ‘IMAGINE YOU HAVE PLANNED YOUR VACATION…’ | ||
|---|---|---|---|
| ‘STUDY MORE’ | ‘STUDY THE SAME’ | TOTAL | |
| ‘A lot, so that I could obtain a high grade’ | 5 | 3 | 8 |
| ‘A good amount that would ensure me of passing the exam’ | 21 | 2 | 23 |
| ‘Just enough to hopefully pass the exam’ | 24 | 2 | 26 |
| ‘Very little, so I did not expect to pass the exam’ | 14 | 1 | 15 |
| Total | 64 | 8 | 72 |