
Table 1
Sources of the word association data.
| NUMBER | EXPERIMENT | EXPERIMENT TYPE | NUMBER OF AMBIGUOUS WORDS | NUMBER OF PARTICIPANTS |
|---|---|---|---|---|
| 1 | Betts et al. (2018), Expt. 1 | Priming | 60 | 30 |
| 2 | Betts et al. (2018), Expt. 2 | Priming | 88 | 55 |
| 3 | Betts et al. (2018), Expt. 3 | Priming | 88 | 58 |
| 4 | Betts (2013) | Priming | 56 | 20 |
| 5 | Gilbert et al. (2018), Expt. 1 | Priming | 75 | 78 |
| 6 | Gilbert et al. (2021), Expt. 1 | Priming | 55 | 30 |
| 7 | Gilbert et al. (2021), Expt. 3 | Priming | 65 | 109 |
| 8 | Rodd et al. (2016), Expt. 2 | Priming | 88 | 40 |
| 9 | Rodd et al. (2013), Expt. 1 | Priming | 113 | 29 |
| 10 | Rodd et al. (2013), Expt. 3 | Priming | 54 | 42 |
| 11 | Warren et al. (unpublished) | Stimuli pre-test | 192 | 25 |
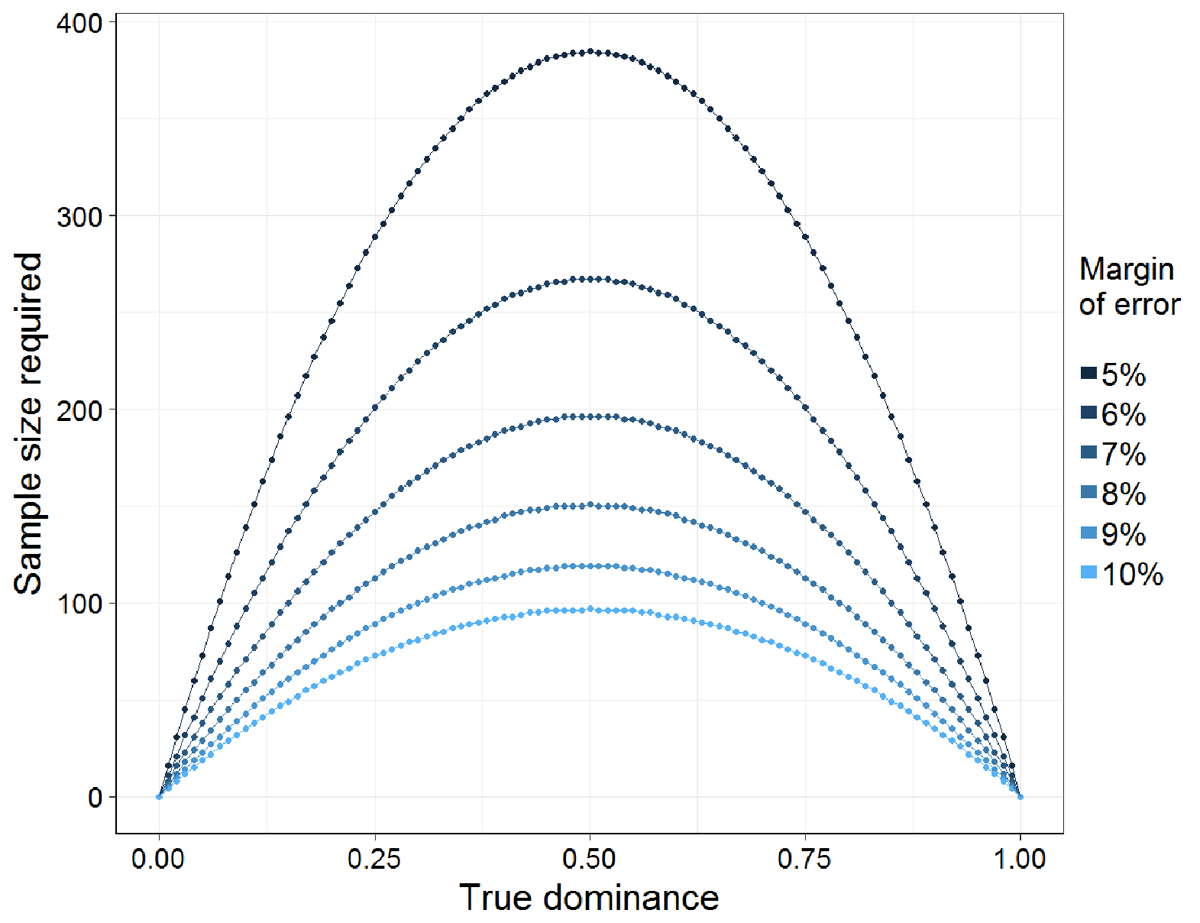
Figure 1
Sample size needed (y-axis) to estimate a dominance value (proportion of responses) with a 95% confidence interval, according to the true meaning dominance value (x-axis) and desired margin of error (colour-coded). More word association responses are needed when the true dominance value is close to 0.5, and for smaller margins of error.
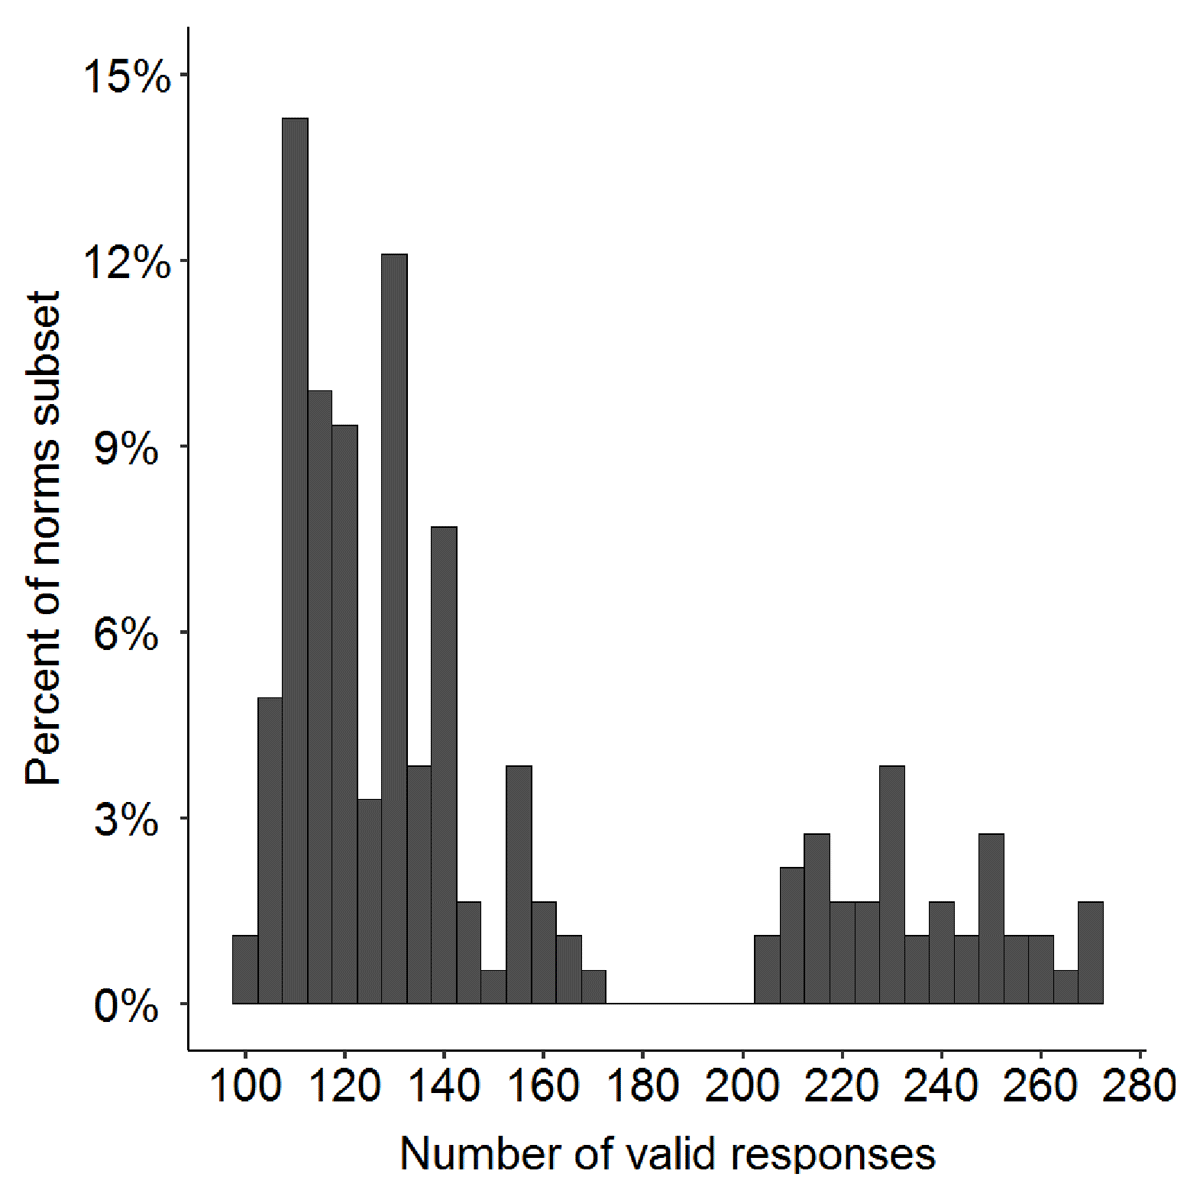
Figure 2
Percentage of items in the norms data subset (y-axis) according to the number of valid word association responses for the item (x-axis). All 182 items in the norms subset have at least 100 valid responses.
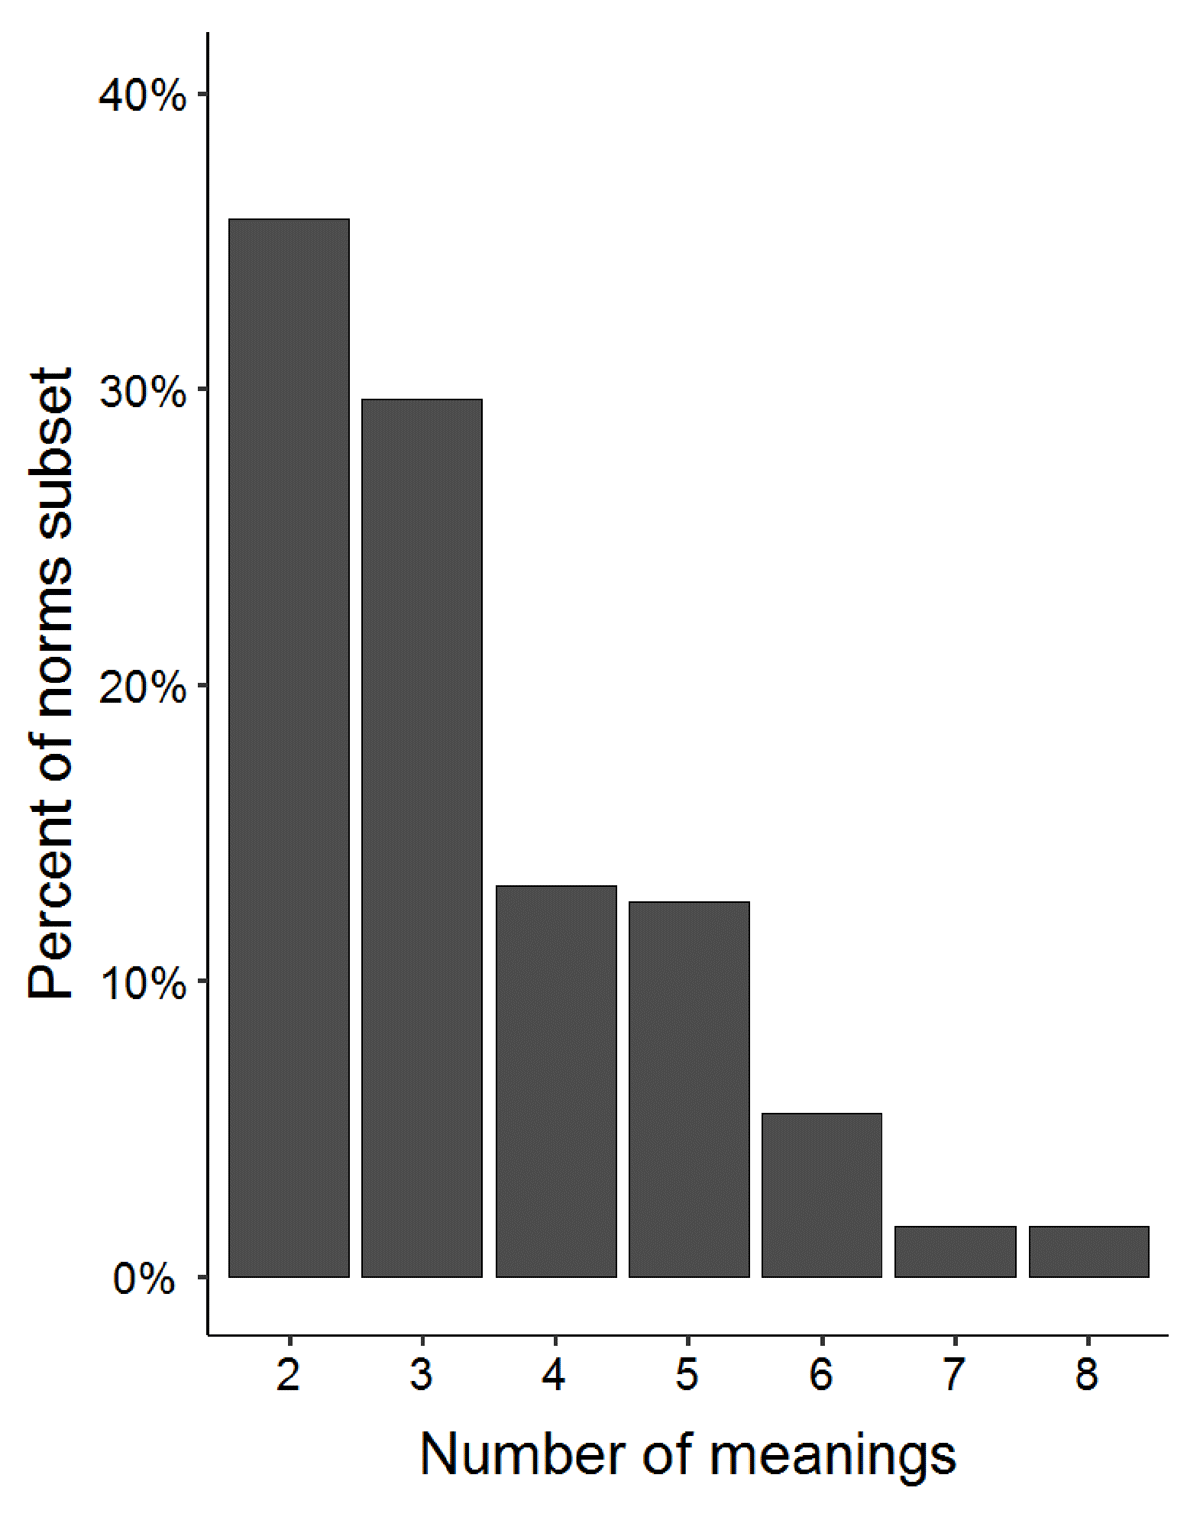
Figure 3
Percentage of items in the norms subset (y-axis) according to the number of meanings for the item (x-axis). All 182 items have at least two meanings.
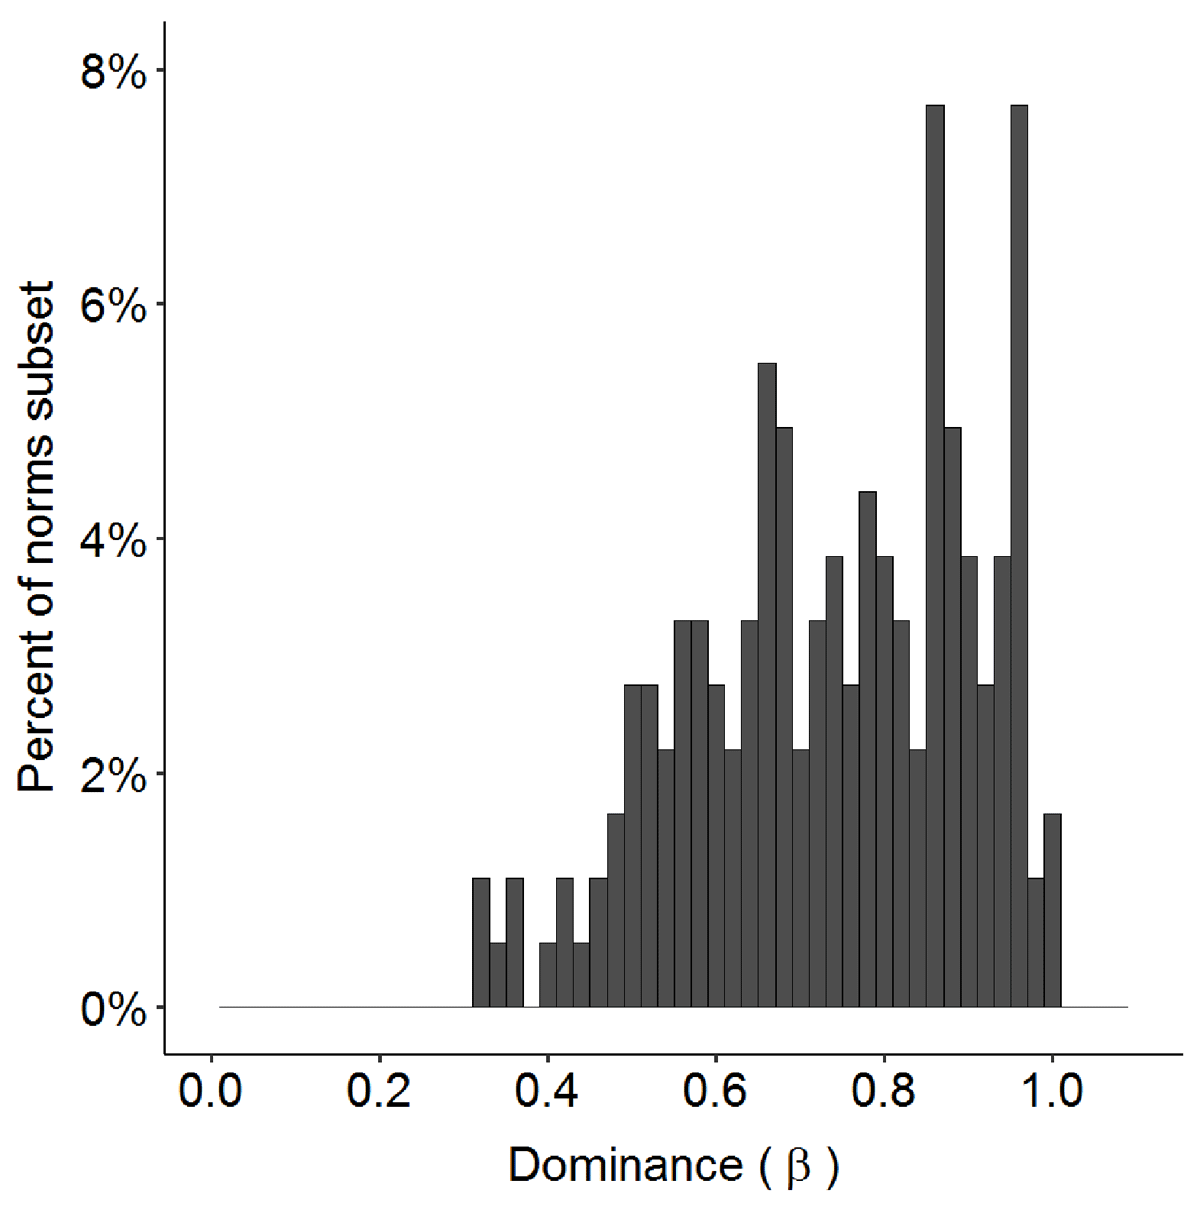
Figure 4
Percentage of the 182 items in the norms subset (y-axis) according to the item’s dominance (proportion of responses for the most frequent meaning; x-axis). Lower dominance values indicate that interpretation is relatively balanced across the different meanings. Dominance values near 1 indicate that interpretation of the word is highly biased toward one meaning.
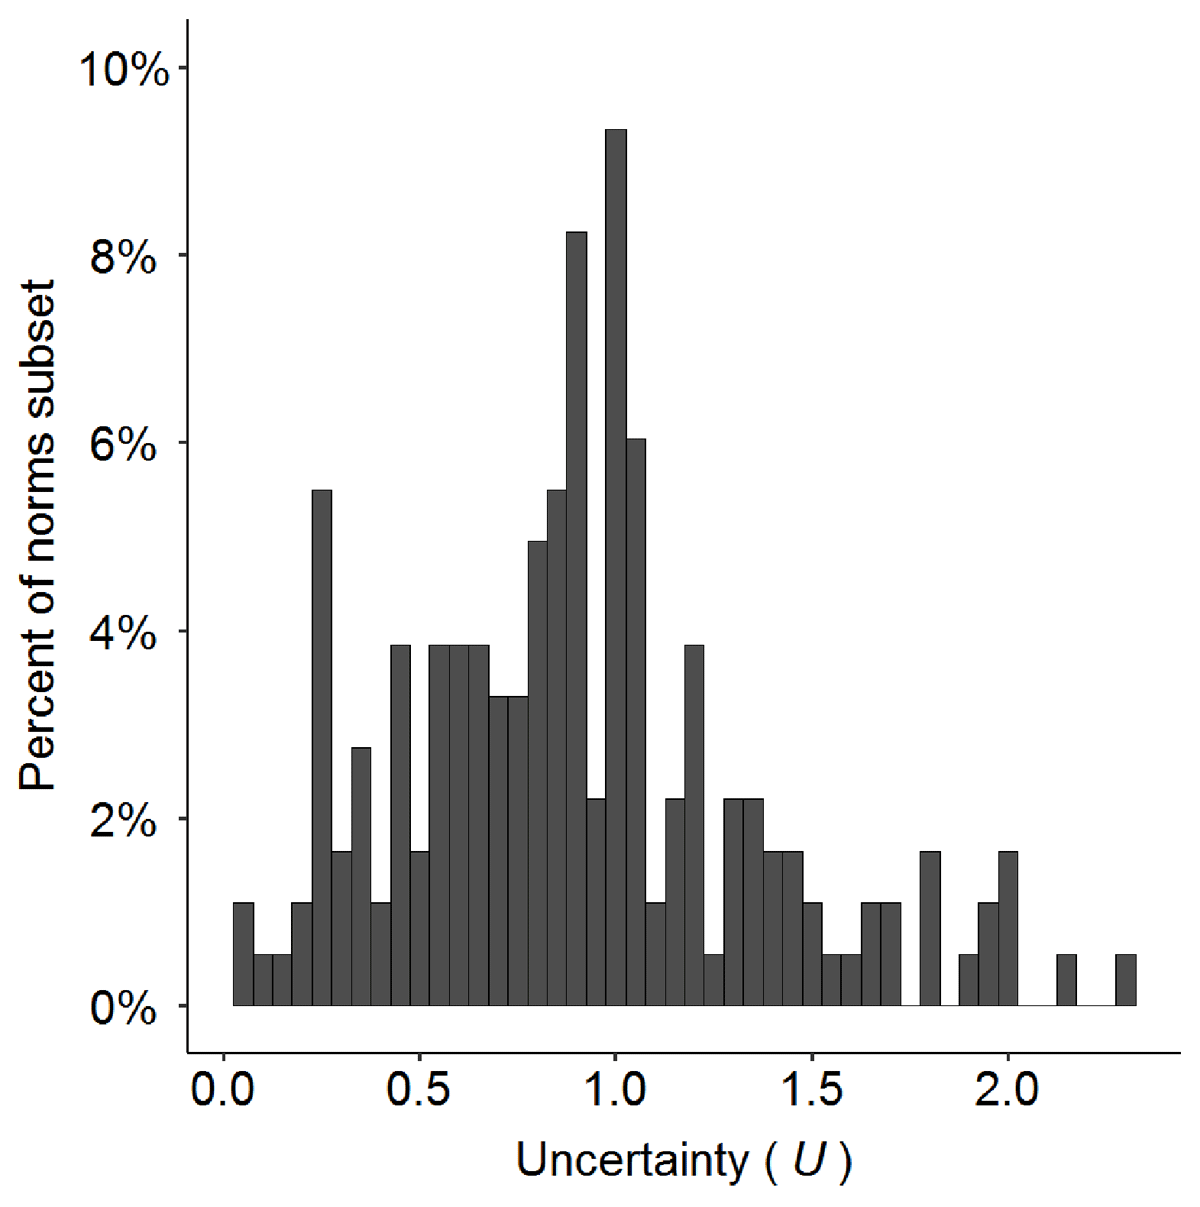
Figure 5
Percentage of the 182 items in the norms subset (y-axis) according to the U measure of the item (x-axis), which is a measure of overall ambiguity. U values near 0 indicate very low ambiguity, and larger values indicate greater ambiguity.
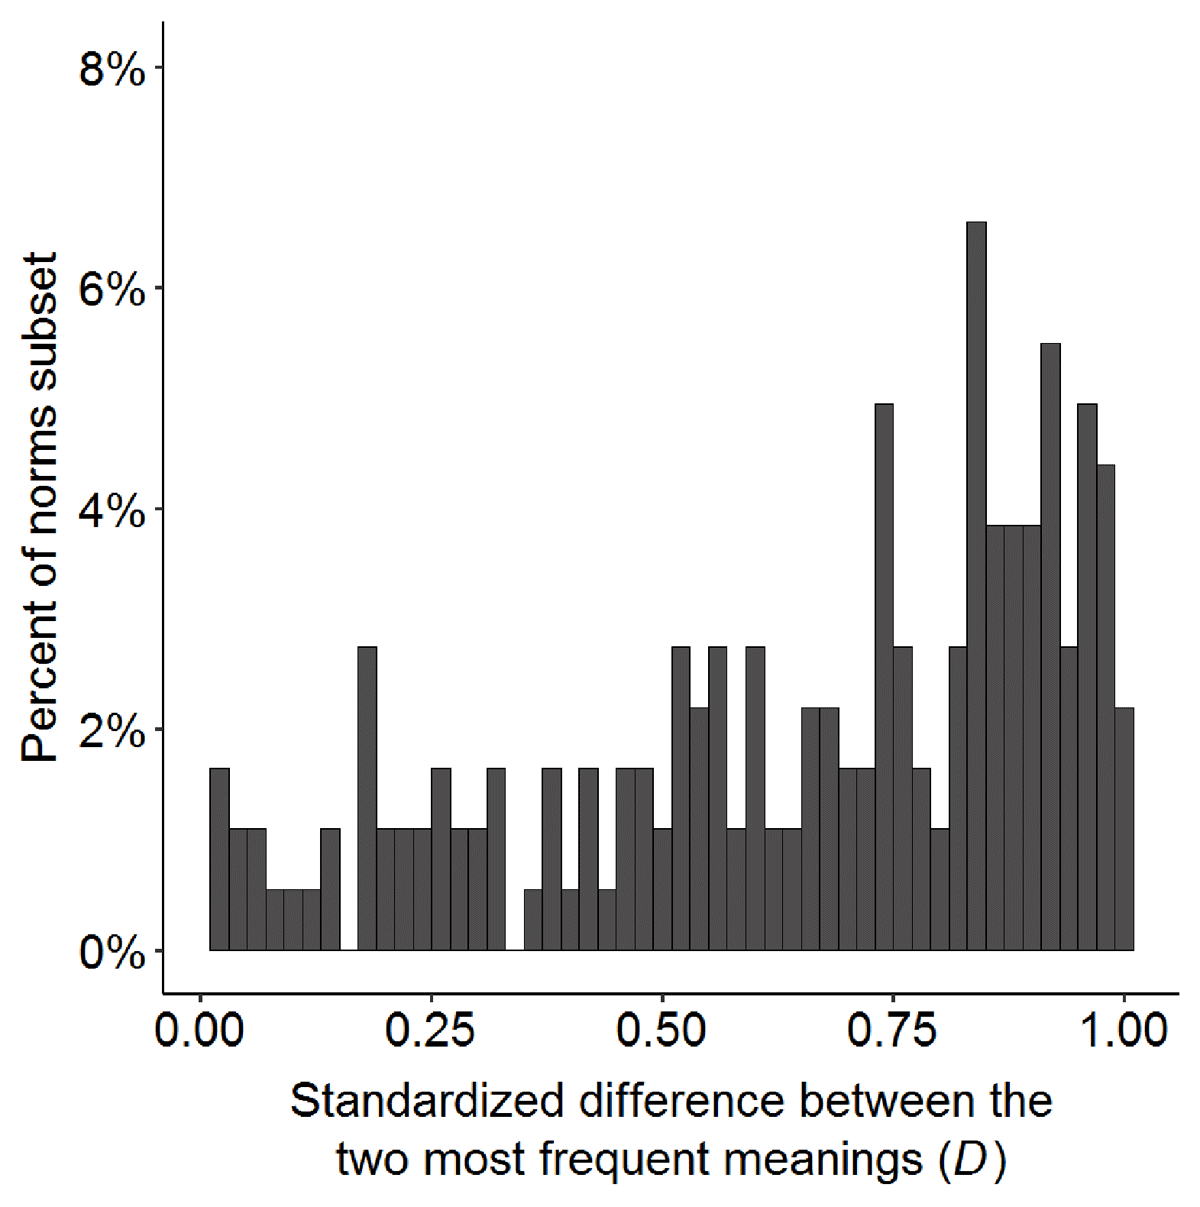
Figure 6
Percentage of the 182 items in the norms subset (y-axis) according to the D measure of the item (x-axis), which reflects the degree to which the item is balanced or biased. D values near 0 indicate that the item is balanced, i.e. the two most common meanings are similar in frequency. D values near 1 indicate that the item is biased, i.e. the most common (dominant) meaning is much more frequent than the next most common meaning.