
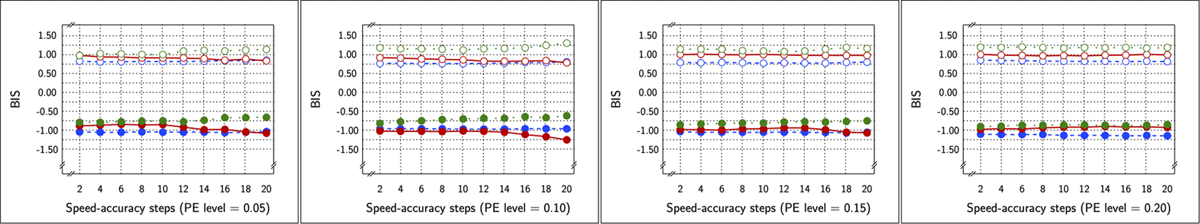
Figure 1
Sample Means in Study 1 as a function of Test × SAT Settings × SAT size (x-axis in each panel) × PE level (panels from left to right) for correct BIS. The curves within each panel show the cell means of the Test × SAT Settings combinations. Legend: open circles for control condition and closed circles for experimental condition; red solid lines for speed stress, blue dashes for neutral SAT, and green dotted lines for accuracy stress.
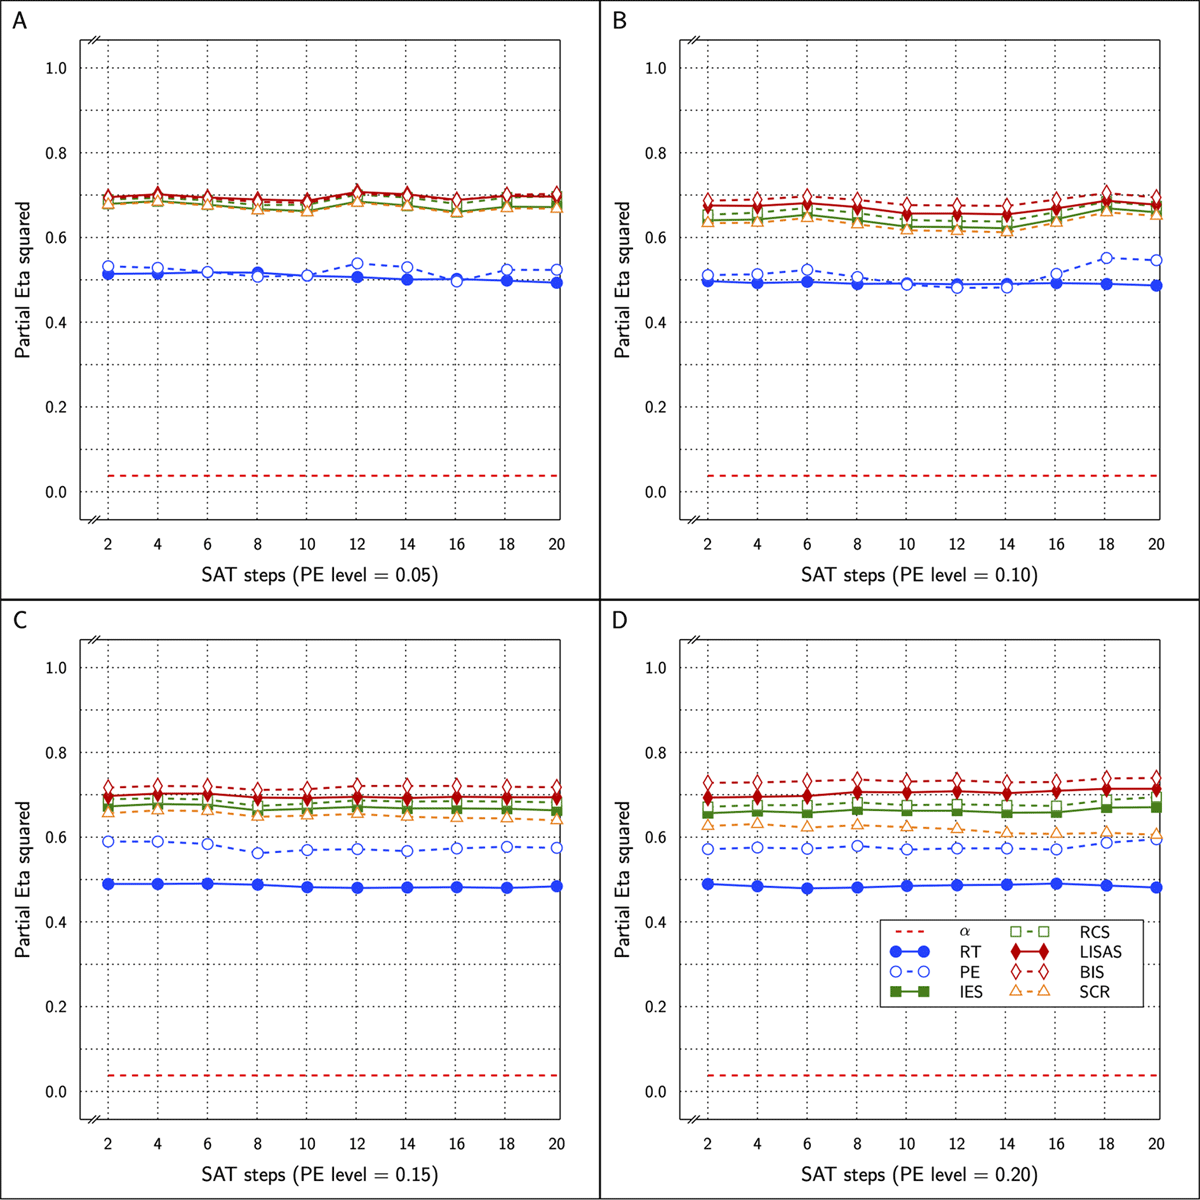
Figure 2
Estimated effect size (ηp2) of the Test effect as a function of the variation in PE (panels A to D) and in SAT size for RT and PE for the five combined measures in Study 1.
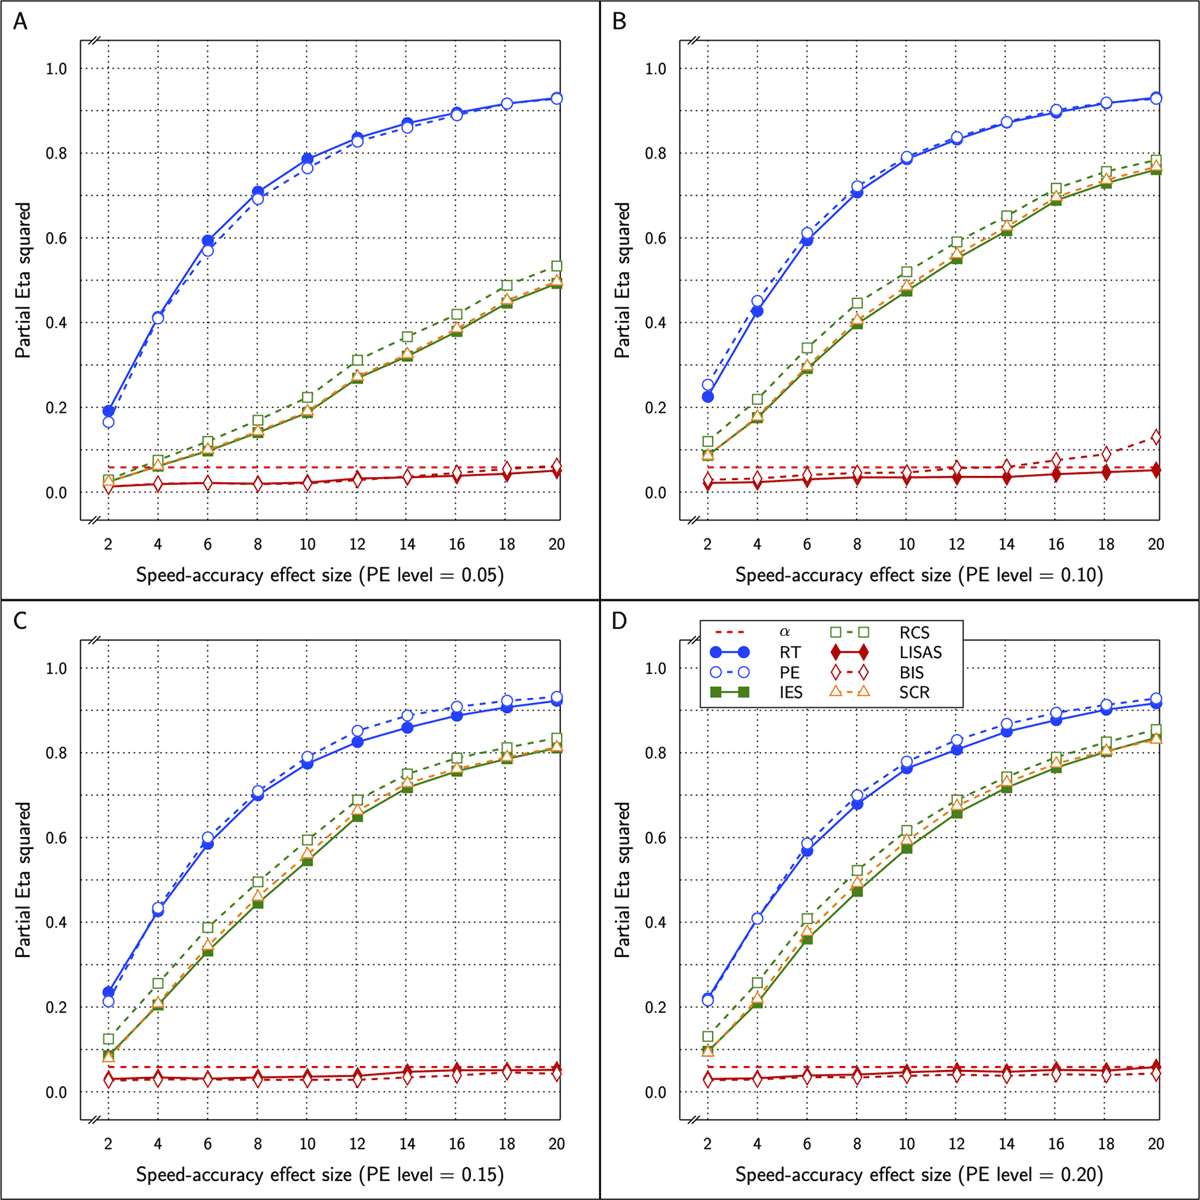
Figure 3
Estimated effect size (ηp2) of SAT Settings as a function of PE level and SAT strength for RT and PE and the five combined measures in Study 1. The dashed line (labeled α) represents the significance threshold for these data.
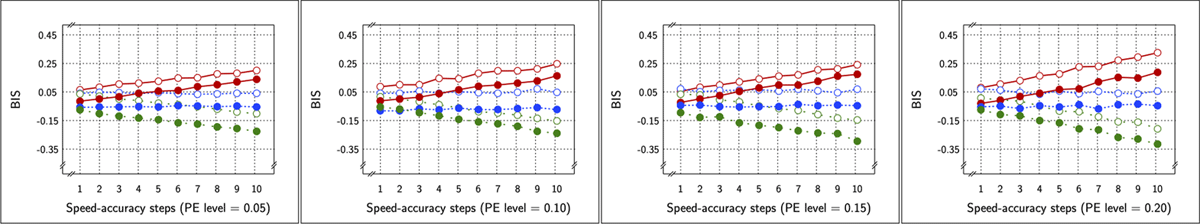
Figure 4
Sample Means in Study 2 as a function of Test × SAT Settings × SAT size (x-axis in each panel) × PE level (panels from left to right) for BISc. The curves within each panel show the cell means of the Test × SAT Settings combinations. Legend: open circles for control condition and closed circles for experimental condition; red solid lines for speed stress, blue dashes for neutral SAT, and green dotted lines for accuracy stress.
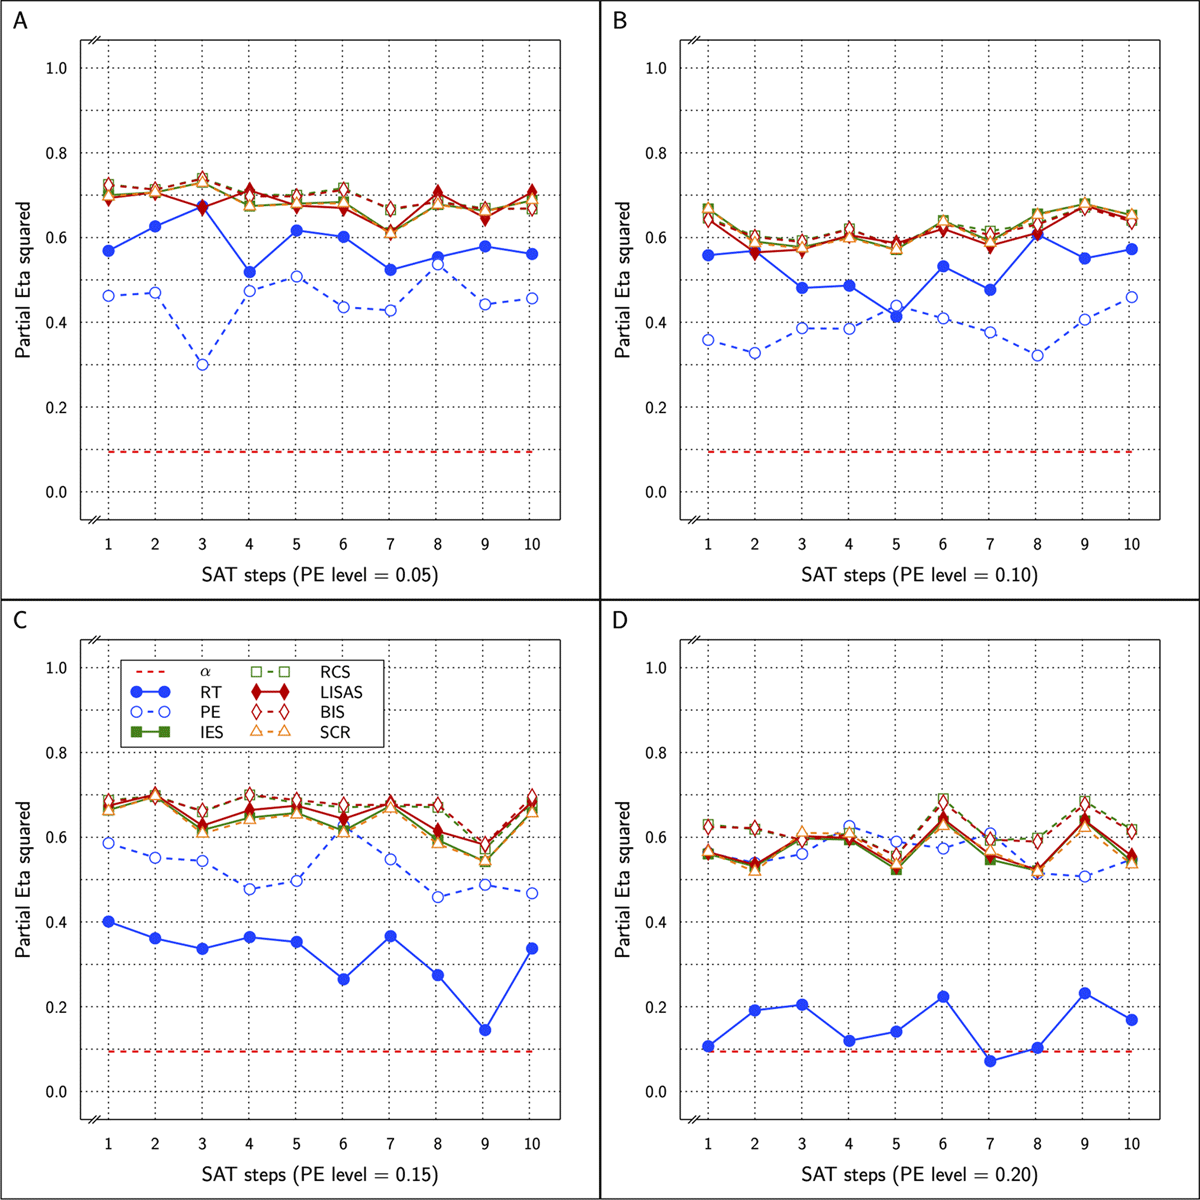
Figure 5
Estimated effect size (ηp2) of the Test effect as a function of the variation in PE (panels A to D) and in SAT size for RT and PE for the five combined measures in Study 2.
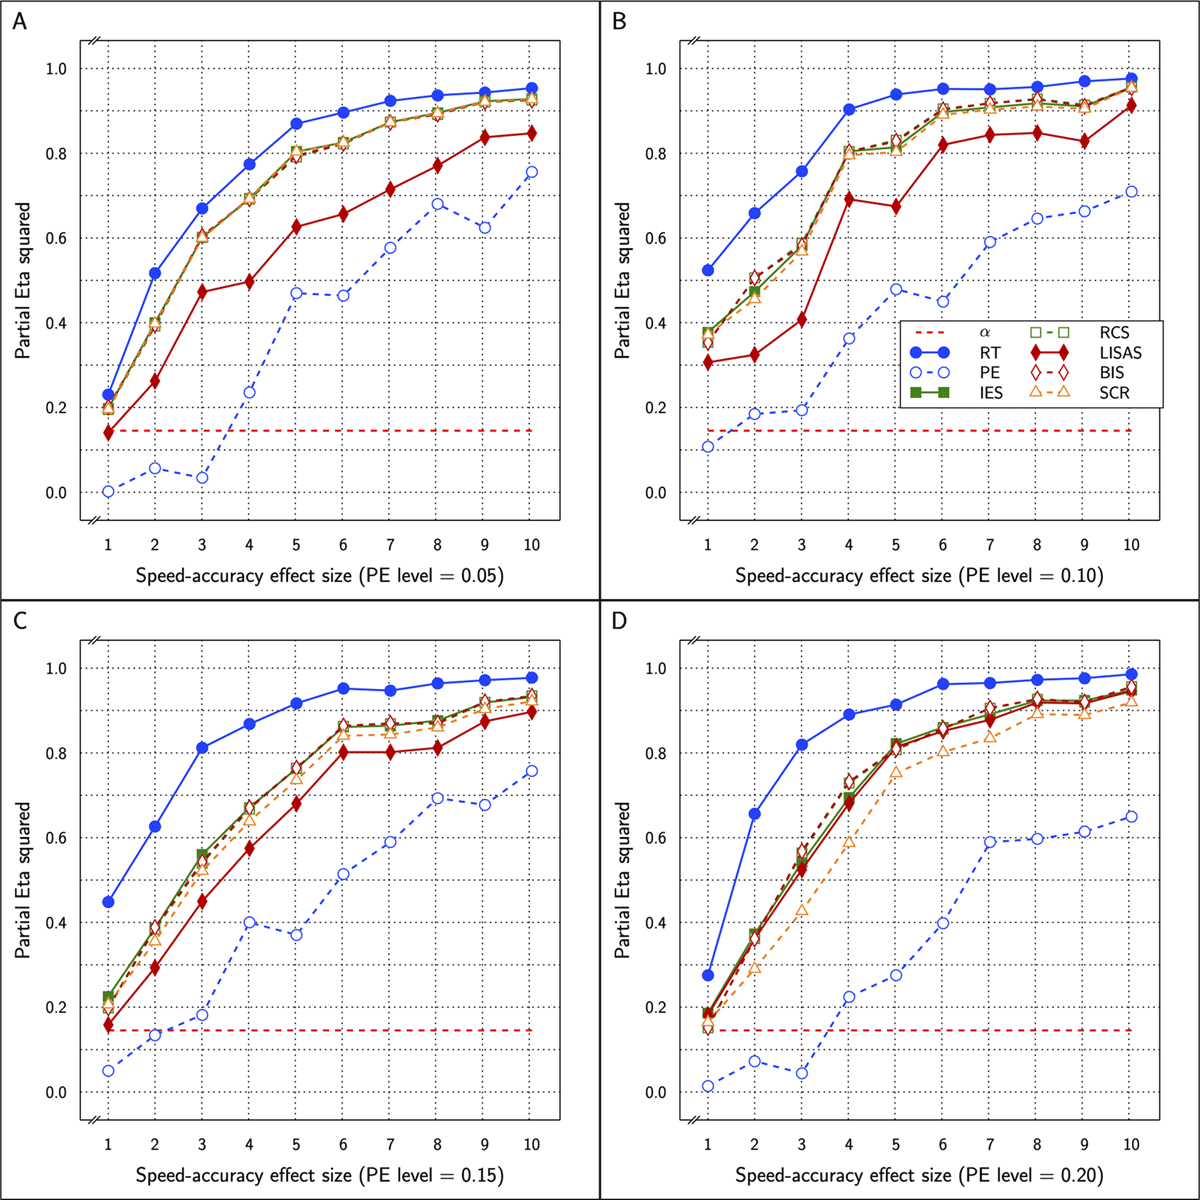
Figure 6
Estimated effect size (ηp2) of SAT Settings as a function of PE level and SAT strength for RT and PE and the five combined measures in Study 2. The dashed line (labeled α) represents the significance threshold for these data.
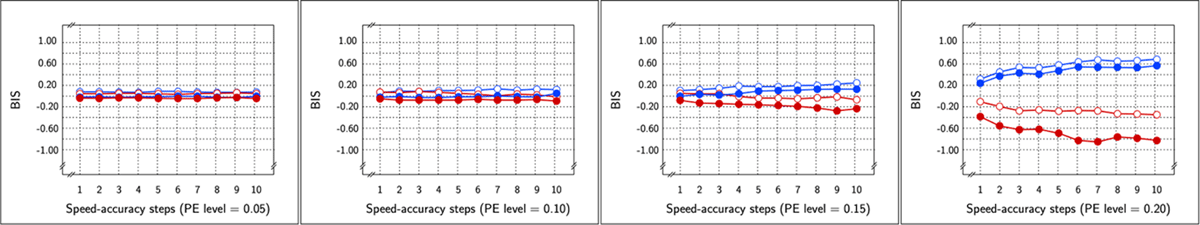
Figure 7
Sample Means in Study 3 as a function of Test × SAT Settings × SAT size (x-axis in each panel) × PE level (panels from left to right) for correct BIS. The curves within each panel show the cell means of the Test × SAT Settings combinations. Legend: Blue for SAT-absent conditions, red for SAT-present conditions; open circles for control condition, closed circles for experimental condition.
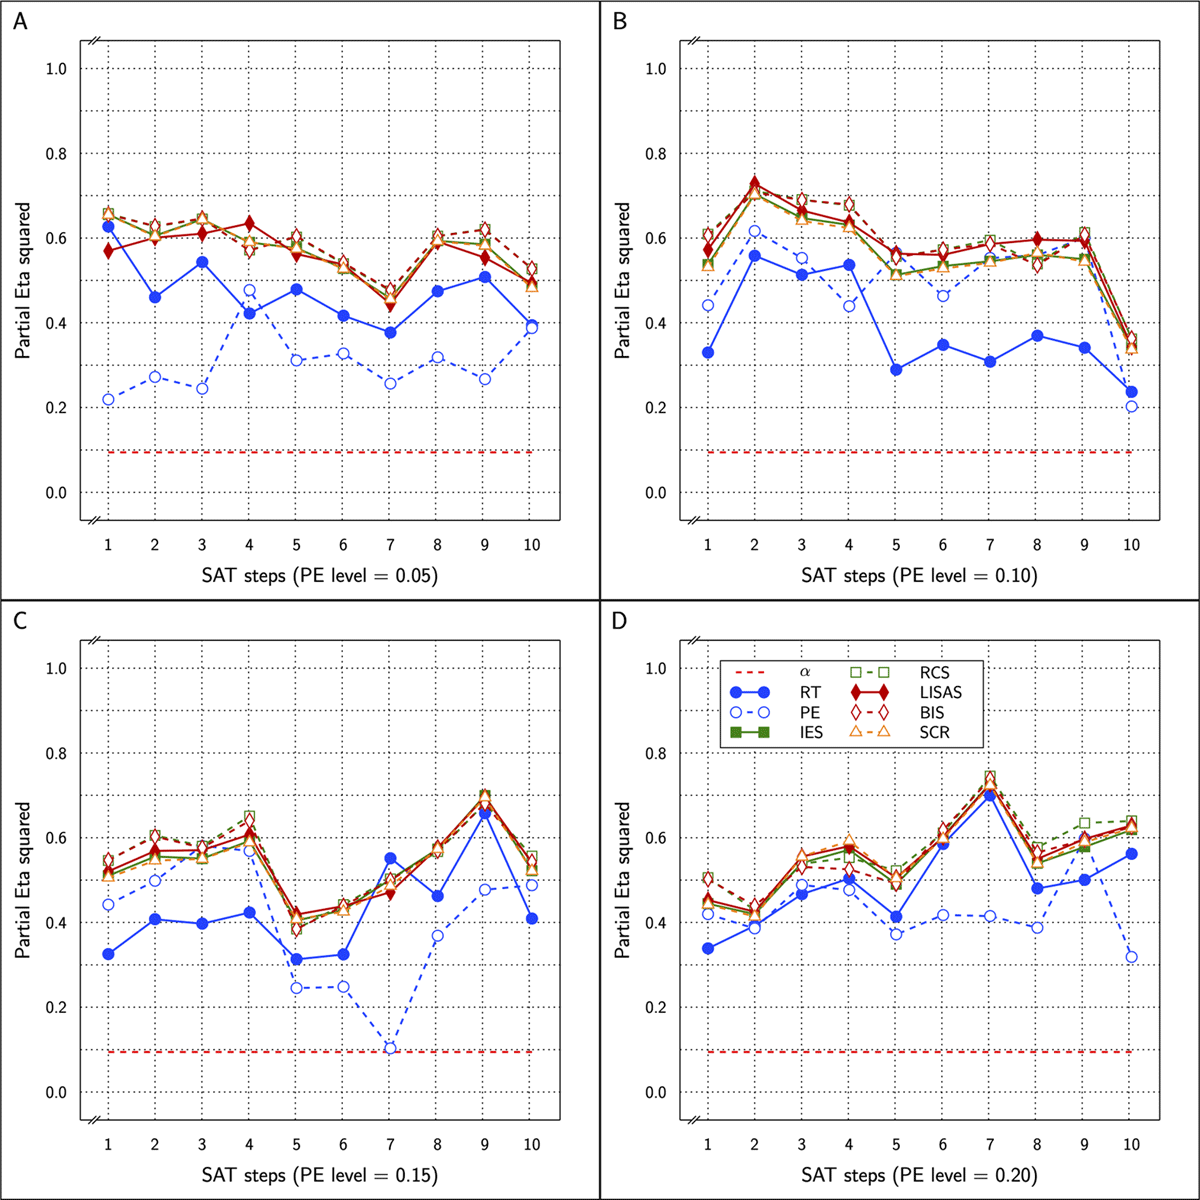
Figure 8
Estimated effect size (ηp2) of the Test effect as a function of the variation in PE (panels A to D) and in SAT size for RT and PE for the five combined measures in Study 3.
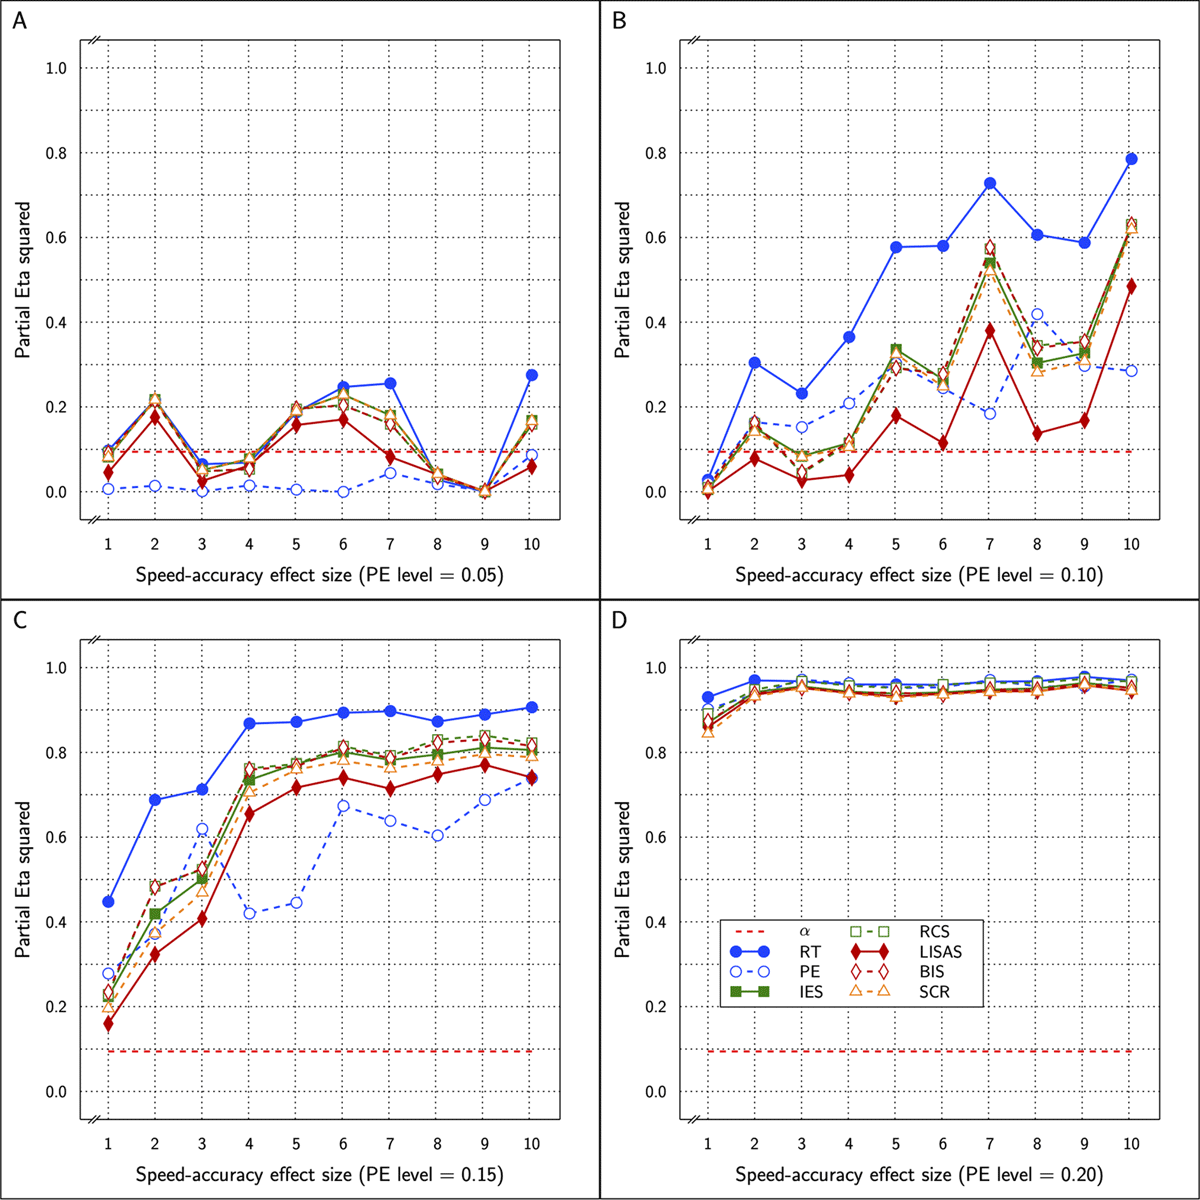
Figure 9
Estimated effect size (ηp2) of SAT Settings as a function of PE level and SAT strength for RT and PE and the five combined measures in Study 3. The dashed line (labeled α) represents the significance threshold for these data.
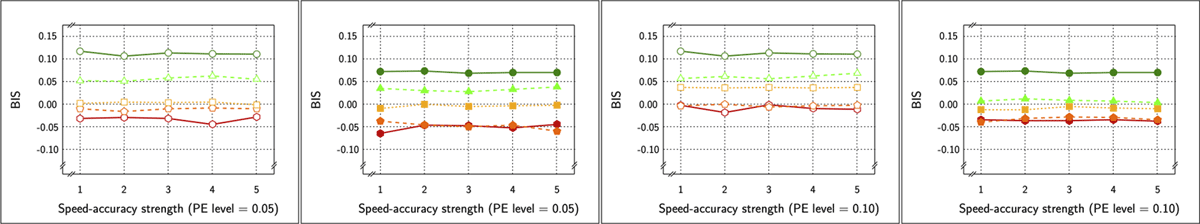
Figure 10
Sample Means in Study 4 as a function of Test × SAT Targets × SAT size (x-axis in each panel) × PE level. The row of panels shows the BISc means with respect to PE level × Test, such that the two panels on the left show the control and the experimental condition means at PE level 0.05, and the two panels on the right show the control and experimental condition means at PE level 0.10. Legend: open circles for control condition and closed circles for experimental condition; red solid lines for 75%, orange dashed lines for 80%, yellow dotted lines for 85%, green dashed lines for 90%, and dark green solid lines for 95% target.
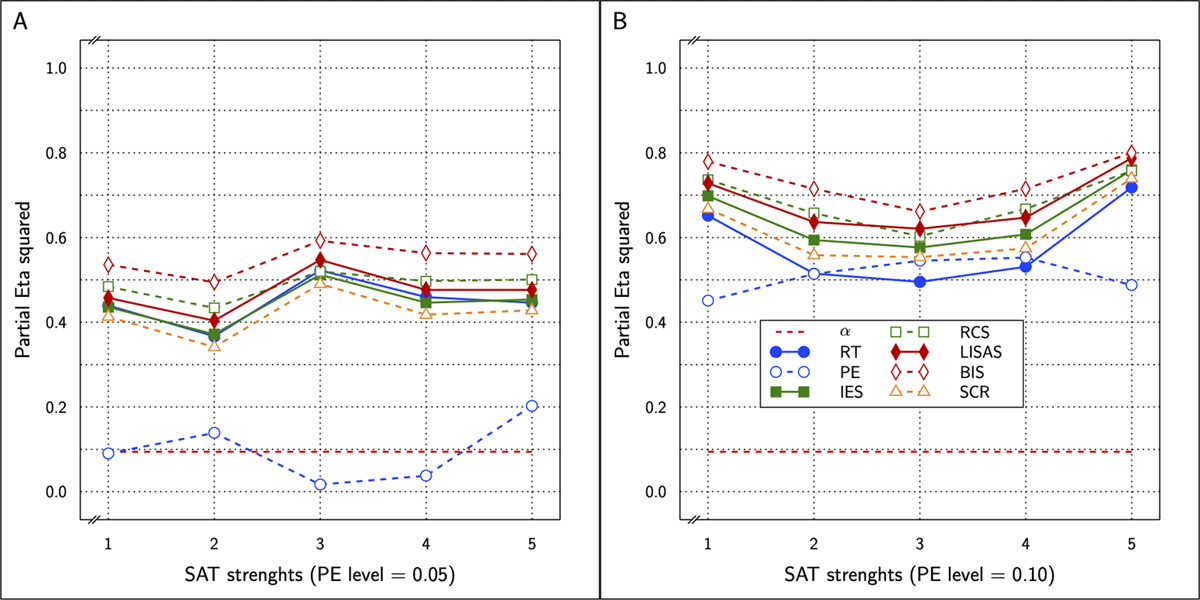
Figure 11
Estimated effect size (ηp2) of the Test effect as a function of the variation in PE (panels A and B) and in SAT size for RT and PE and for the five combined measures in Study 4.
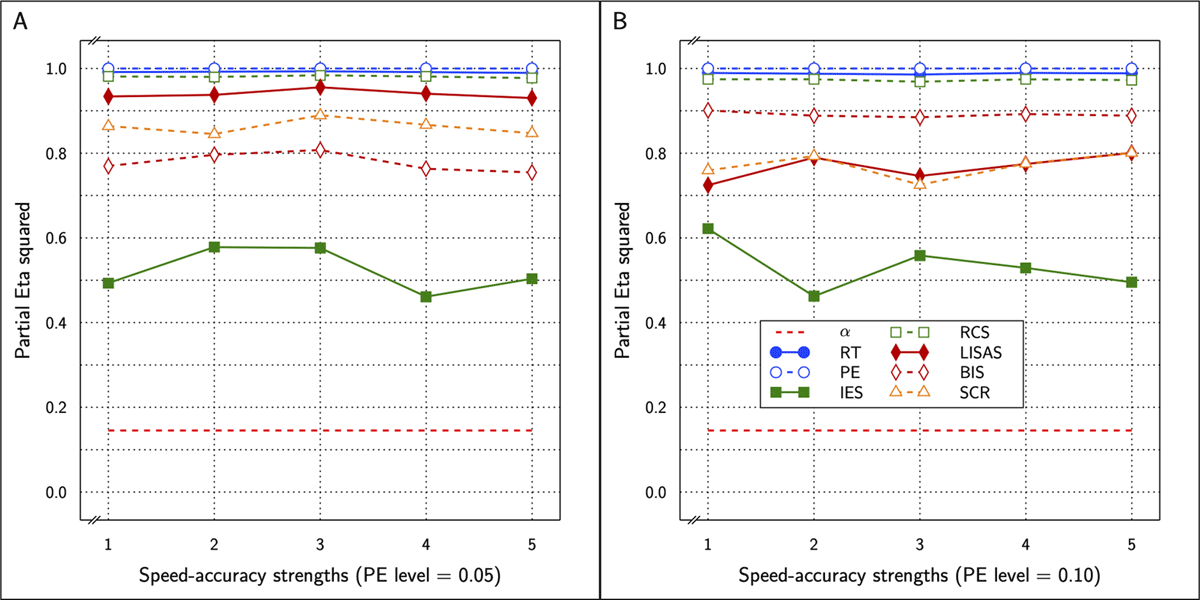
Figure 12
Estimated effect size (ηp2) of SAT Settings as a function of PE level and SAT strength for RT and PE and the five combined measures in Study 4. The dashed line (labeled α) represents the significance threshold for these data.