
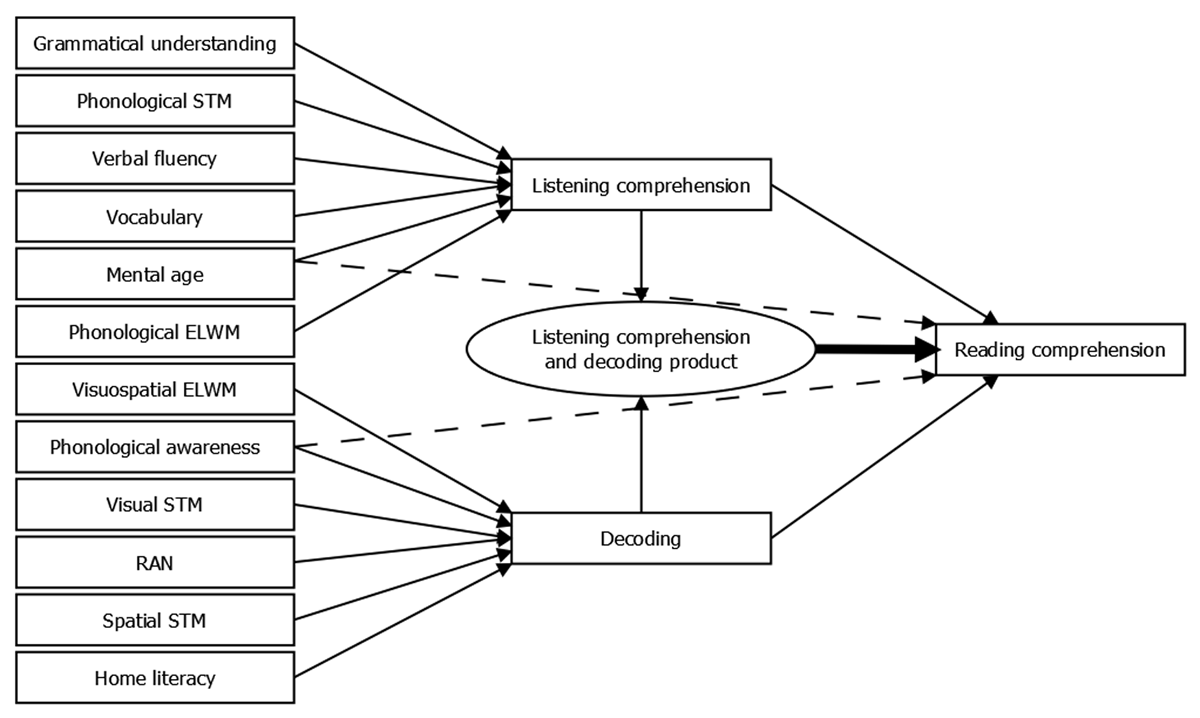
Figure 1
Diagram of the Simple View of Reading hypotheses.
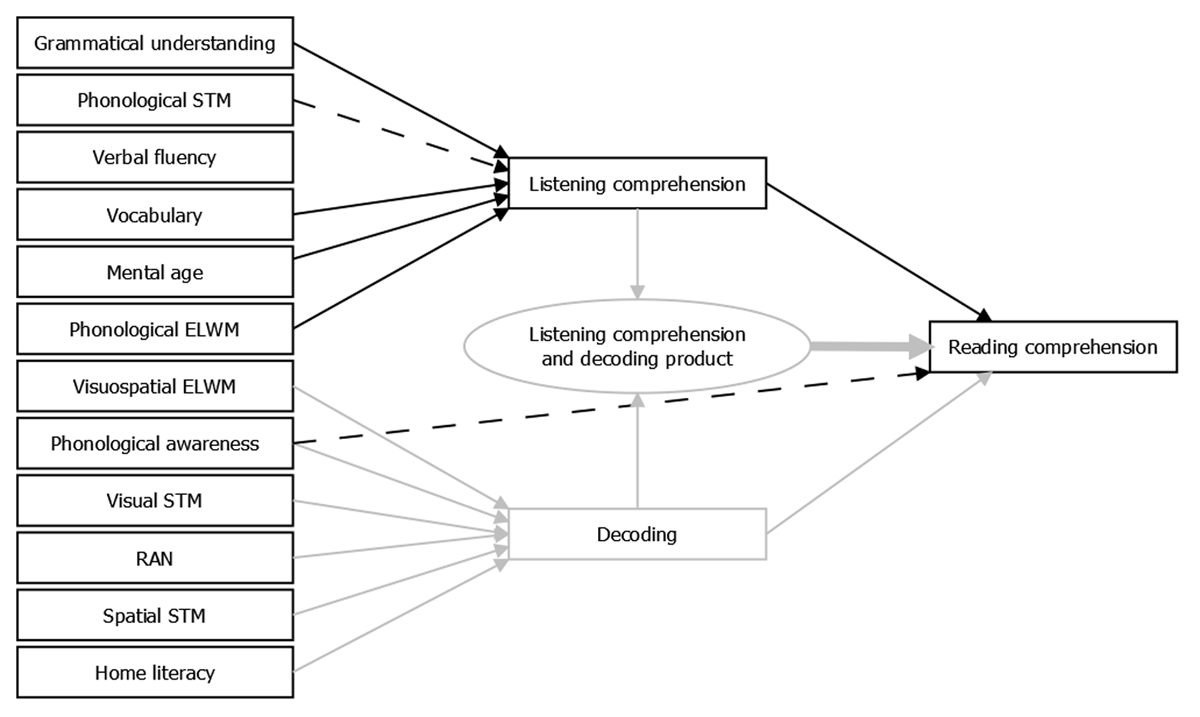
Figure 2
Diagram of the delay and difference hypotheses.
Table 1
Descriptive statistics of participant characteristics and task performances (raw scores) of adolescents with intellectual disability (n = 136).
| TEST | M | SD | MIN | MAX | SKEWNESS | KURTOSIS |
|---|---|---|---|---|---|---|
| Chronological age (months) | 189.61 | 25.87 | 146 | 239 | 0.26 | –1.02 |
| Mental age (months) | 112.88 | 25.26 | 63 | 190 | 0.62 | 0.31 |
| IQ | 59.43 | 9.72 | 40 | 88 | 0.30 | –0.08 |
| Reading comprehension | 18.04 | 12.54 | 2 | 56 | 0.81 | 0.10 |
| Listening comprehension | 9.28 | 3.73 | 0 | 15 | –0.57 | –0.17 |
| Word recognition timed | 45.10 | 17.76 | 4 | 94 | 0.03 | –0.55 |
| Word recognition untimed | 76.48 | 18.87 | 13 | 99 | –1.02 | 0.32 |
| Phonological decoding timed | 23.28 | 11.75 | 2 | 55 | 0.32 | –0.71 |
| Phonological decoding untimed | 36.18 | 16.38 | 2 | 61 | –0.40 | –1.02 |
| Blending | 15.71 | 3.66 | 2 | 20 | –0.94 | 0.47 |
| Elision | 9.91 | 5.90 | 0 | 19 | 0.12 | –1.47 |
| 46-items | 18.26 | 14.93 | 0 | 43 | 0.26 | –1.48 |
| RAN colors | 68.16 | 22.38 | 33 | 184 | 1.40 | 4.15 |
| RAN letters | 44.29 | 16.33 | 22 | 117 | 1.50 | 2.91 |
| Verbal fluency category | 25.87 | 9.35 | 4 | 58 | 0.50 | 0.73 |
| Verbal fluency letters | 19.01 | 9.95 | 0 | 48 | 0.57 | –0.25 |
| Vocabulary | 131.15 | 27.35 | 33 | 179 | –0.69 | 0.39 |
| Grammatical comprehension | 11.10 | 4.10 | 2 | 18 | –0.38 | –0.90 |
| Phonological STM | 8.45 | 2.57 | 3 | 18 | 0.60 | 1.16 |
| Spatial STM | 9.97 | 2.74 | 2 | 18 | –0.15 | 0.30 |
| Visual STM | 9.62 | 4.13 | 0 | 16 | –0.81 | –0.23 |
| Phonological ELWM | 4.88 | 2.01 | 0 | 10 | 0.15 | –0.40 |
| Visuospatial ELWM | 6.97 | 2.97 | 3 | 17 | 0.96 | 0.74 |
| Home literacy | 44.37 | 5.84 | 27 | 59 | –0.15 | –0.12 |
[i] Note: Abbreviations: ELWM = executive-loaded working memory, STM = short-term memory.
Table 2
Correlations between all variables included in the SEM analyses.
| TEST | 1 | 2 | 3 | 4 | 5 | 6 | 7 | 8 | 9 | 10 | 11 | 12 | 13 | 14 | 15 |
|---|---|---|---|---|---|---|---|---|---|---|---|---|---|---|---|
| 1 Reading comprehension | 1.00 | ||||||||||||||
| 2 Listening comprehension | 0.26 | 1.00 | |||||||||||||
| 3 Decoding | 0.62 | 0.10 | 1.00 | ||||||||||||
| 4 Phonological awareness | 0.54 | 0.09 | 0.70 | 1.00 | |||||||||||
| 5 RAN | –0.36 | –0.07 | –0.58 | –0.35 | 1.00 | ||||||||||
| 6 Verbal fluency | 0.31 | 0.25 | 0.29 | 0.27 | –0.40 | 1.00 | |||||||||
| 7 Vocabulary | 0.39 | 0.44 | 0.11 | 0.24 | –0.11 | 0.32 | 1.00 | ||||||||
| 8 Grammatical comprehension | 0.50 | 0.40 | 0.28 | 0.40 | –0.27 | 0.38 | 0.57 | 1.00 | |||||||
| 9 Phonological STM | 0.35 | 0.20 | 0.44 | 0.49 | –0.22 | 0.20 | 0.10 | 0.27 | 1.00 | ||||||
| 10 Spatial STM | 0.14 | 0.13 | 0.19 | 0.19 | –0.25 | 0.18 | 0.11 | 0.23 | 0.23 | 1.00 | |||||
| 11 Visual STM | 0.37 | 0.23 | 0.33 | 0.39 | –0.44 | 0.34 | 0.30 | 0.46 | 0.27 | 0.44 | 1.00 | ||||
| 12 Phonological ELWM | 0.45 | 0.34 | 0.38 | 0.51 | –0.29 | 0.35 | 0.29 | 0.49 | 0.42 | 0.09 | 0.35 | 1.00 | |||
| 13 Visuospatial ELWM | 0.28 | 0.24 | 0.20 | 0.29 | –0.32 | 0.30 | 0.15 | 0.29 | 0.34 | 0.47 | 0.51 | 0.33 | 1.00 | ||
| 14 Home literacy | 0.03 | –0.13 | 0.00 | –0.06 | 0.09 | –0.04 | 0.03 | –0.17 | 0.01 | –0.14 | –0.06 | –0.02 | –0.12 | 1.00 | |
| 15 Mental age | 0.44 | 0.27 | 0.27 | 0.31 | –0.37 | 0.30 | 0.44 | 0.43 | 0.22 | 0.25 | 0.43 | 0.25 | 0.44 | 0.03 | 1.00 |
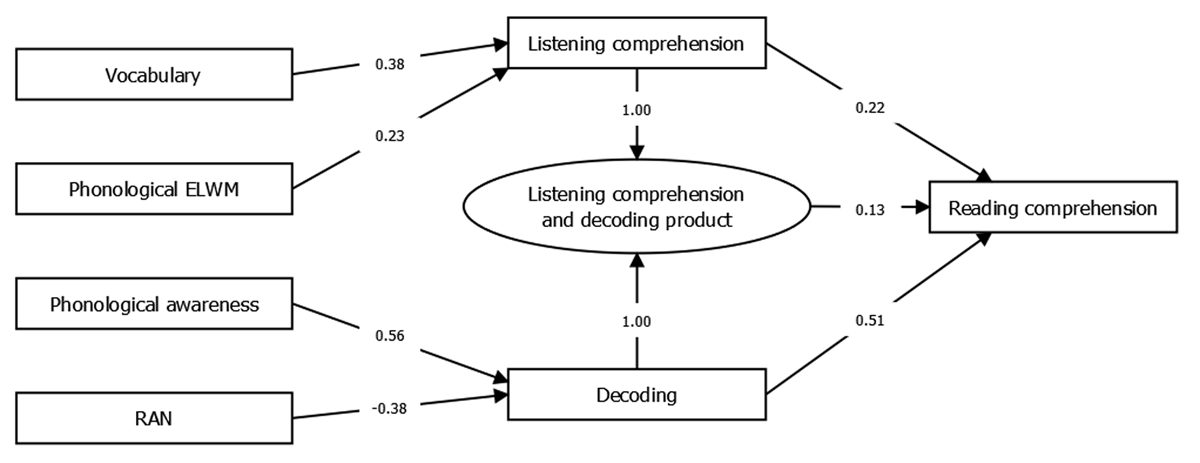
Figure 3
Path model showing the optimized model for hypothesis 1a, the Simple View of Reading hypothesis.
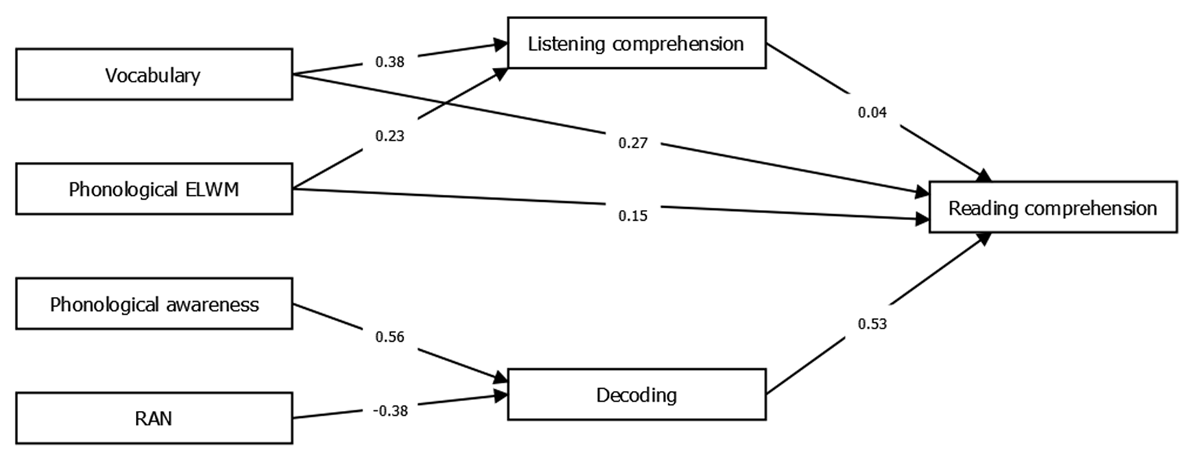
Figure 4
Path model showing the optimized model for hypothesis 1b, Simple View of Reading is not applicable.
Table 3
Unstandardized and standardized estimates for all paths in the optimized model for hypothesis 1b, the Simple View of Reading is not applicable.
| ESTIMATES | |||||
|---|---|---|---|---|---|
| LEFT TERM | OPERATOR | RIGHT TERM | UNSTANDARDIZED | STANDARDIZED | p |
| Regressions | |||||
| Reading comprehension | <- | Decoding | 6.63 | 0.53 | <.001 |
| Reading comprehension | <- | Listening comprehension | 0.14 | 0.04 | .532 |
| Reading comprehension | <- | Phonological ELWM | 0.95 | 0.15 | .028 |
| Reading comprehension | <- | Vocabulary | 0.12 | 0.27 | <.001 |
| Listening comprehension | <- | Phonological ELWM | 0.42 | 0.23 | .003 |
| Listening comprehension | <- | Vocabulary | 0.05 | 0.38 | <.001 |
| Decoding | <- | Phonological awareness | 0.22 | 0.56 | <.001 |
| Decoding | <- | RAN | –0.21 | –0.38 | <.001 |
| Covariances | |||||
| Vocabulary | <–> | Phonological awareness | 14.59 | 0.21 | .012 |
| Vocabulary | <–> | Phonological ELWM | 13.99 | 0.26 | .003 |
| Phonological ELWM | <–> | Phonological awareness | 2.56 | 0.50 | <.001 |
| Phonological ELWM | <–> | RAN | –0.97 | –0.27 | .002 |
| RAN | <–> | Phonological awareness | –1.54 | –0.33 | <.001 |
| Reading comprehension | <–> | Reading comprehension | 76.12 | 0.49 | <.001 |
| Decoding | <–> | Decoding | 0.39 | 0.39 | <.001 |
| Listening comprehension | <–> | Listening comprehension | 10.43 | 0.76 | <.001 |
| Vocabulary | <–> | Vocabulary | 742.27 | 1.00 | <.001 |
| Phonological ELWM | <–> | Phonological ELWM | 3.94 | 1.00 | <.001 |
| Phonological awareness | <–> | Phonological awareness | 6.54 | 1.00 | <.001 |
| RAN | <–> | RAN | 3.36 | 1.00 | <.001 |