
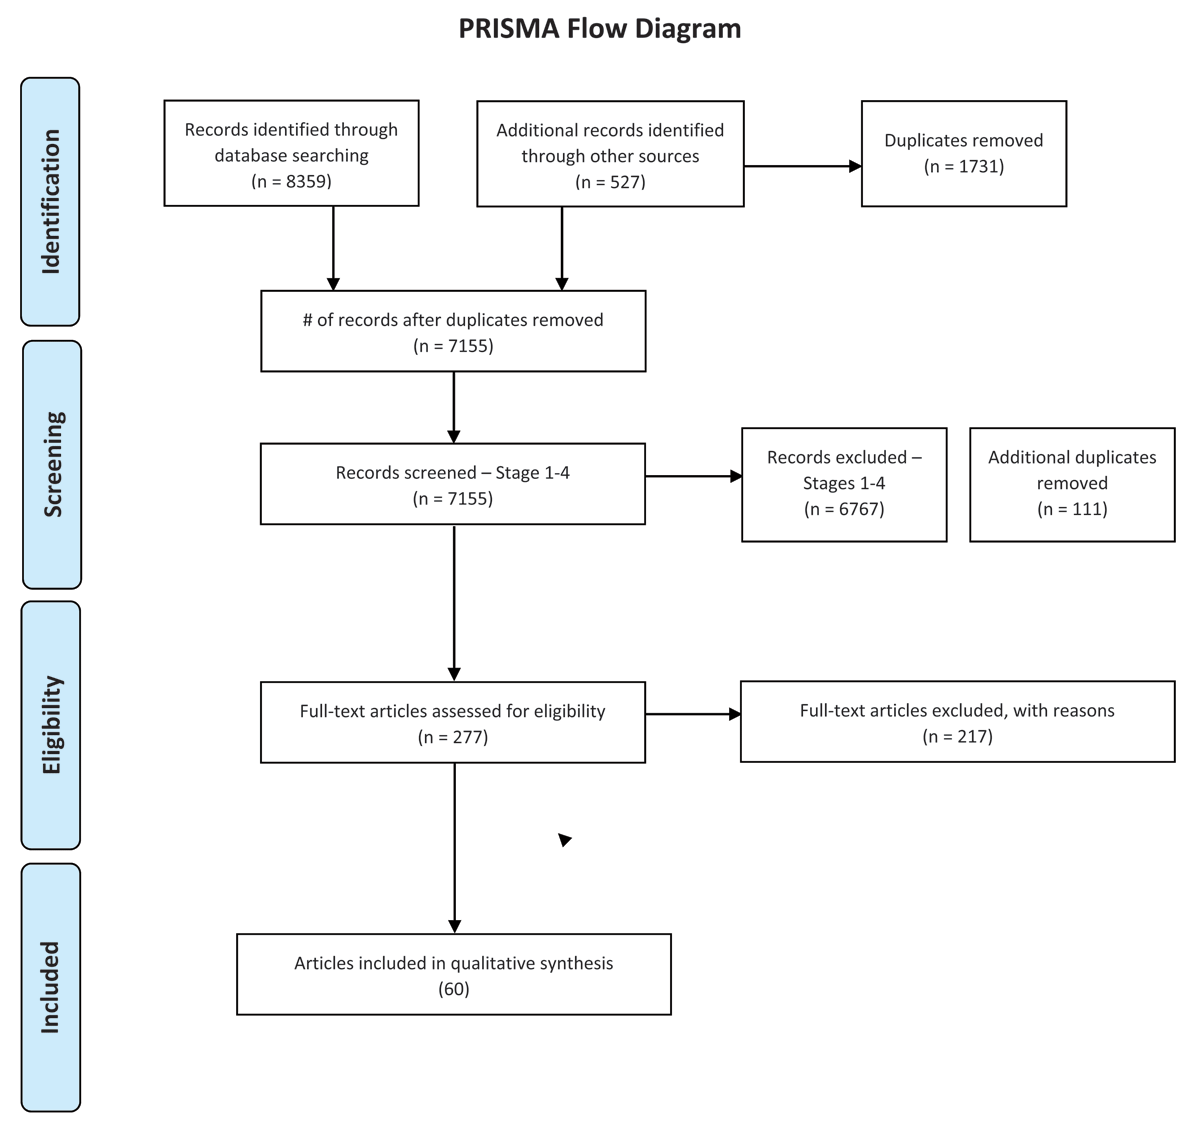
Figure 1
PRISMA Flow Diagram.
Table 1
Infant Group Differences by Task.
| COGNITIVE ABILITY | TASK (# OF EXPERIMENTS) | BILINGUAL ADVANTAGE EXPERIMENTS APPENDIX # | MONOLINGUAL ADVANTAGE EXPERIMENTS APPENDIX # | NO DIFFERENCES EXPERIMENTS APPENDIX # |
|---|---|---|---|---|
| EF | ECBQ (1) | 1 14 | ||
| Gift Delay (2) | 2 7, 12 | |||
| Hide the Pots (1) | 1 4 | |||
| Multilocation (2) | 2 8, 12 | |||
| Reverse Categorization (2) | 2 8, 12 | |||
| Shape Stroop (2) | 1 12 | 1 8 | ||
| Snack Delay (1) | 1 12 | |||
| Spatial Conflict Task (1) | 1 14 | |||
| Spin the Pots (1) | 1 5 | |||
| VExCP (6) | 4 7, 10 | 2 7, 9 | ||
| Visual Search Task (1) | 1 14 | |||
| Memory | DIMG (7) | 5 1, 2, 3, 4, 5, 6 | 1 6 | |
| ToM | Visual Perspective-Taking a (1) | 1 11 | ||
| Info. Processing | Visual Habituation (1) | 1 13 |
[i] Note: Tasks are ordered by ability (EF, memory, ToM, information processing), then alphabetically. VExCP = Visual Expectation Cueing Paradigm; ECBQ = Early Childhood Behavior Questionnaire; DIMG = Deferred Imitation Memory Generalization task.
a Visual Perspective-Taking yielded a bilingual advantage on an easy condition, but not a more difficult condition (Liberman et al., 2017).
Table 2
Preschool-Age Group Differences by Task.
| COGNITIVE ABILITY | TASK (# OF EXPERIMENTS) | BILINGUAL ADVANTAGE EXPERIMENTS APPENDIX # | MONOLINGUAL ADVANTAGE EXPERIMENTS APPENDIX # | NO DIFFERENCES EXPERIMENTS APPENDIX # |
|---|---|---|---|---|
| EF | ANT (5) | 4 17, 35, 37, 38 | 1 20 | |
| C-TONI (1) | 1 20 | |||
| K-CPT-2 (1) | 1 21 | |||
| DCCSa (13) | 8 18, 19, 20, 23, 32, 36 | 5 15, 24, 25, 26 | ||
| Delay of Gratification (1) | 1 20 | |||
| FW Digit Span (2) | 2 25, 32 | |||
| BW Digit Span (2) | 2 25, 32 | |||
| Gift Delay (3) | 1 36 | 2 17, 20 | ||
| Go/No-Go (1) | 1 17 | |||
| KRISP (1) | 1 20 | |||
| Listening Span (2) | 1 31 | 1 33 | ||
| Luria Stage 1 task (1) | 1 16 | |||
| Luria Stage 2 task (1) | 1 16 | |||
| Moving Word (1) | 1 18 | |||
| NSND (1) | 1 28 | |||
| Pattern Recall (1) | 1 33 | |||
| Simon (3) | 1 32 | 2 33, 58 | ||
| Simon Says tasks (4) | 1 24 | 3 20, 23, 36 | ||
| Statue task (1) | 1 20 | |||
| Stroop (+ Stroop-like; 5) | 1 36 | 4 23, 24, 25, 34 | ||
| TEC (1) | 1 26 | |||
| Visually Cued Recall (1) | 1 20 | |||
| BW Word Span (1) | 1 34 | |||
| ToM | Belief-Emotion (1) | 1 29 | ||
| Diverse Beliefs (1) | 1 29 | |||
| Diverse Desires (1) | 1 29 | |||
| FB reasoning (6) | ||||
| Appearance-Reality – Identitya,b (3) | 3 24, 23, 27 | |||
| Appearance-Reality – Property (1) | 1 24 | |||
| Explicit FB (1) | 1 29 | |||
| Modified FB task (1) | 1 30 | |||
| Object disappearance (1) | 1 24 | |||
| Unexpected locationa (5) | 4 23, 24, 30, 34 | 1 27 | ||
| Unexpected contentsa,b (6) | 4 23, 24, 27, 34 | 2 25, 29 | ||
| Knowledge Access (1) | 1 29 | |||
| Level 2 Perspective-takingb (1) | 1 27 | |||
| Real-Apparent Emotion (1) | 1 29 | |||
| IQ | Atkins Object-fitting Test, Form A (1) | 1 22 | ||
| Stanford Binet Scale, Form L (1) | 1 22 | |||
| Gen. Cog. | McCarthy Scales (1) | 1 58 | ||
| Creativity | CEN (1) | 1 31 |
[i] Note: Tasks are ordered by ability (EF, ToM, IQ, general cognitive ability, creativity), then alphabetically. ANT = Attention Network Task; C=TONI = Comprehensive Test of Nonverbal Intelligence; CEN = Creating Equal Number task; DCCS = Dimensional Change Card Sort task; K-CPT-2 = Conner’s Kiddie Continuous Performance Test – Second Edition; KRISP = Kansas Reflection/Impulsivity Scale; NSND = Non-Symbolic Numerical Discrimination task; TEC = Tasks of Executive Control.
a In one study that followed a longitudinal design, the DCCS, Unexpected location, Unexpected contents, and Appearance-Reality, Object Identity tasks yielded a bilingual advantage at one time point but not another (Diaz & Farrar, 2018b).b In one study, bilinguals showed an advantage for only one of two versions of each of the following tasks: Appearance-Reality: Object Identity, Level 2 Perspective-taking, and Unexpected Contents (Goetz, 2003).
Table 3
School-Age Group Differences by Task.
| COGNITIVE ABILITY | TASK (# OF EXPERIMENTS) | BILINGUAL ADVANTAGE EXPERIMENTS APPENDIX # | MONOLINGUAL ADVANTAGE EXPERIMENTS APPENDIX # | NO DIFFERENCES EXPERIMENTS APPENDIX # |
|---|---|---|---|---|
| EF | ANT (5) | 2 54, 59 | 3 46, 40, 57 | |
| BST (1) | 1 45 | |||
| Corsi Blocks (1) | 1 50 | |||
| Counting Recall (2) | 2 43, 46 | |||
| Day/Night Stroop (1) | 1 51 | |||
| DCCS (3) | 1 50 | 2 44, 51 | ||
| FW Digit Span (2) | 2 43, 46 | |||
| BW Digit Span (4) | 4 39, 42, 43, 46 | |||
| FW Dot Matrix (1) | 1 47 | |||
| BW Dot Matrix (1) | 1 42 | |||
| Faces task (1) | 1 41 | |||
| Flanker (6) | 3 50, 52, 53 | 3 42, 47, 55 | ||
| Frog Matrices (1) | 1 49 | |||
| Go/No-Go task (1) | 1 45 | |||
| N-back task (2) | 1 39 | 1 45 | ||
| Non-Word Repetition (2) | 1 46 | 1 43 | ||
| Odd-One-Out (1) | 1 47 | |||
| Operation Span (1) | 1 56 | |||
| Rotating Figure task (1) | 1 39 | |||
| Simon (+ Simon-like; 5) | 2 56, 49 | 1 55 | 2 52, 54 | |
| Simon Switching task (1) | 1 56 | |||
| Sky Search (2) | 2 47, 42 | |||
| IQ | RCPM (3) | 1 43 | 2 39, 47 |
[i] Note: Tasks are ordered by ability (EF, IQ), then alphabetically. ANT = Attention Network Task; BST = Bivalent Shape Task; DCCS = Dimensional Change Card Sort task; RCPM = Raven’s Colored Progressive Matrices.
Table 4
Adolescent Group Differences by Task Across Experiments.
| COGNITIVE ABILITY | TASK (# OF EXPERIMENTS) | BILINGUAL ADVANTAGE EXPERIMENTS APPENDIX # | MONOLINGUAL ADVANTAGE EXPERIMENTS APPENDIX # | NO DIFFERENCES EXPERIMENTS APPENDIX # |
|---|---|---|---|---|
| EF | ANT (1) | 1 59 | ||
| Simon (1) | 1 58 | |||
| Gen. Cog. | RPM (1) | 1 58 | ||
| Stim.-in-Noise | Backward Masking (1) | 1 60 | ||
| Simultaneous Masking (1) | 1 60 | |||
| Word-In-Noise (1) | 1 60 |
[i] Note: Tasks are ordered by ability (EF, general cognitive ability, stimulus-in-noise perception), then alphabetically. ANT = Attention Network Task; RPM = Raven’s Progressive Matrices.
Table 5
Percentage of Experiments for Each Category of Cognitive Ability in Across Age Groups.
| AGE GROUP (# OF EXPERIMENTS) | COGNITIVE ABILITY – % (# OF EXPERIMENTS) | |||||||
|---|---|---|---|---|---|---|---|---|
| EXECUTIVE FUNCTION | MEMORY | THEORY OF MINDb | INTELLIGENCEc | CREATIVITY | GENERAL COGNITIVE ABILITY | STIMULUS-IN-NOISE PERCEPTION | INFORMATION PROCESSING | |
| Infants (18) | 58.8% (11) | 35.3% (7) | 5.9% (1) | – | – | – | – | 5.9% (1) |
| Preschool (29a) | 86.2% (25) | – | 24.1% (7) | 3.4% (1) | 3.4% (1) | 3.4 (1) | – | – |
| School (23a) | 100.0% (23) | – | – | 13.0% (3) | – | – | – | – |
| Adolescents (3a) | 66.6% (2) | – | – | – | – | 33.3% (1) | 33.3% (1) | – |
| % of Total Experiments (71a) | 83.1% (59a) | 9.9% (7) | 11.3% (8) | 5.6% (4) | 1.4% (1) | 1.4% (1a) | 1.4% (1) | 1.4% (1) |
[i] Note: As many experiments measured abilities from more than one category, the percentages for each ability in each age group always add up to more than 100%.
a One experiment in the preschool group and one in the school group also tested adolescent participants (Gathercole et al., 2016; Kapa & Colombo, 2013). These experiments are represented in both the preschool/school and adolescent categories in this table, which is why the total number of experiments in the bottom row is fewer for EF and General Cognitive Ability than the sum of those experiments across all age groups. b The Theory of Mind category includes perspective-taking tasks. c The Intelligence category includes abstract reasoning.
Table 6
Measures Used Across Components of Executive Function by Age Group for Infants, Preschool, and School Children.
| MEASURES | EF COMPONENT | |||||||||||||||||
|---|---|---|---|---|---|---|---|---|---|---|---|---|---|---|---|---|---|---|
| INFANTS | PRESCHOOL | SCHOOL | ||||||||||||||||
| ATTN.a | INHIB.b | CF | WMd | ATTN.a | INHIB.b | CF | SHIFT.c | MON. | ‘COGNITIVE CONTROL’ | WMd | ATTN.a | INHIB.b | SHIFT.c | MON. | ‘COGNITIVE CONTROL’ | WMd | ||
| ANT | 17, 35, 37, 38 | 20 | 40, 46, 54, 57, 59 | 57 | ||||||||||||||
| Bivalent Shape | 45 | |||||||||||||||||
| Corsi Blocks | 50 | |||||||||||||||||
| Counting Recall | 43,46 | |||||||||||||||||
| C-TONI | 20 | |||||||||||||||||
| DCCS | 36 | 15, 18, 19, 20, 36 | 23, 24, 26 | 15, 25, 32, 36 | 36 | 44, 51 | 44, 50 | 44 | ||||||||||
| Delay | 8, 12 | 17,20,36 | ||||||||||||||||
| Delay of Gratification | 20 | |||||||||||||||||
| FW Digit Span | 25, 32 | 43, 46 | ||||||||||||||||
| BW Digit Span | 25, 32, 34 | 39, 42, 43, 46 | ||||||||||||||||
| FW Dot Matrix | 47 | |||||||||||||||||
| BW Dot Matrix | 42 | |||||||||||||||||
| ECBQ | 14 | 14 | ||||||||||||||||
| Faces | 41 | 41 | ||||||||||||||||
| Flanker | 42, 47, 50, 52, 53 | 55 | ||||||||||||||||
| Frog Matrices | 49 | |||||||||||||||||
| Go/No-Go | 17 | 45 | ||||||||||||||||
| Hide the Pots | 4 | |||||||||||||||||
| K-CPT-2 | 21 | |||||||||||||||||
| KRISP | 20 | |||||||||||||||||
| Listening Span | 31, 33 | |||||||||||||||||
| Luria Stage 1 | 16 | |||||||||||||||||
| Luria Stage 2 | 16 | |||||||||||||||||
| Moving Word | 18 | |||||||||||||||||
| Multilocation | 8, 12 | 8 | ||||||||||||||||
| N-back | 39,45 | |||||||||||||||||
| NSND | 28 | |||||||||||||||||
| Non-Word Repetition | 43,46 | |||||||||||||||||
| Odd-One-Out | 47 | |||||||||||||||||
| Operation Span | 56 | |||||||||||||||||
| Pattern Recall | 33 | |||||||||||||||||
| Reverse Cat. | 8, 12 | 8 | ||||||||||||||||
| Rotating Figure | 39 | |||||||||||||||||
| Search tasks | 14 | 42, 47 | ||||||||||||||||
| Simon Says | 20, 23, 24, 36 | |||||||||||||||||
| Simon (+ ‘Simon-like’) | 33 | 32, 58 | 54, 56 | 49, 52 | 55 | 49 | ||||||||||||
| Simon Switching | 45 | |||||||||||||||||
| Spatial Conflict | 14 | |||||||||||||||||
| Spin the Pots | 5 | |||||||||||||||||
| Statue | 20 | |||||||||||||||||
| Stroop (+ ‘Stroop-like’) | 8, 12 | 23, 24, 25, 34, 36 | 49 | |||||||||||||||
| TEC | 26 | |||||||||||||||||
| VExCP | 7,9 | 10 | ||||||||||||||||
| Visually Cued Recall | 20 | |||||||||||||||||
[i] Note: Numbers indicate the Appendix entry for each article. Adolescent experiments are omitted from this table due to the very small number of experiments that tested EF in this population. The two experiments that did measure EF in adolescents measured attention using the ANT (Kapa & Colombo, 2013) and inhibition using the Simon task (Gathercole et al., 2016). ANT = Attention Network Task; CF = Cognitive flexibility; C-TONI = Comprehensive Test of Nonverbal Intelligence; DCCS = Dimensional Change Card Sort Task; ECBQ = Early Childhood Behavior Questionnaire; K-CPT-2 = Conner’s Kiddie Continuous Performance test – Second Edition; KRISP = Kansas Reflection/Impulsivity Scale; NSND = Non-Symbolic Numerical Discrimination task; TEC = Tasks of Executive Control; VExCP = Visual Expectation Cueing Paradigm (also referred to as an ‘anticipatory looking paradigm’); WM = Working memory.
a Experiments assessed different types of attention, including ‘controlled attention’; ‘selective attention’; ‘attentional flexibility’; and ‘attention allocation’. b Experiments assessed different types of inhibition, with some forms of inhibition being referred to using different terms in different articles. The types of inhibition assessed included ‘inhibitory control’ (also ‘interference suppression’); ‘response suppression’ (also ‘response inhibition’); and ‘response control’. c Shifting was also referred to as ‘task switching’ or ‘switching’ in some experiments. d Working memory was also referred to as ‘updating’ in some experiments.