
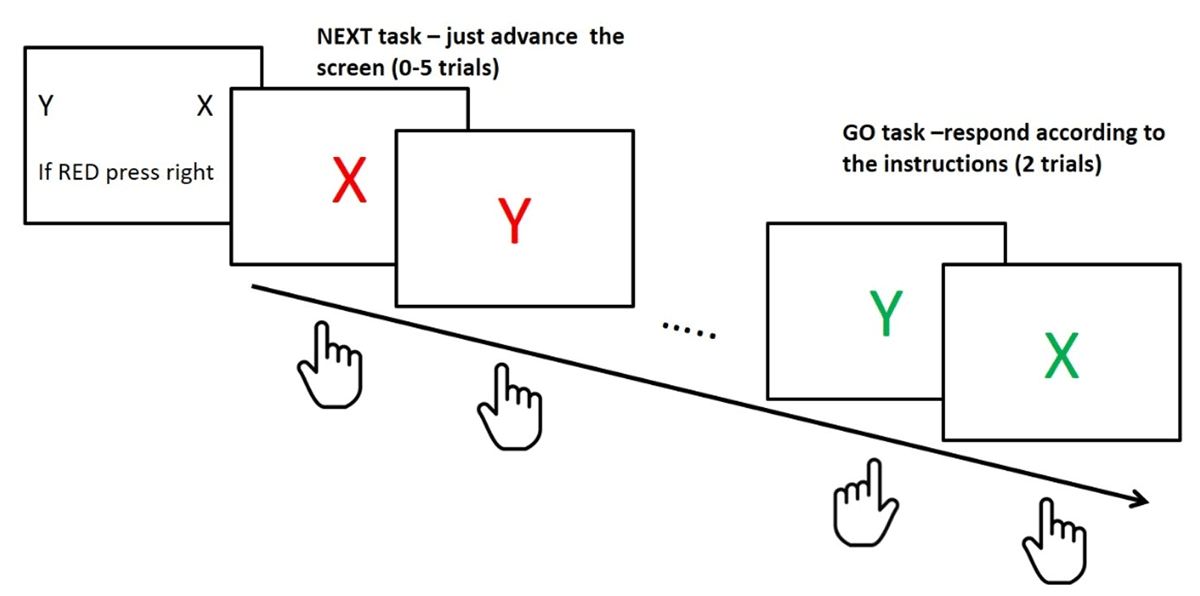
Figure 1
Trial sequence in the NEXT paradigm. Each mini-block consisted of two novel stimulus-response mapping rules (e.g., X-RIGHT and Y-LEFT). On each mini-block, participants are first instructed towards performance in the GO task, in which the stimuli appear in green color and only performed twice. After the instructions and prior to the GO task, a number of targets in red color require a fixed NEXT response (right/left, counterbalanced between participants and constant throughout the experiment).
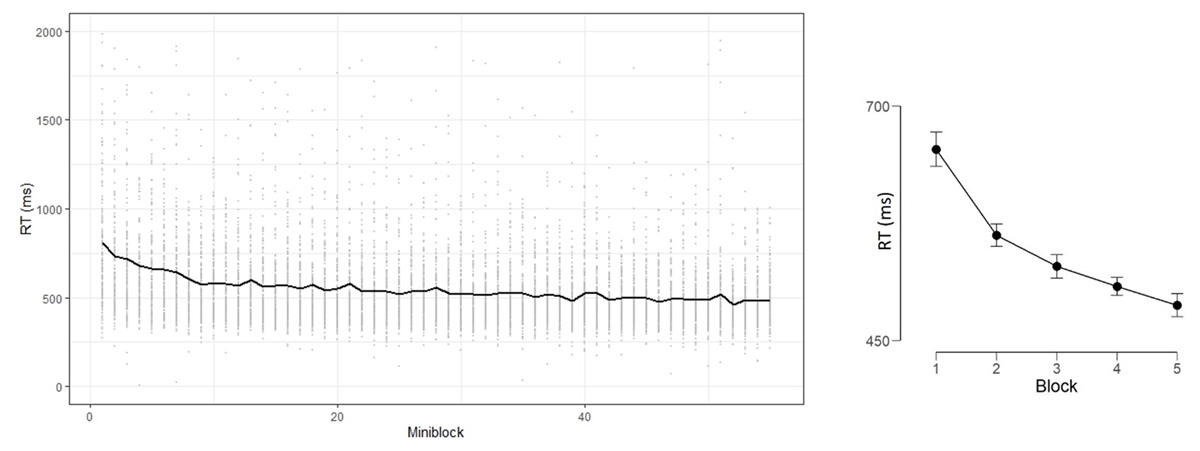
Figure 2
Left panel: RT as function of Miniblock in Experiment 1. Grey dots illustrate the individual variance around the mean. Right panel: RT as a function of Block, error bars represent 95% Bayesian credible interval.
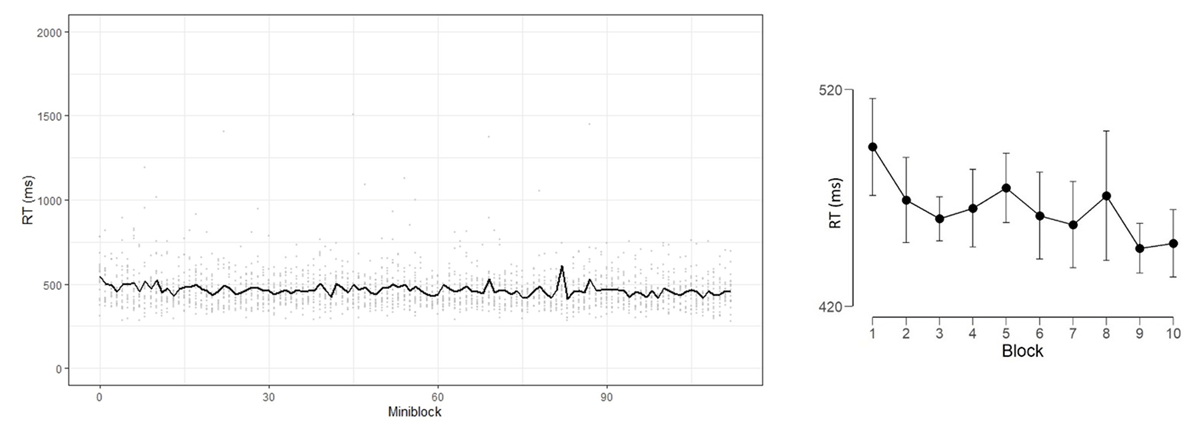
Figure 3
Left panel: RT as function of miniblock in the conceptual replication condition in Experiment 2. Individual data are shown in dots, and the mean can be seen in the line. Right panel: RT as a function of Block, error bars represent 95% Bayesian credible interval.
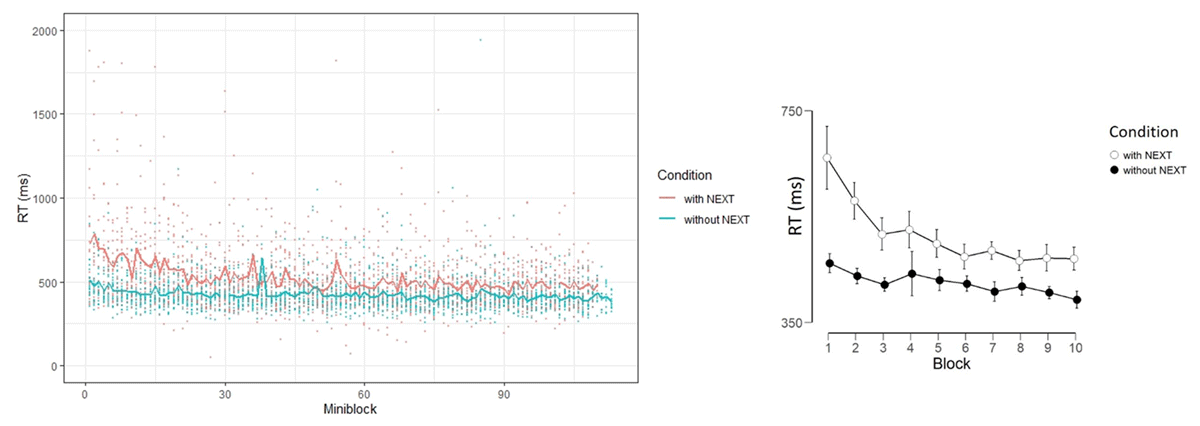
Figure 4
Left panel: RT as function of miniblock in Experiment 3, different conditions are marked with different colors. Individual data are shown in dots, and the mean per condition can be seen in the lines. Right panel: RT as a function of Block and Condition, error bars represent 95% Bayesian credible interval.

Figure 5
Left panel: RT as function of miniblock in Experiment 4, different conditions are marked with different colors. Individual data are shown in dots, and the mean per condition can be seen in the lines. Right panel: RT as a function of Block and Condition, error bars represent 95% Bayesian credible interval.
Table 1
BIC values for fixed (no individual differences)/mixed (individual differences) models of a linear/non-linear function.
| # MODEL | MODEL DEFINITION | ARE EXPERIMENTAL CONDITIONS ALLOWED TO DIFFER IN TERMS OF PARAMETER VALUES | BIC |
|---|---|---|---|
| 1 | Fixed linear | no | 172,514.4 |
| 2 | yes | 172,198.8 | |
| 3 | Mixed linear | no | 168,962.0 |
| 4 | yes | 168,786.0 | |
| 5 | Fixed non-linear | no | 172,374.1 |
| 6 | SP+A+LR a | 171,989.7 | |
| 7 | SP | 172,011.4 | |
| 8 | A | 172,151.0 | |
| 9 | LR | 172,007.9 | |
| 10 | SP+A | 171,981.2 | |
| 11 | SP+LR | 172,016.7 | |
| 12 | A+LR | 171,983.7 | |
| 13 | Mixed non-linear b | no | 168,265.3 |
| 14 | SP+A+LR | 168,275.0 | |
| 15 | SP | 168,242.3 | |
| 16 | A | 168,282.7 | |
| 17 | LR | Did not converge c | |
| 18 | SP+A | 168,264.4 | |
| 19 | SP+LR | 168,263.8 | |
| 20 | A+LR | Did not converge |
[i] a SP = Starting point; A = asymptote; LR = learning rate.
b For simplicity, in this set of models, the random effect was estimated for all three parameters. This will be further tested for the best fitting model.
c Models 17 and 20 did not converge after exceeding the number of maximal iterations, (which was set to 10,000), suggesting that these models are unsuitable for the data.
Table 2
BIC values for models comparing different random effects in the mixed non-linear model.
| # MODEL | MODEL DEFINITION | RANDOM EFFECTS | BIC |
|---|---|---|---|
| 15 | Mixed non-linear, SP differs between the experimental conditions | SP+A+LR | 168,242.3 |
| 21 | SP | 168,823.7 | |
| 22 | A | 169,392.7 | |
| 23 | LR | Did not converge | |
| 24 | SP+A | 168,375.8 | |
| 25 | SP+LR | Did not converge | |
| 26 | A+LR | 168,545.7 |
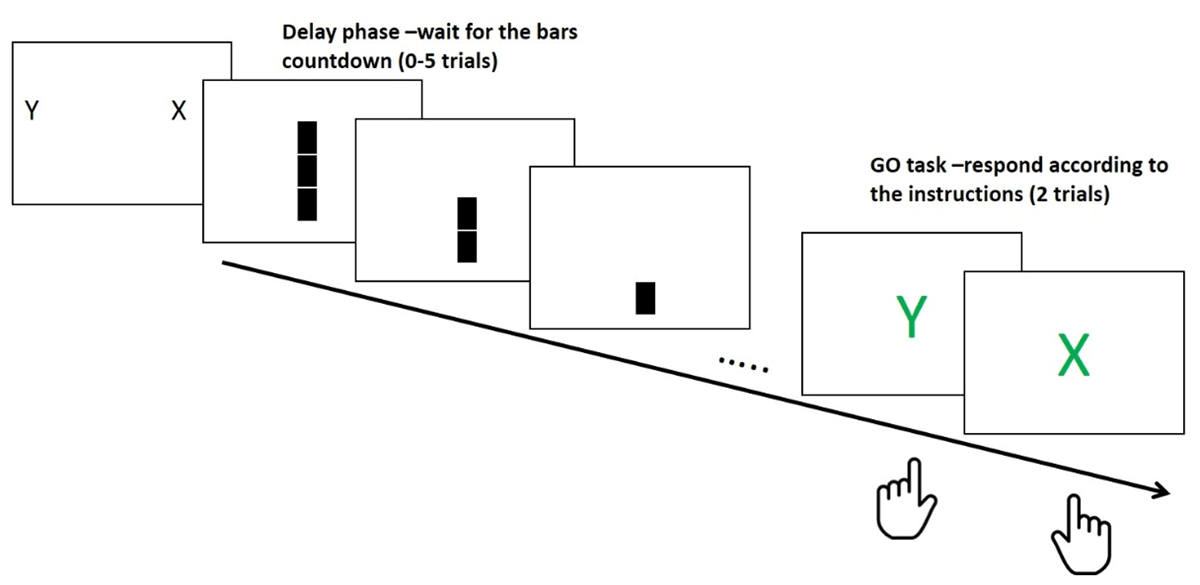
Figure 6
Trial sequence in the “without NEXT_delay” condition.
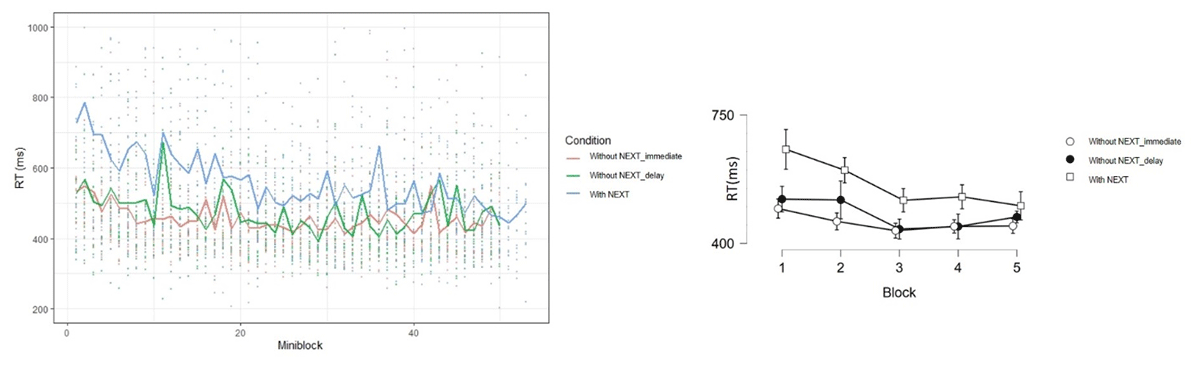
Figure 7
Left panel: RT as function of mini-block in Experiments 3 (with NEXT condition) and 5 (without NEXT conditions), different conditions are marked with different colors. Individual data are shown in dots, and the mean per condition can be seen in the lines. Right panel: RT as a function of Block and Condition, error bars represent 95% Bayesian credible interval.