
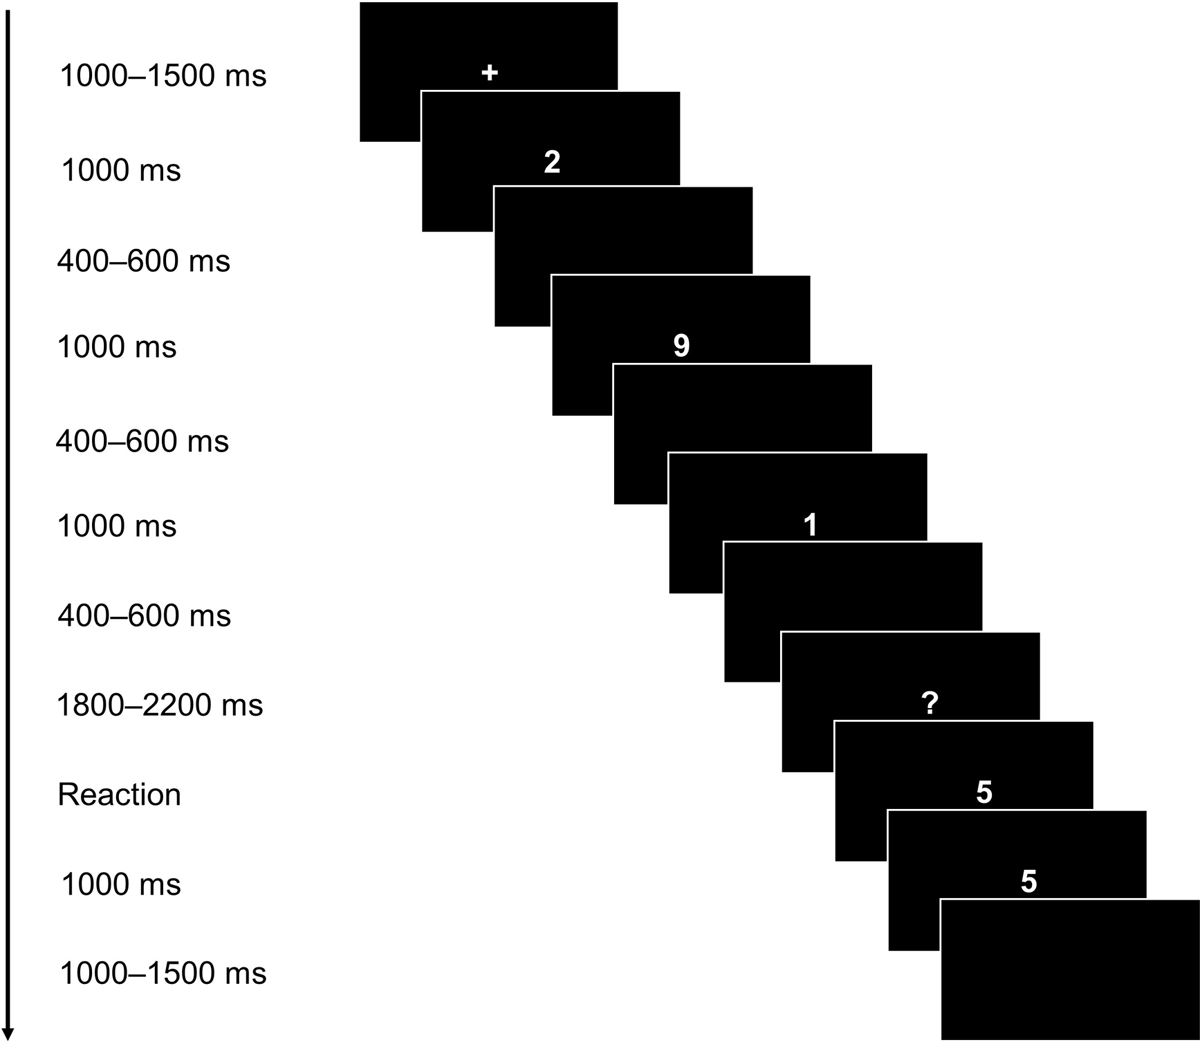
Figure 1
Stimulus Material for the Sternberg Memory Scanning Task. Depicted exemplary for set size 3.
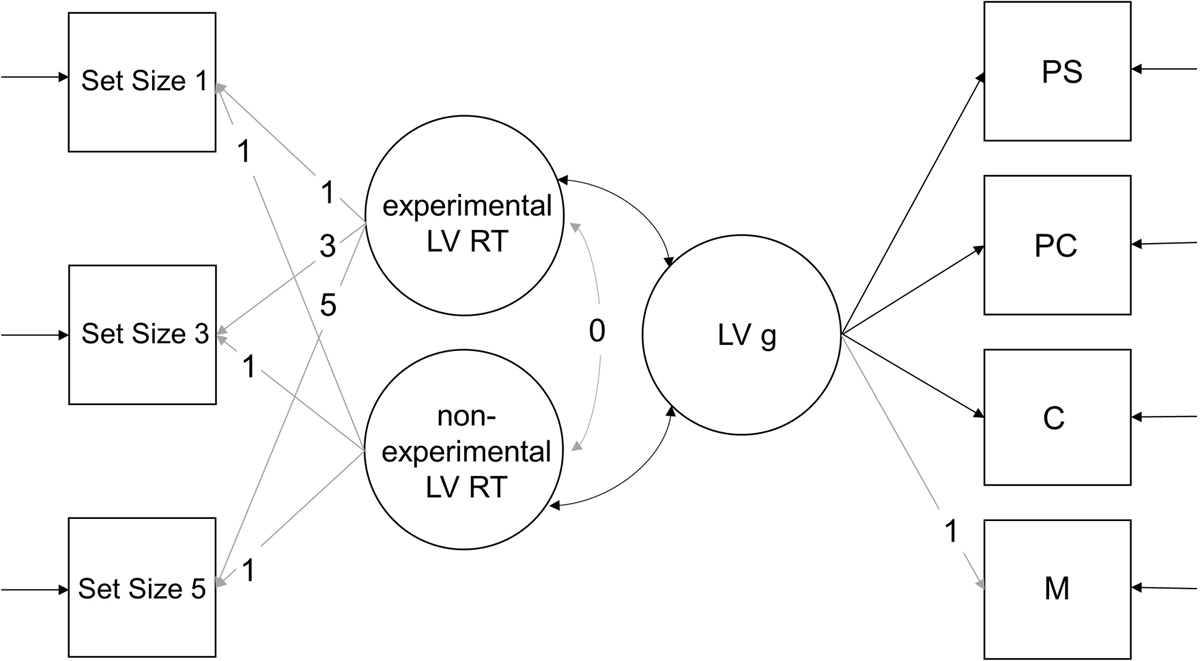
Figure 2
FLM exemplary for RTs. With an experimental latent variable (LV) RT, a non-experimental LV RT, and a LV g. Factor loading of the experimental LV RT were fixed to 1, 3, and 5. Factor loadings of the non-experimental LV RT were fixed to 1. Factor loadings of the LV g were estimated freely. The correlation between the experimental and non-experimental LV RT was set to zero, while they were both allowed to correlate with g freely. All fixed links are grayed out.
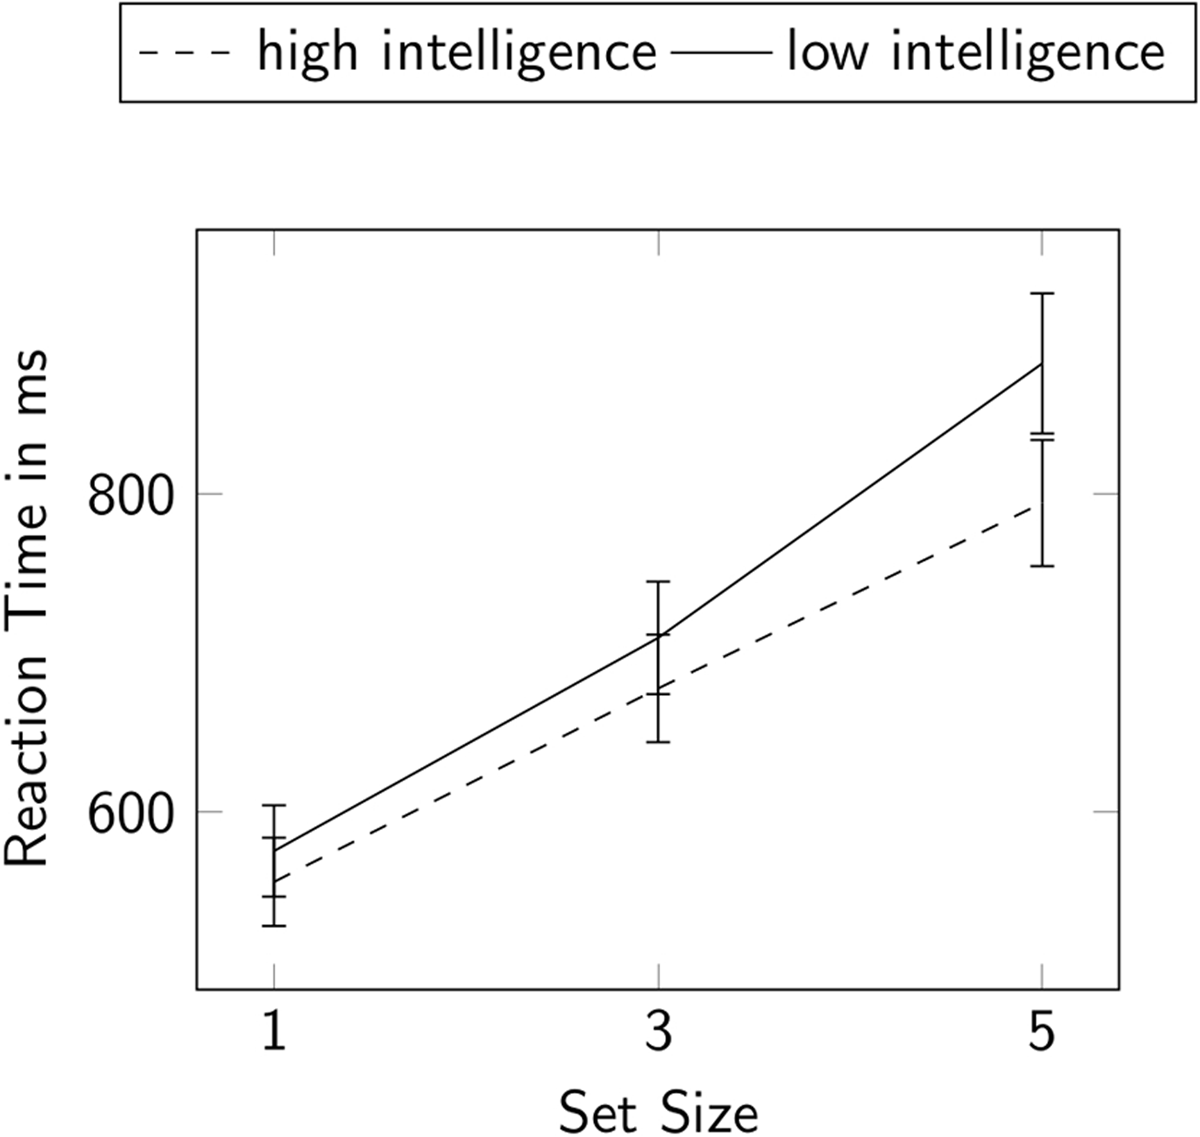
Figure 3
Repeated measures ANOVA for RTs. Participants were split into two groups by median split of general intelligence. Error bars display the 95% confidence interval.
Table 1
The slope parameter on a manifest level and its correlation with the intercept, averaged BIS-scores, and mean RT.
| SLOPE | INTERCEPT | AVERAGED BIS-SCORES | MEAN RT | |
|---|---|---|---|---|
| Slope | 1 (–) | – | – | – |
| Intercept | –.60*** (<.001) | 1 (–) | – | – |
| Averaged BIS-Scores | –.33*** (<.001) | 0.07 (.462) | 1 (–) | – |
| Mean RT | .57*** (<.001) | .32** (.001) | –31** (.001) | 1 (–) |
[i] Note: * p < .05, ** p < .01, *** p < .001, p-values are displayed in parentheses.
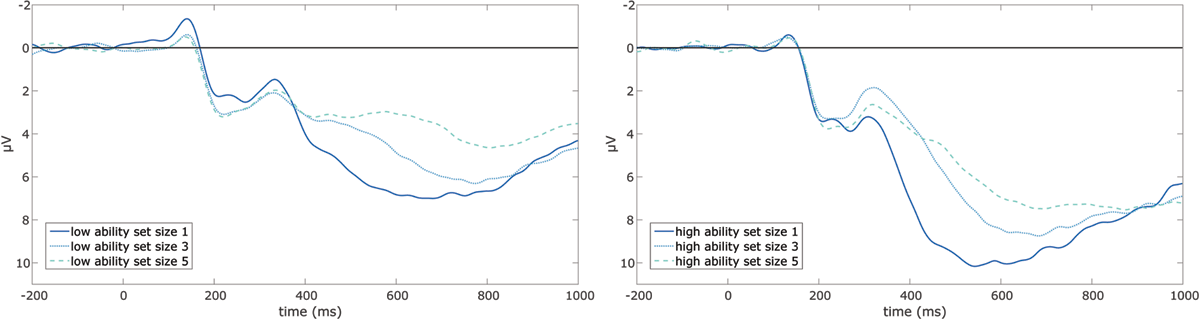
Figure 4
Grand averages of P3 latencies. As measured at the parietal electrode over midline, separately for the low intelligence and the high intelligence group.
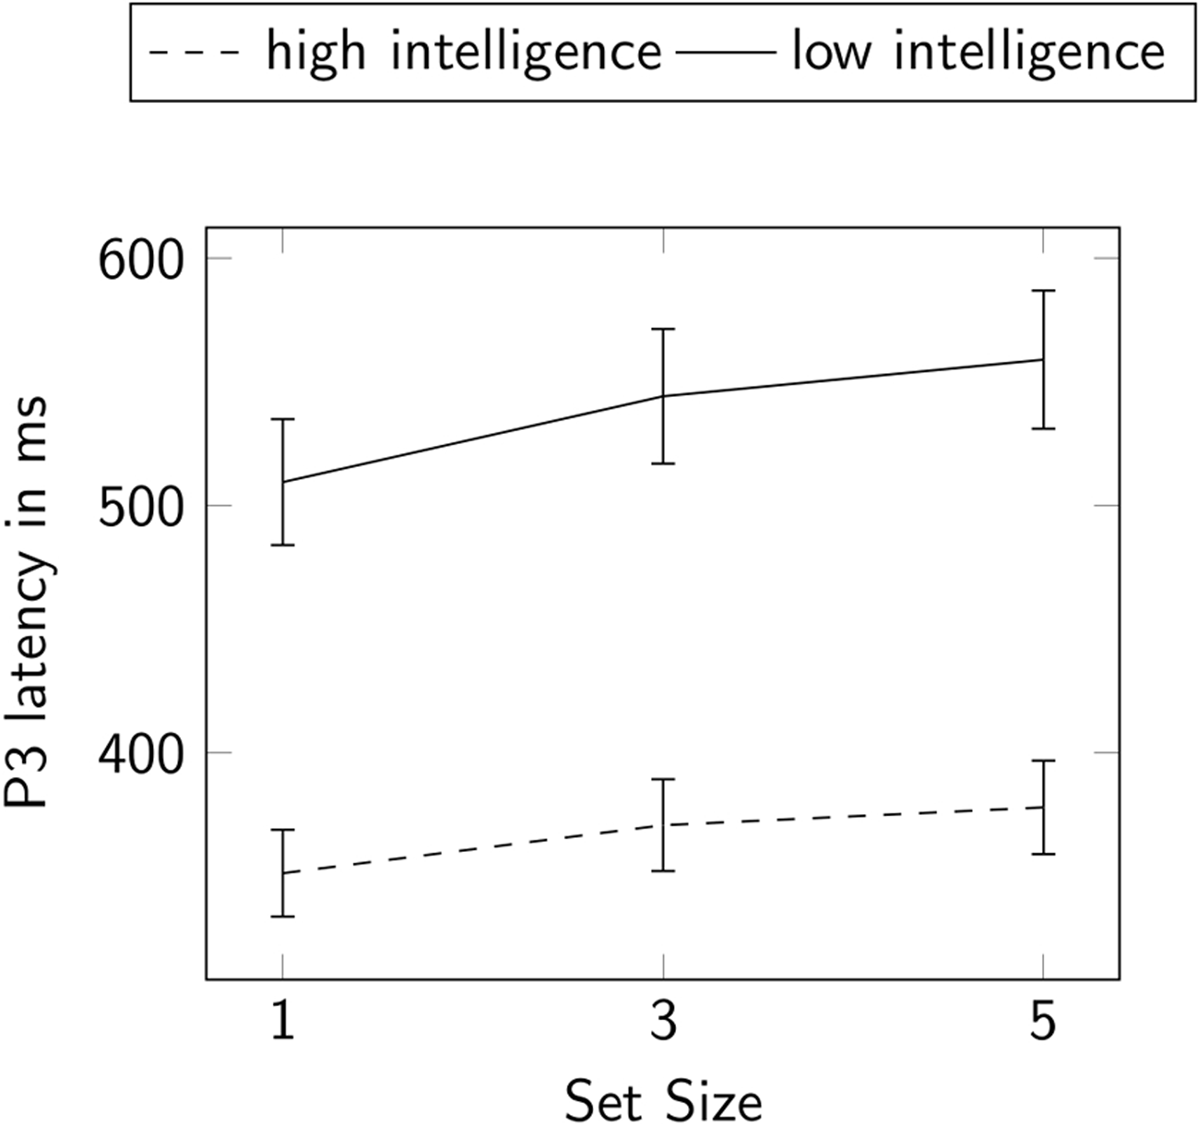
Figure 5
Repeated Measures ANOVA for P3 Latencies. Participants were split into two groups by median split of general intelligence. Error bars display a 95% confidence interval.