
Table 1
Distribution of the strategies (in percentage) per condition in Study 1 (AC: ascending consecutive; AnC: ascending non-consecutive; DC: descending consecutive; DnC: descending non-consecutive; NC: not-ordered consecutive; NnC: not-ordered non-consecutive).
| MEMORY (%) | DECOMPOSITION (%) | ARITHMETIC (%) | OTHER (%) | |
|---|---|---|---|---|
| AC | 60.71 | 24.11 | 15.18 | 0.00 |
| AnC | 44.14 | 15.32 | 33.33 | 7.21 |
| DC | 43.75 | 32.14 | 17.86 | 6.25 |
| DnC | 32.43 | 24.32 | 33.33 | 9.91 |
| NC | 22.77 | 55.36 | 18.30 | 3.57 |
| NnC | 21.43 | 54.91 | 22.32 | 1.34 |
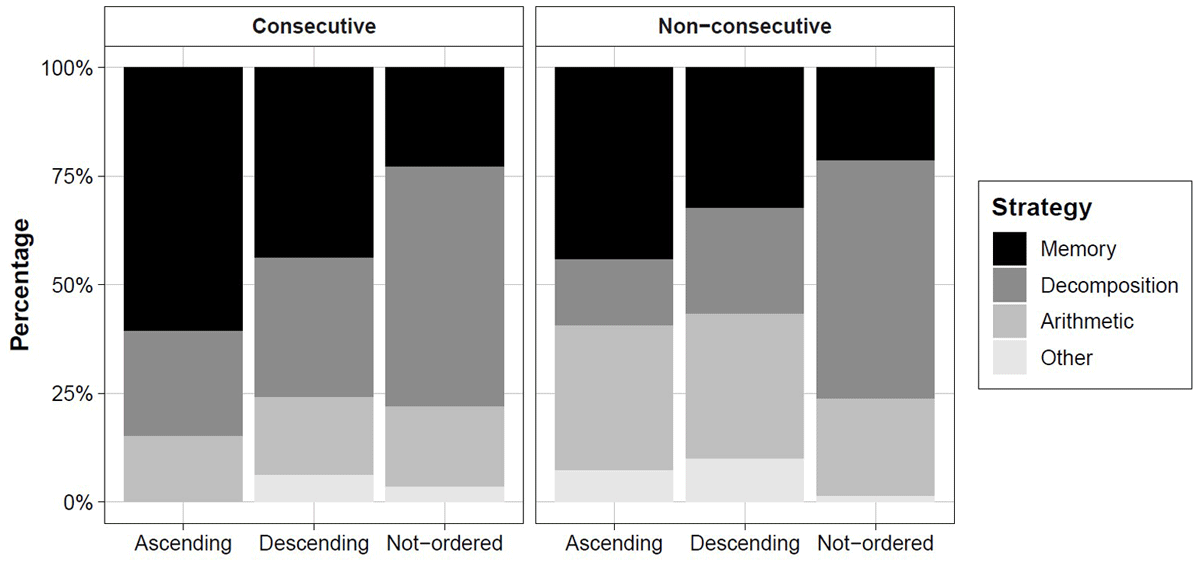
Figure 1
The percentage of strategy use (y-axis) as a function of the direction of the triplet (x-axis; ascending, descending, not-ordered) and the numerical distance between digits [Consecutive, left panel; Non-consecutive, right panel).
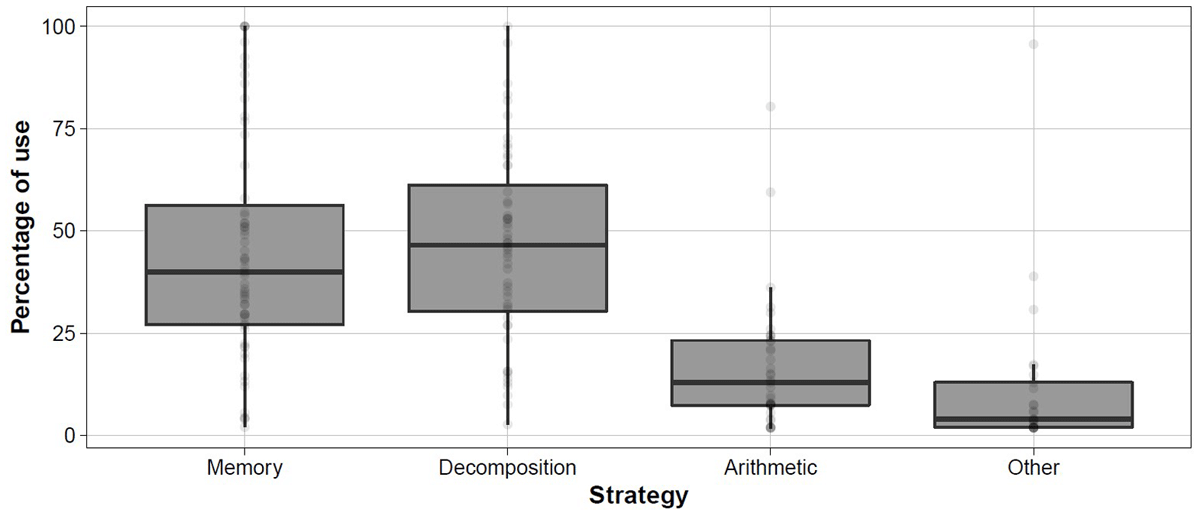
Figure 2
Boxplots represent the distribution of percentages of strategy use (y-axis); dots represent individual values.
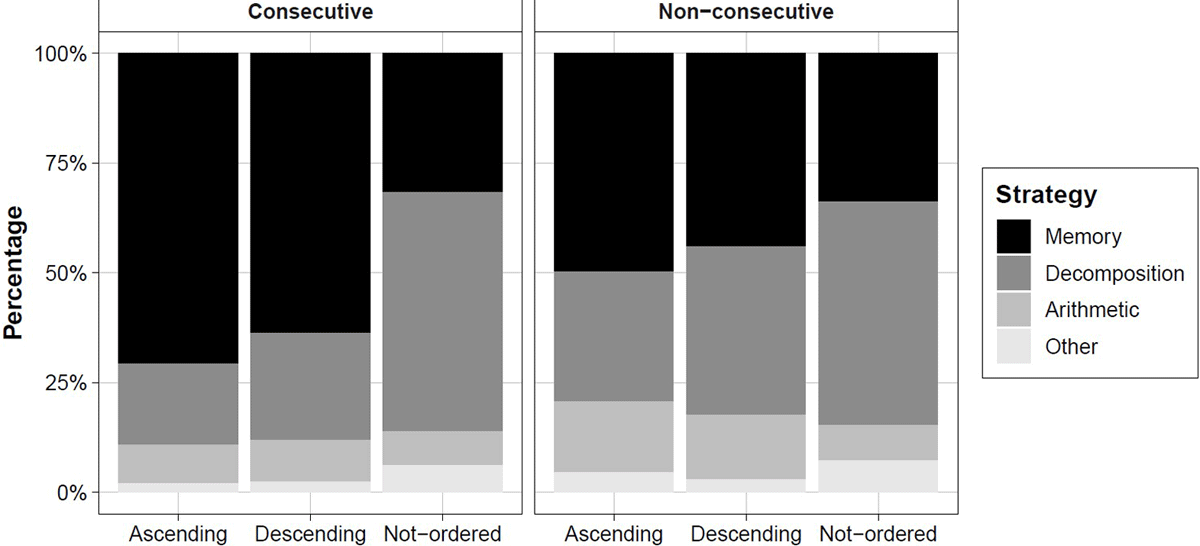
Figure 3
The percentage of strategy use (y-axis) as a function of the direction of the triplet (x-axis; ascending, descending, not-ordered) and the numerical distance between digits [Consecutive, left panel; Non-consecutive, right panel).
Table 2
Distribution of the strategies (in percentage) per condition in Study 2 (AC: ascending consecutive; AnC: ascending non-consecutive; DC: descending consecutive; DnC: descending non-consecutive; NC: not-ordered consecutive; NnC: not-ordered non-consecutive).
| MEMORY (%) | DECOMPOSITION (%) | ARITHMETIC (%) | OTHER (%) | |
|---|---|---|---|---|
| AC | 70.68 | 18.55 | 8.77 | 2.01 |
| AnC | 49.74 | 29.64 | 15.98 | 4.64 |
| DC | 63.73 | 42.35 | 9.59 | 2.38 |
| DnC | 44.09 | 38.22 | 14.70 | 2.89 |
| NC | 31.66 | 54.44 | 7.72 | 6.18 |
| NnC | 33.84 | 50.88 | 8.08 | 7.20 |
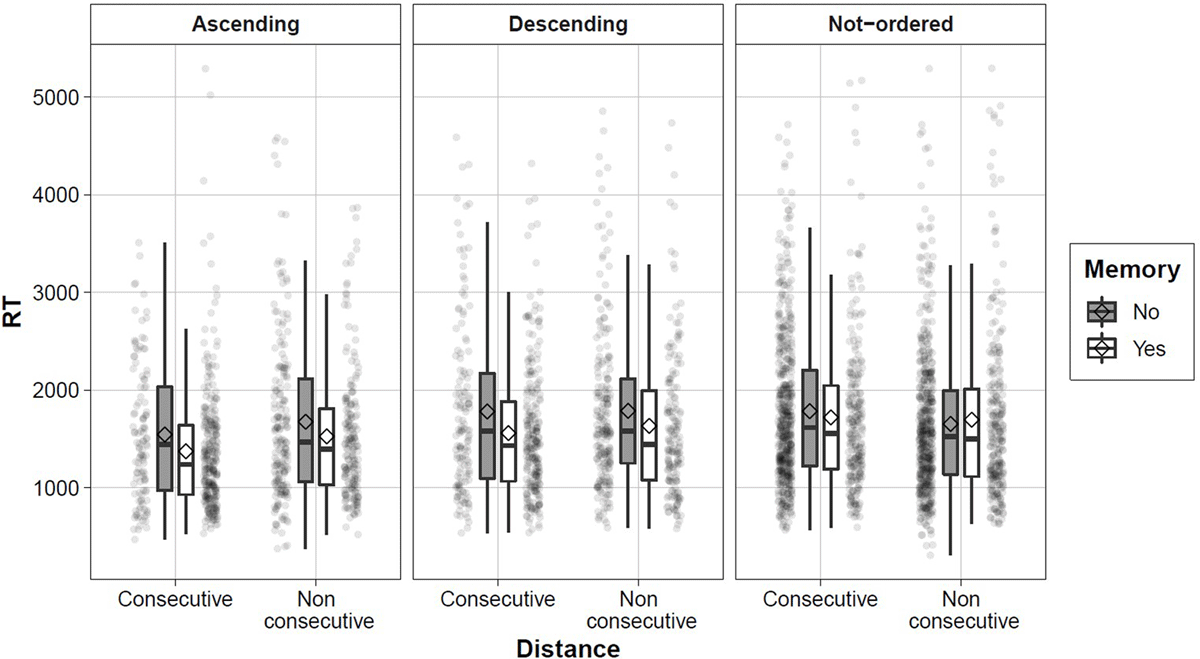
Figure 4
Boxplots of reaction times (y-axis) for trials in which the memory strategy was used (Yes; white) or not (No; dark grey) across direction (left: Ascending; middle: Descending; right: Not-ordered) and distance (x-axis). The diamonds represent the mean of the distribution whereas transparent dots represent single trials.
Table 3
Zero-order correlations between overall median RTs (All), median RTs across conditions (AC: ascending consecutive; AnC: ascending non-consecutive; DC: descending consecutive; DnC: descending non-consecutive; NC: not-ordered consecutive; NnC: not-ordered non-consecutive), and arithmetic fluency score (TTR). ** p < .01.
| MEASURE | 1 | 2 | 3 | 4 | 5 | 6 | 7 |
|---|---|---|---|---|---|---|---|
| 1. All | |||||||
| 2. AC | .79** | ||||||
| 3. AnC | .88** | .76** | |||||
| 4. DC | .86** | .75** | .72** | ||||
| 5. DnC | .85** | .71** | .85** | .76** | |||
| 6. NC | .88** | .59** | .70** | .69** | .63** | ||
| 7. NnC | .85** | .54** | .72** | .59** | .65** | .78** | |
| 8. TTR | –.35** | –.37** | –.36** | –.44** | –.44** | –.12 | –.19 |
Table 4
Zero-order correlations between proportion of memory strategy use, median RTs for memory, median RTs for decomposition, and arithmetic fluency (TTR). * p < .05, ** p < .01.
| MEASURE | 1 | 2 | 3 |
|---|---|---|---|
| 1. Proportion memory strategy | |||
| 2. Median RTs for memory strategy | –.04 | ||
| 3. Median RTs for decomposition strategy | .12 | .67** | |
| 4. TTR | .13 | –.31* | –.12 |