
Table 1
Values assigned to the structural model parameters for response time and proportion errors in Study 1. Note that the distribution parameters are proportional across the two dependent variables.
| PARAMETER | RT | PE |
|---|---|---|
| μ | 1000 | 0.20 |
| σ | 160 | 0.40 |
| σp | 8 | 0.02 |
| αi | ± 5 | ± 0.0125 |
| βj | [–20, 0, 20] | [0.050, 0, –0.050] |
| πk | N(0, σp2) | N(0, 0.1414) |
| Єijk | exN(0, σ2, 50) | coded 1/0 (binomial) |
[i] Note: The symbols σ and σp refer to respectively the population standard deviation and standard deviation of the subject-associated effect (which is σ * 0.05). No value is provided for Ɛ in the column PE because accuracy is coded 1/0 and the value is determined by a uniformly distributed random value based on the cell mean; aggregation of the accuracy scores per condition results in a variable with a binomial distribution. N(x, y) denotes a gaussian distribution with mean x and variance y; exN(x, y, z) denotes an ex-gaussian distribution with a gaussian part N(x, y) and an exponential distribution with mean z.
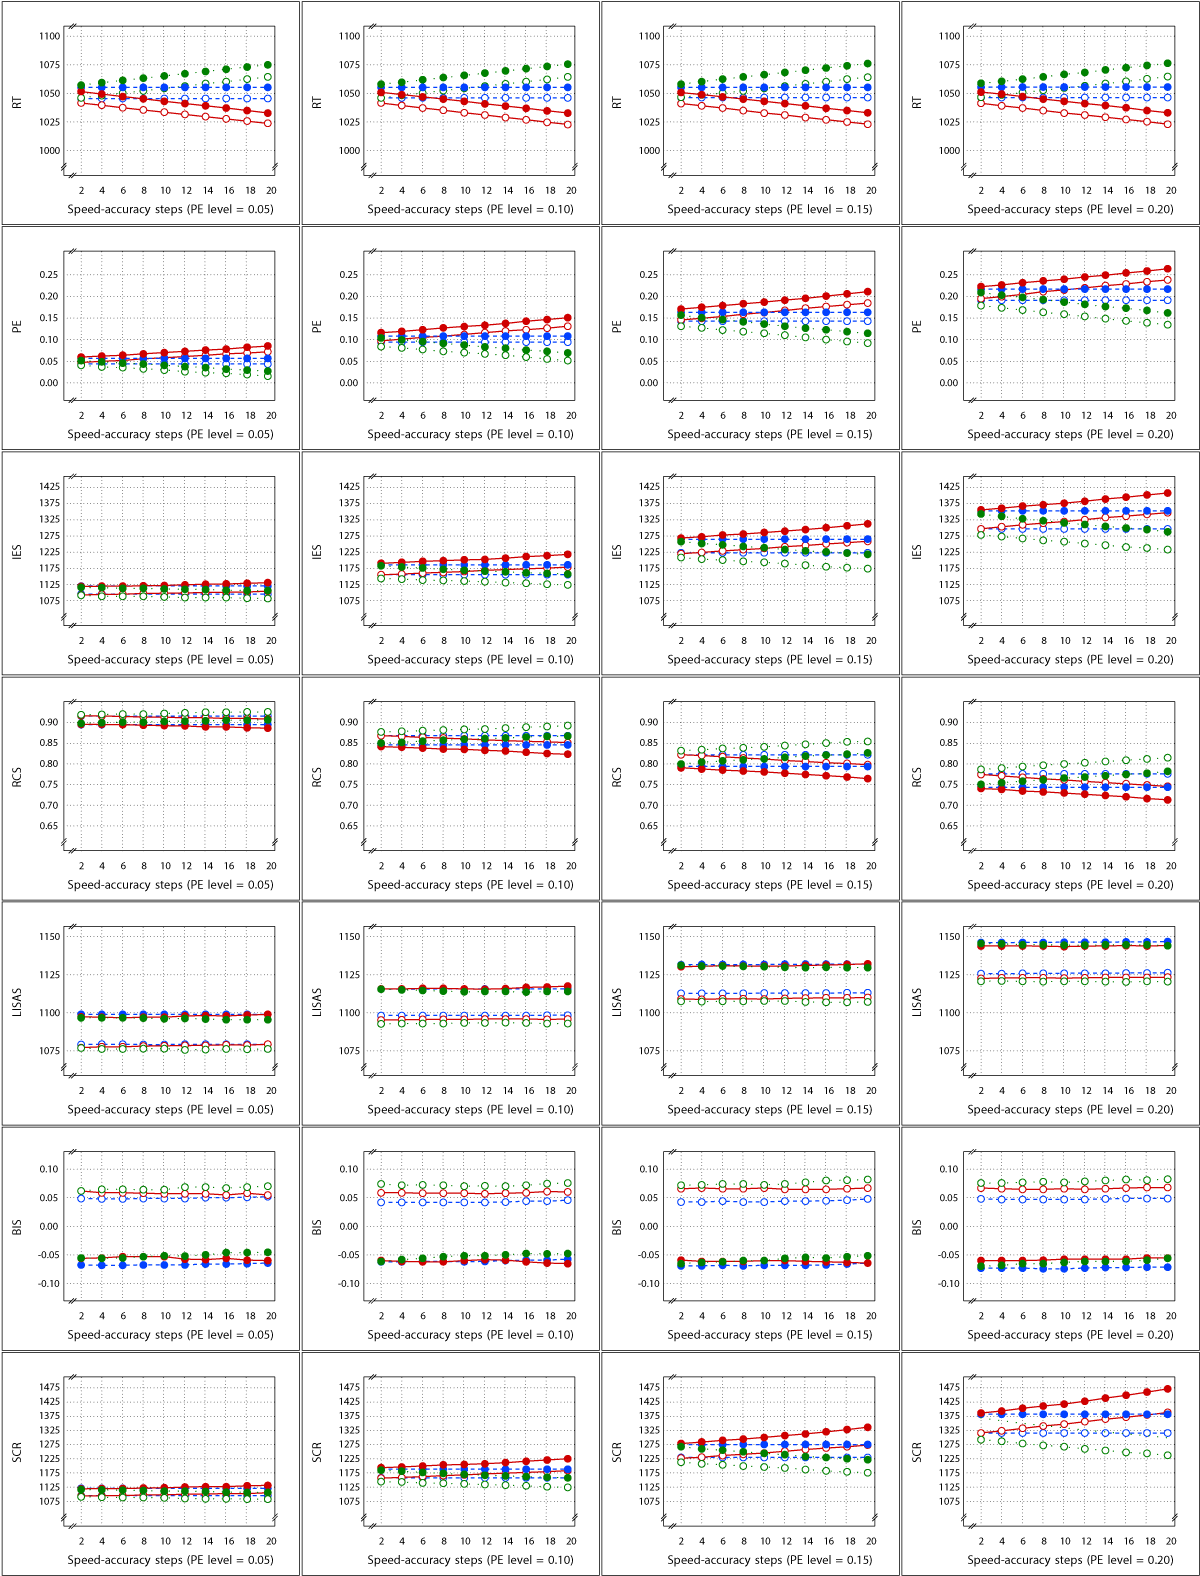
Figure 1
Sample Means in Study 1 as a function of Test × SAT Settings × SAT size (x-axis in each panel) × PE level (panels from left to right). Each row of panels shows the result for a single dependent variable. The curves within each panel show the cell means of the Test × SAT Settings combinations. Legend: Open circles for control condition and closed circles for experimental condition; red solid lines for speed stress, blue dashes for neutral SAT, and green dotted lines for accuracy stress.
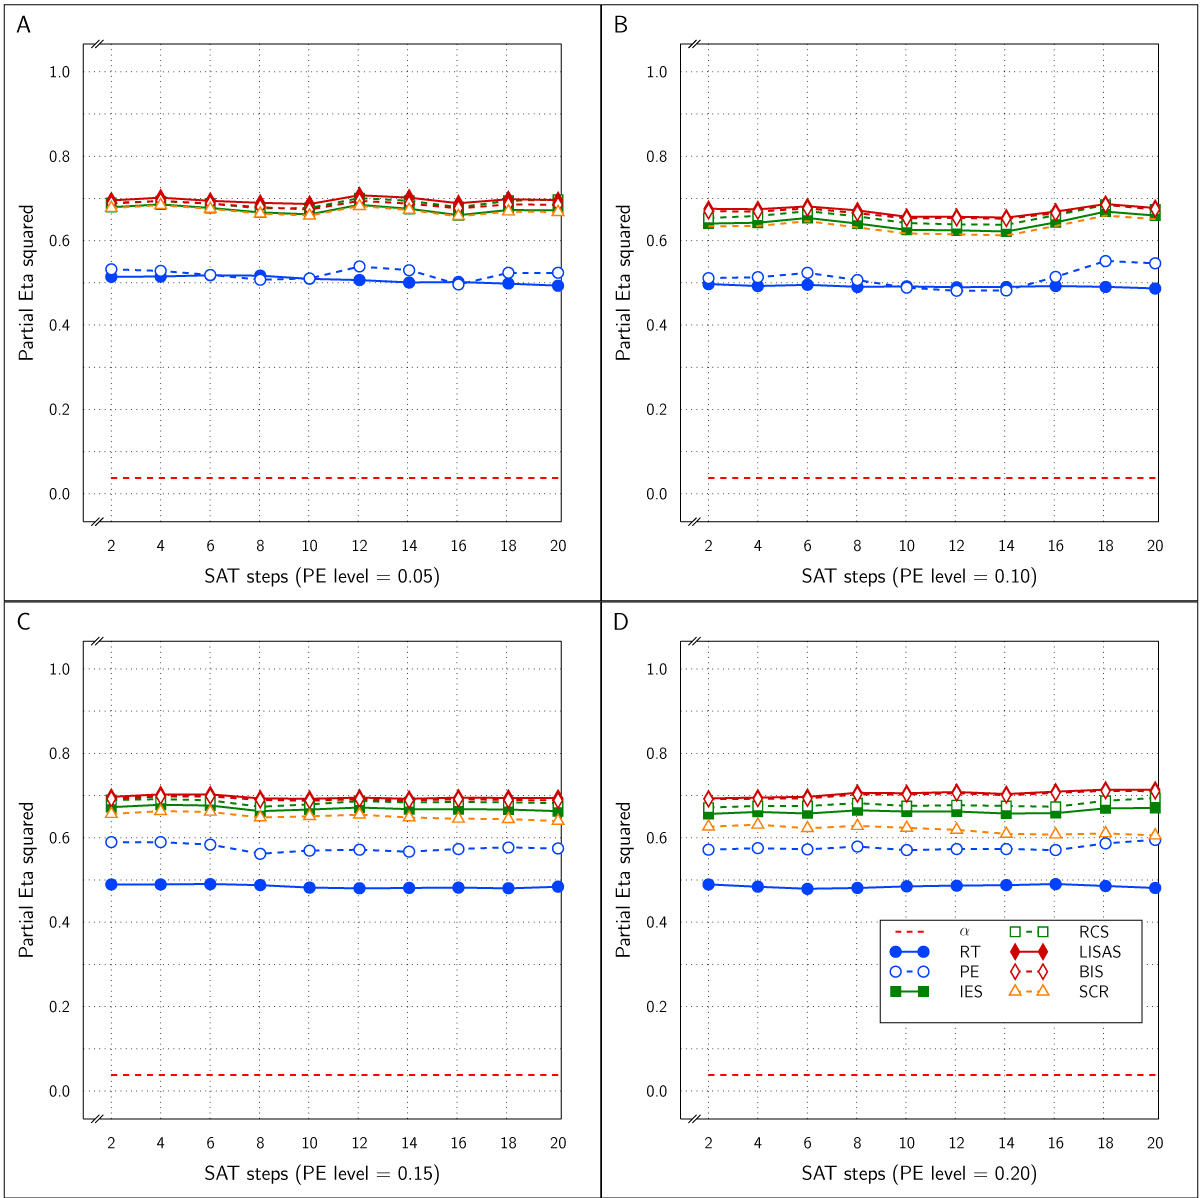
Figure 2
Estimated effect size () of the Test effect as a function of the variation in PE (panels A to D) and in SAT size for RT and PE and for the five combined measures in Study 1.
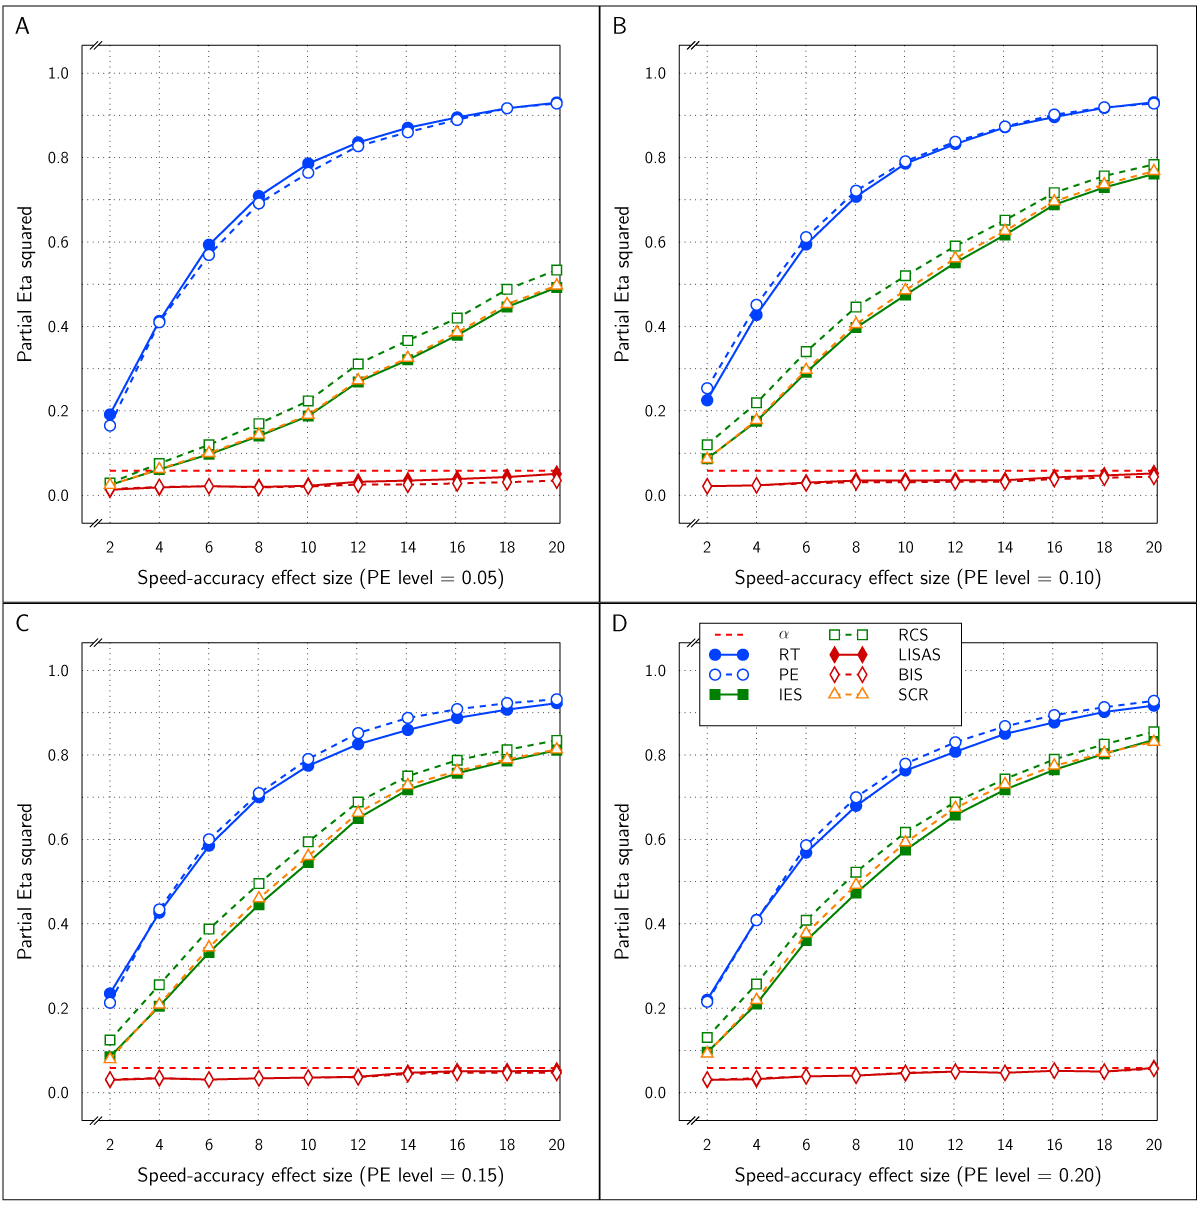
Figure 3
Estimated effect size () of SAT Settings as a function of PE level and SAT strength for RT and PE and the five combined measures in Study 1. The dashed line (labeled α) represents the significance threshold for these data.
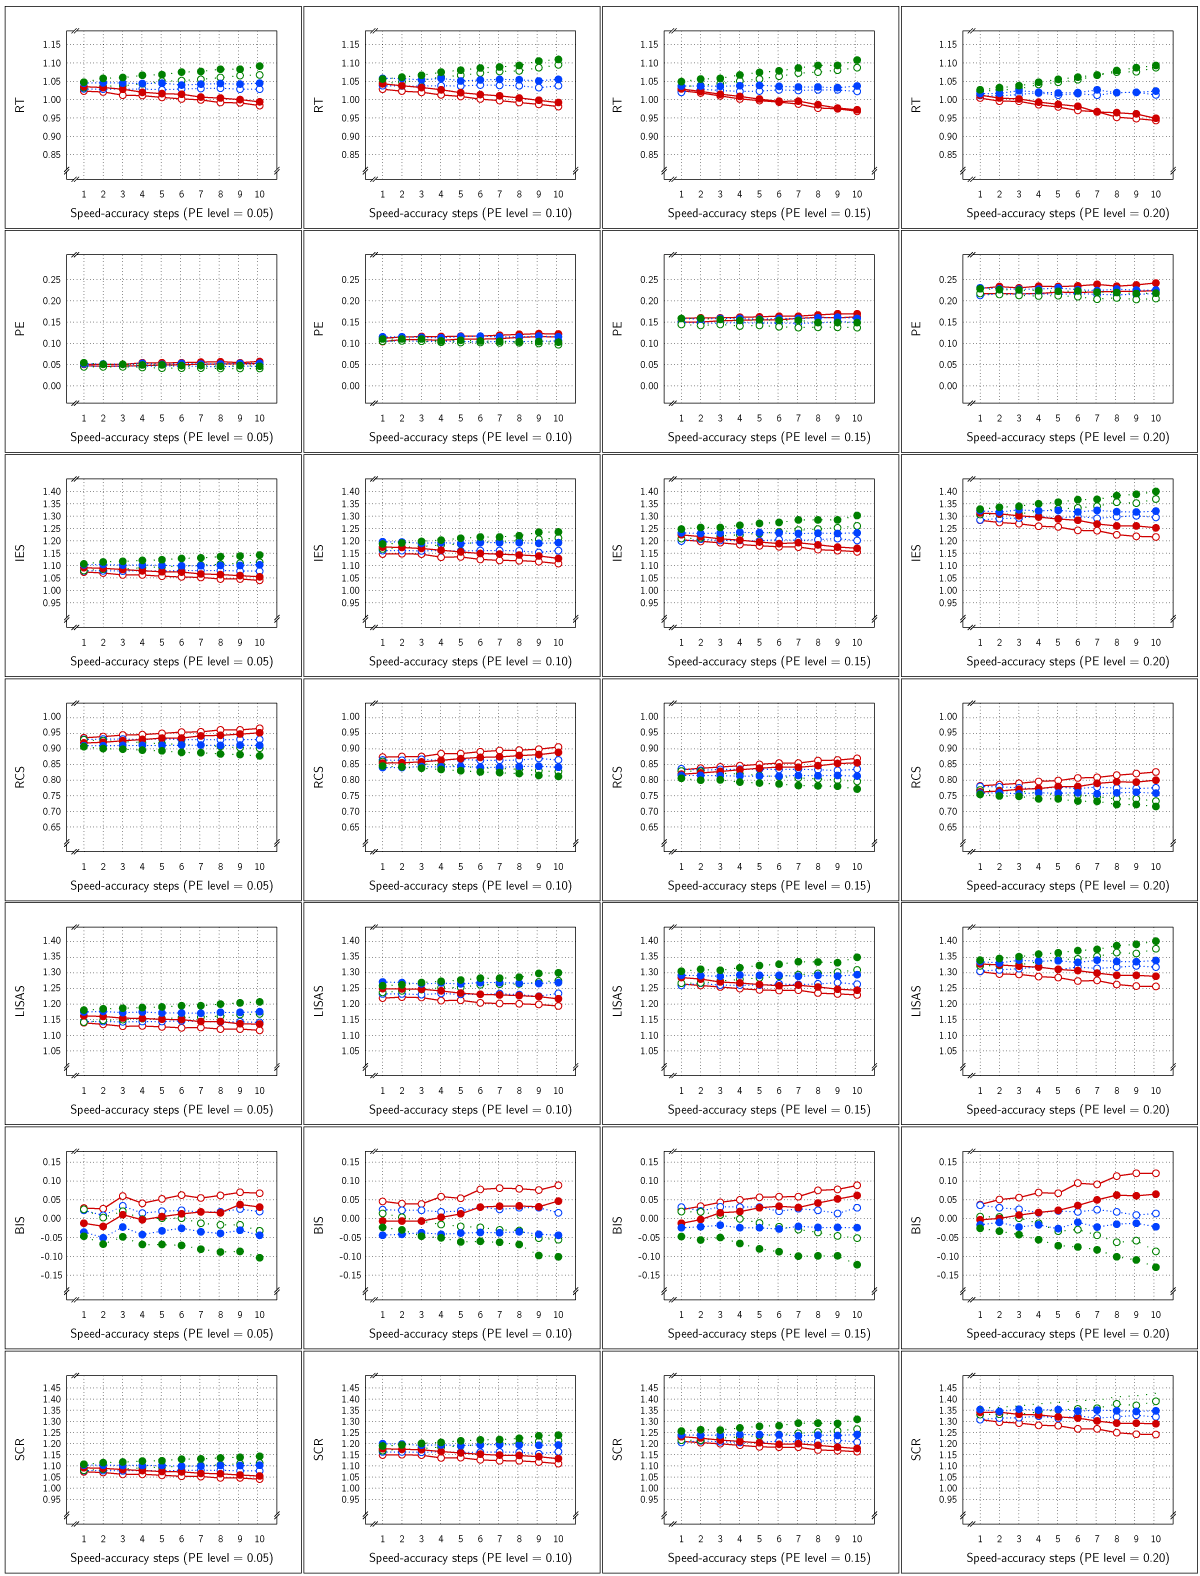
Figure 4
Sample Means in Study 2 as a function of Test × SAT Settings × SAT size (x-axis in each panel) × PE level (panels from left to right). Each row of panels shows the result for a single dependent variable. The curves within each panel show the cell means of the Test × SAT Settings combinations. Legend: Open circles for control condition and closed circles for experimental condition; red solid lines for speed stress, blue dashes for neutral SAT, and green dotted lines for accuracy stress.

Figure 5
Estimated effect size () of the Test effect as a function of the variation in PE (panels A to D) and in SAT size for RT and PE and for the five combined measures in Study 2.

Figure 6
Estimated effect size () of SAT Settings as a function of PE level and SAT strength for RT and PE and the five combined measures in Study 2. The dashed line (labeled α) represents the significance threshold for these data.
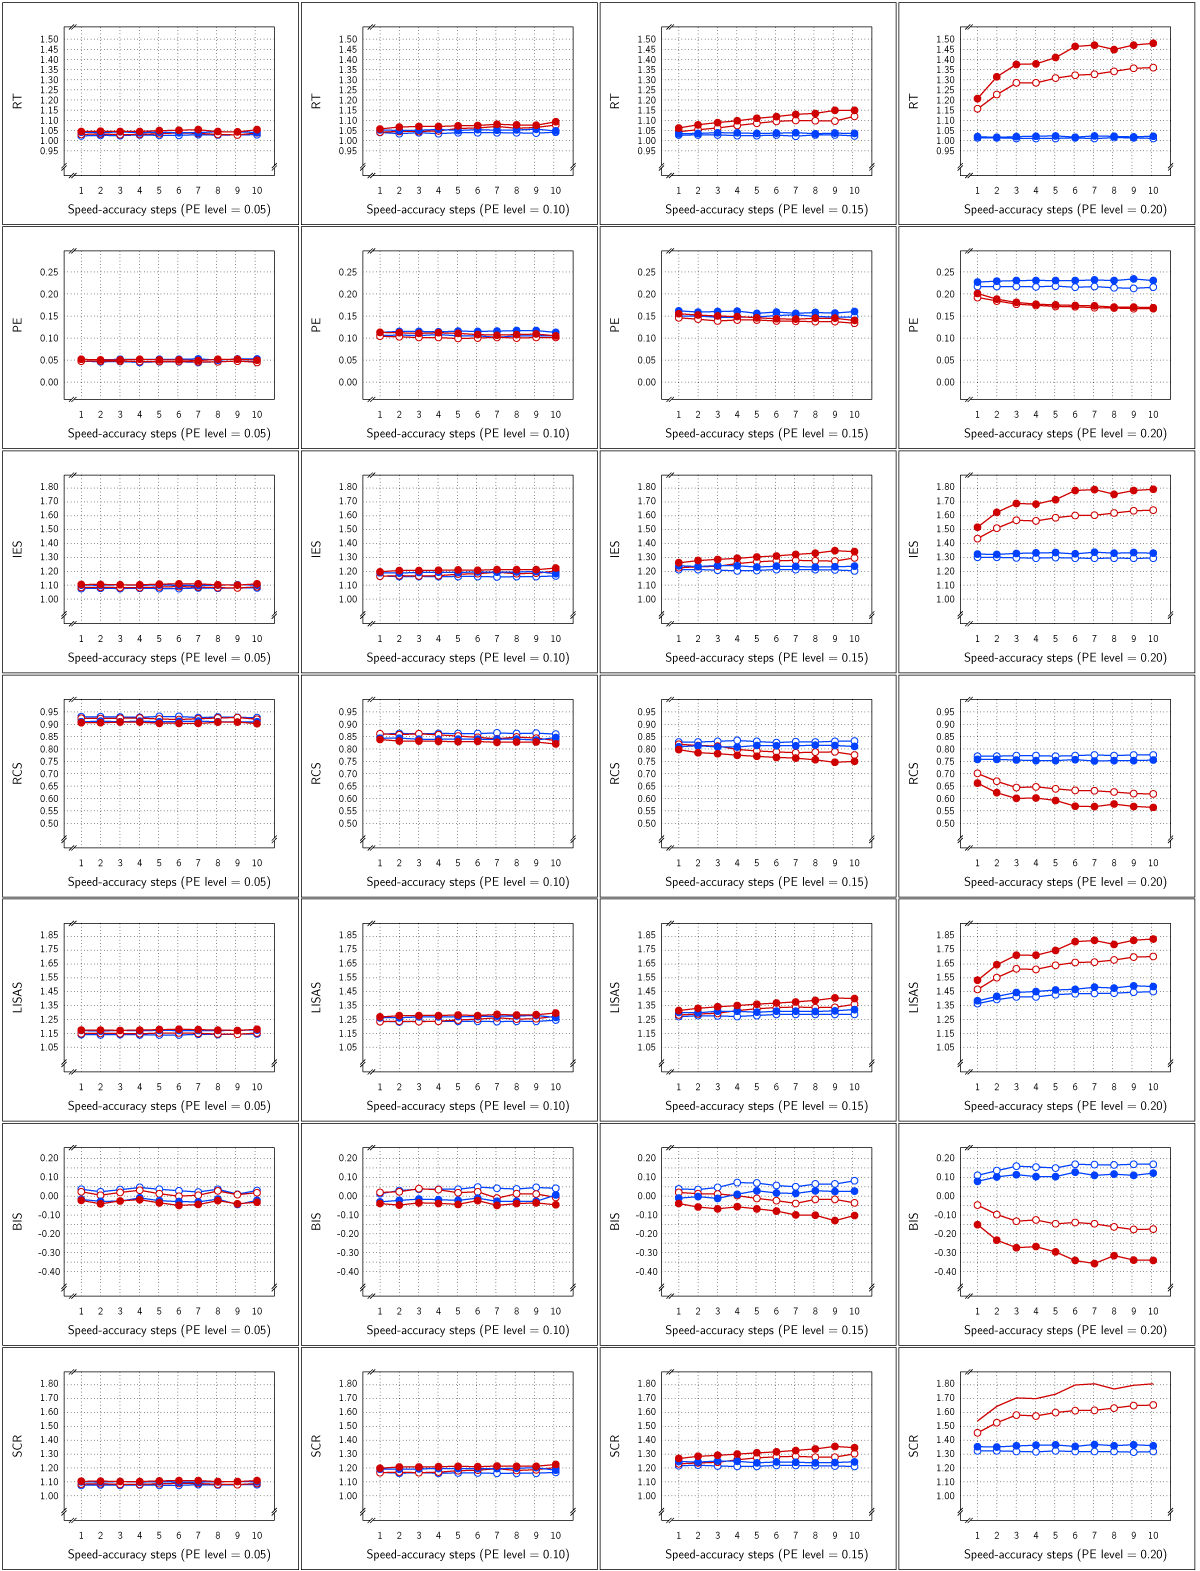
Figure 7
Sample Means in Study 3 as a function of Test × SAT Presence × SAT size (x-axis in each panel) × PE level (panels from left to right). The cell means of the Test × SAT part of the design are shown in the curves within each panel. Each row of panels shows the result for a single dependent variable. Legend: blue for SAT-absent conditions, red for SAT-present conditions; open circles for control condition, closed circles for experimental condition.
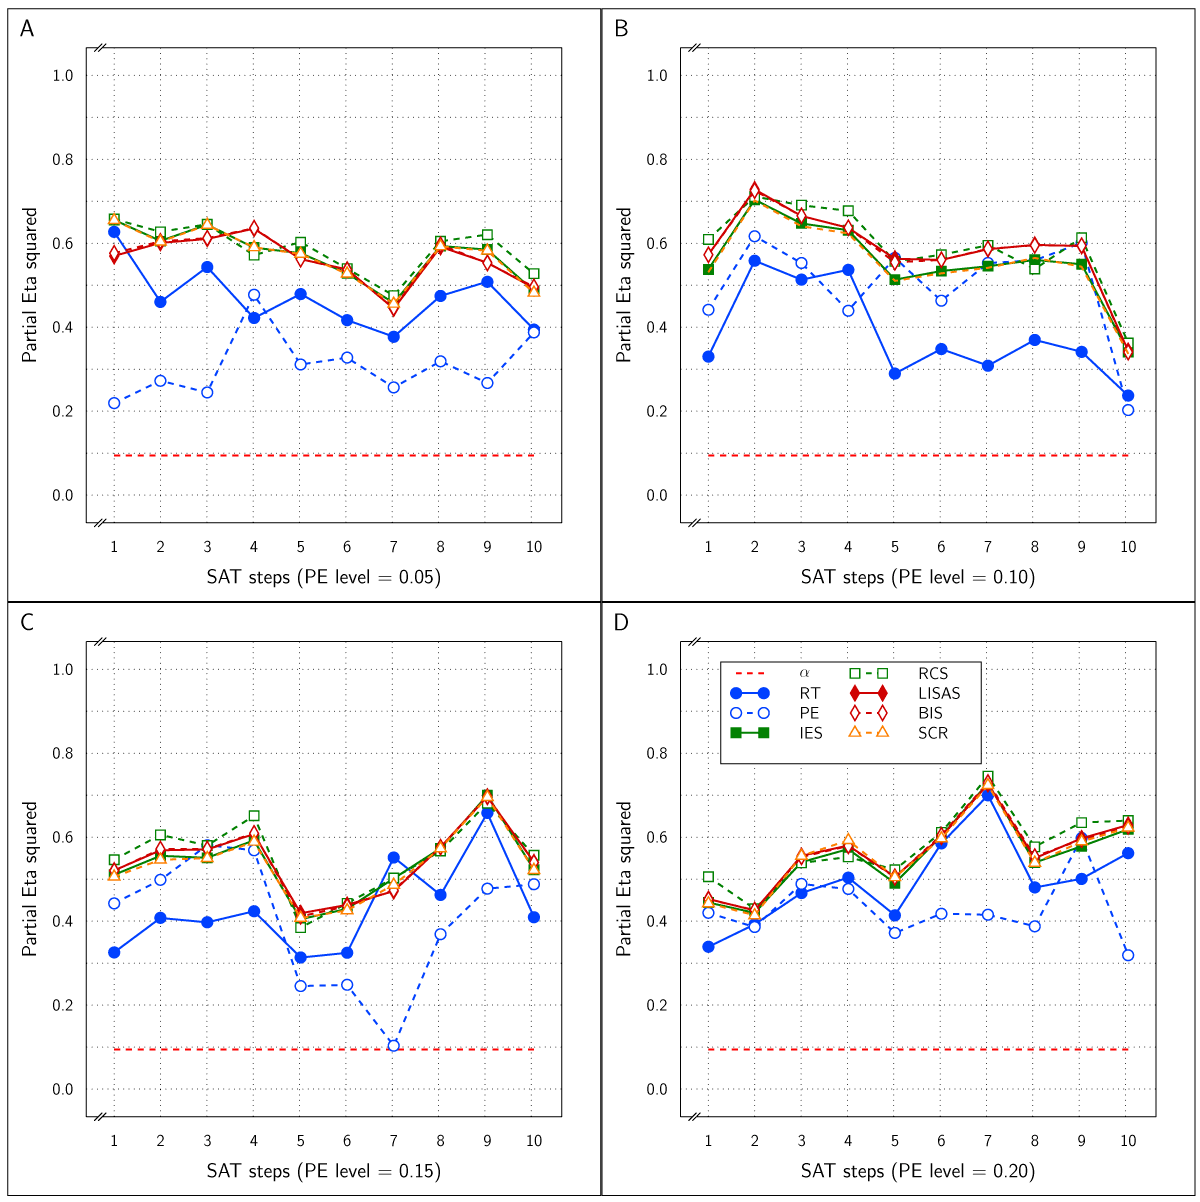
Figure 8
Estimated effect size () of the Test effect as a function of the variation in PE (panels A to D) and in SAT size for RT and PE and for the five combined measures in Study 3.

Figure 9
Estimated effect size () of SAT Settings as a function of PE level and SAT strength for RT and PE and the five combined measures in Study 3. The dashed line (labeled α) represents the significance threshold for these data.

Figure 10
Sample Means in Study 4 as a function of Test × SAT Targets × SAT size (x-axis in each panel) × PE level. Each row of panels shows the means of a single dependent variable with respect to PE level × Test, such that the two panels on the left show the control and the experimental condition means at PE level 0.05, and the two panels on the right show the control and experimental condition means at PE level 0.10. Legend: Open circles for control condition and closed circles for experimental condition; red solid lines for 75%, orange dashed lines for 80%, yellow dotted lines for 85%, green dashed lines for 90%, and dark green solid lines for 95% target.
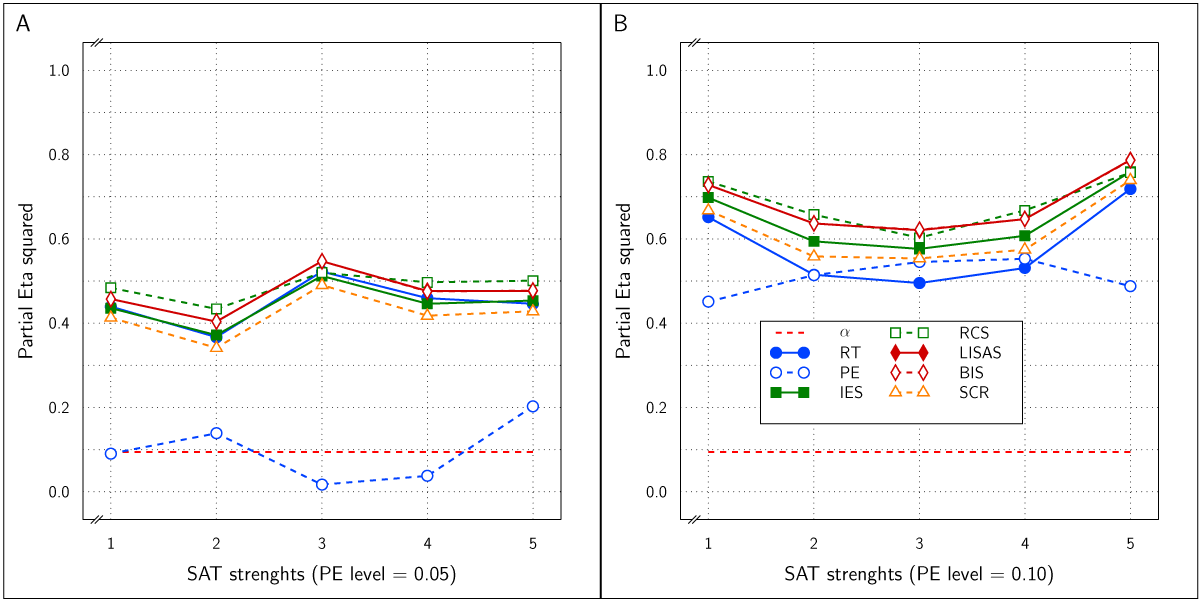
Figure 11
Estimated effect size () of the Test effect as a function of the variation in PE (panels A and B) and in SAT size for RT and PE and for the five combined measures in Study 4.
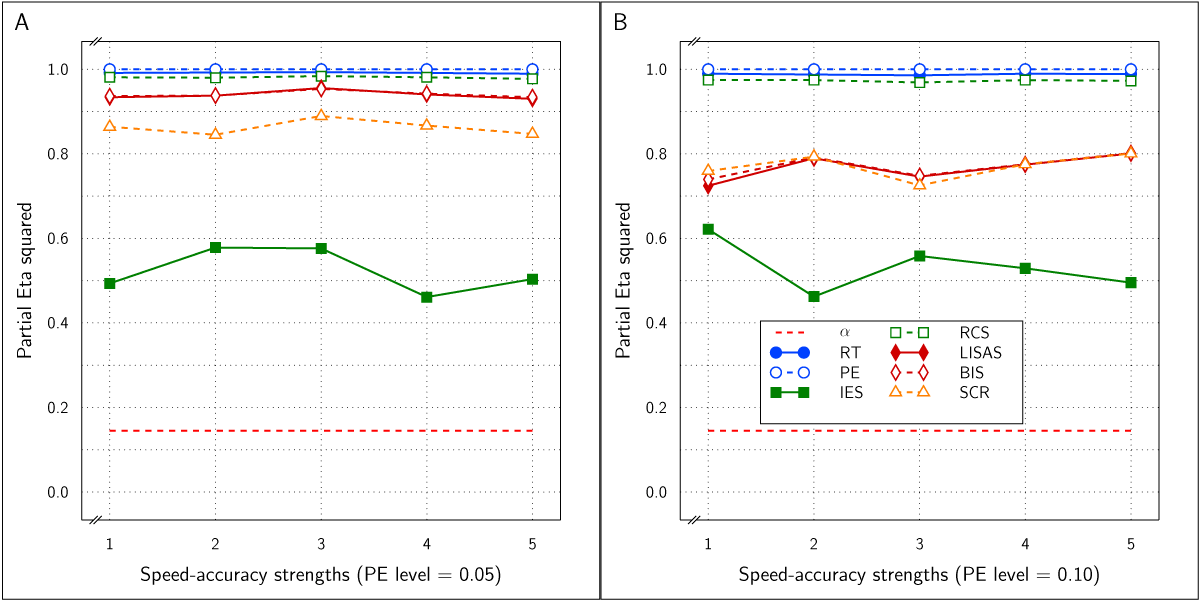
Figure 12
Estimated effect size () of SAT Settings as a function of PE level and SAT strength for RT and PE and the five combined measures in Study 4. The dashed line (labeled α) represents the significance threshold for these data.