
Table 1
Means and ΔMeans of Error Rates and Response Times in Experiment 1 (Standard Deviations in Parentheses).
| POSITION | REGULAR | REVERSED | ||||
|---|---|---|---|---|---|---|
| AFFIX STATUS | SUFFIXED | NONSUFFIXED | Δ(NON-SUFF) | SUFFIXED | NONSUFFIXED | Δ(NON-SUFF) |
| Error Rates (in %) | ||||||
| Grade 3 | 16.28 (1.50) | 16.94 (1.52) | 0.66 | 15.95 (1.49) | 16.78 (1.52) | 0.83 |
| Grade 5 | 13.96 (1.52) | 9.94 (1.31) | –4.02* | 12.79 (1.46) | 14.26 (1.53) | 1.47 |
| Adults | 6.41 (0.99) | 10.86 (1.26) | 4.45* | 10.69 (1.25) | 9.87 (1.21) | –0.82 |
| Response Times (in ms) | ||||||
| Grade 3 | 1136 (363) | 1109 (323) | –27 | 1102 (345) | 1088 (340) | –14 |
| Grade 5 | 1049 (332) | 1029 (302) | –20 | 1037 (300) | 1021 (324) | –16 |
| Adults | 636 (161) | 650 (165) | 14 | 657 (166) | 636 (160) | –21* |
[i] * Significant difference (p < .05) according to the reported linear mixed-effects model.

Figure 1
Error rates (in %) from Experiment 1 in the different conditions (Affix Status × Position) by age group. The upper row shows the distribution of the data, with boxplots indicating medians and interquartile ranges; the points represent by-subject means. In the bottom row, the points refer to the means by condition, while the error bars show the standard errors of the mean calculated at the trial-level.
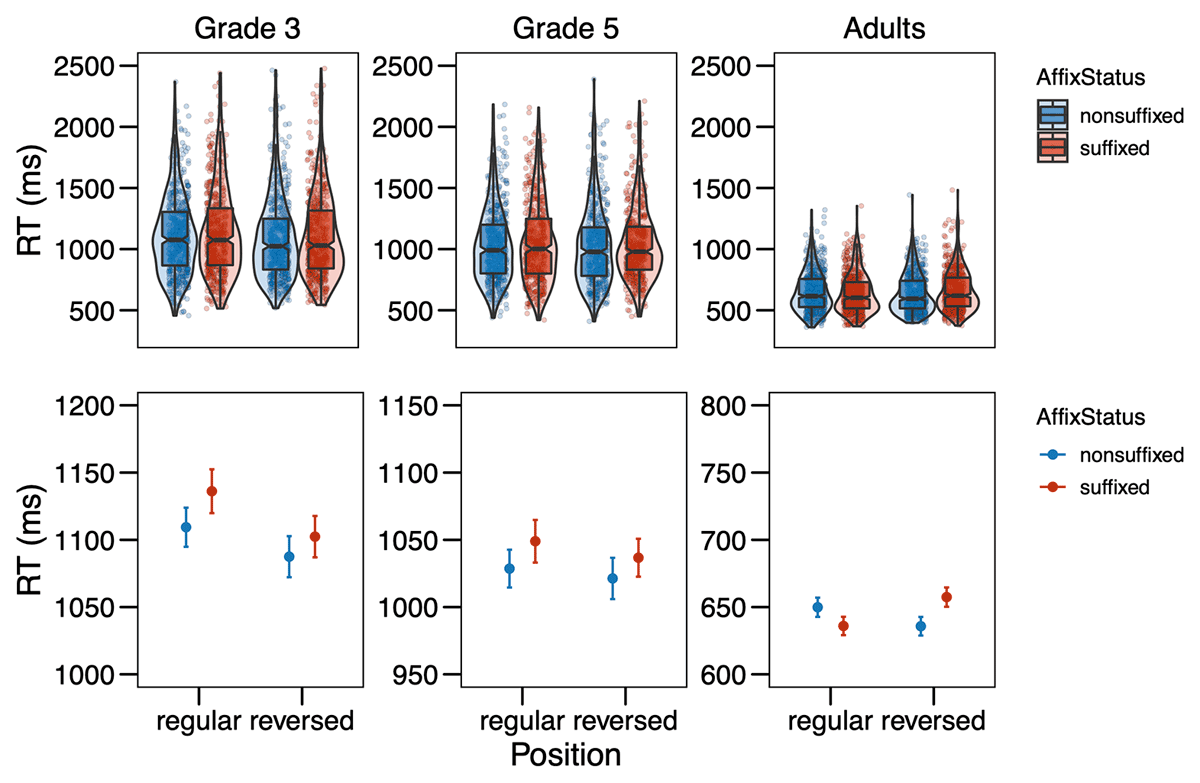
Figure 2
Response times (in ms) from Experiment 1 in the different conditions (Affix Status × Position) by age group. The upper row shows the distribution of the data, with boxplots indicating medians and interquartile ranges; the points represent single data points. In the bottom row, the points refer to the means by condition, while the error bars show the standard errors of the mean calculated at the trial-level. Note that the scales are equal across grades in the upper row, but range in the bottom row.
Table 2
Means and ΔMeans of Error Rates and Response Times in Experiment 2 (Standard Deviations in Parentheses).
| POSITION | REGULAR | REVERSED | ||||
|---|---|---|---|---|---|---|
| AFFIX STATUS | SUFFIXED | NONSUFFIXED | Δ(NON-SUFF) | SUFFIXED | NONSUFFIXED | Δ(NON-SUFF) |
| Error Rates (in %) | ||||||
| Grade 3 | 22.84 (2.06) | 23.08 (2.07) | 0.24 | 19.23 (1.93) | 16.11 (1.80) | –3.12 |
| Grade 5 | 17.54 (1.71) | 15.12 (1.61) | –2.42 | 17.54 (1.71) | 17.14 (1.69) | –0.40 |
| Adults | 7.97 (1.07) | 8.91 (1.13) | 0.94 | 12.34 (1.30) | 15.00 (1.41) | 2.66 |
| Response Times (in ms) | ||||||
| Grade 3 | 1242 (358) | 1269 (352) | 27 | 1214 (335) | 1209 (362) | –5 |
| Grade 5 | 1031 (340) | 1038 (321) | 7 | 1013 (322) | 1026 (320) | 13 |
| Adults | 716 (198) | 704 (203) | –12 | 727 (202) | 731 (213) | 4 |
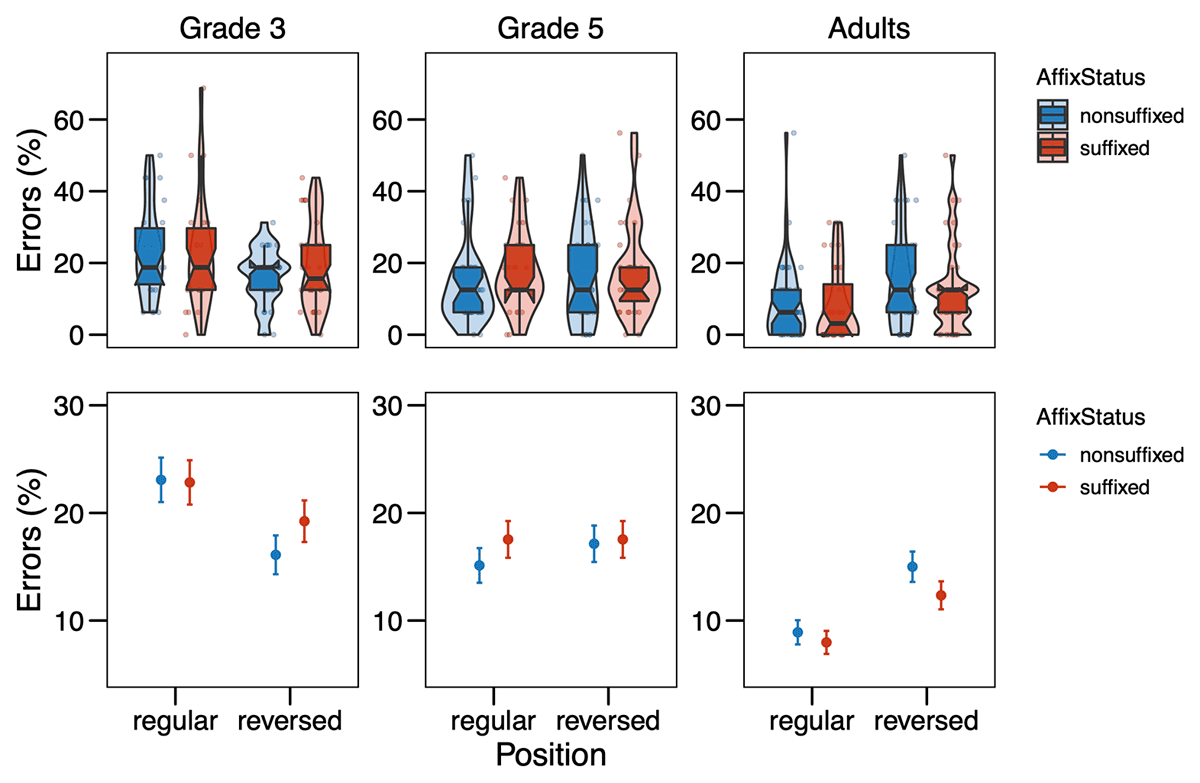
Figure 3
Error rates (in %) from Experiment 2 in the different conditions (Affix Status × Position) by age group. The upper row shows the distribution of the data, with boxplots indicating medians and interquartile ranges; the points represent by-subject means. In the bottom row, the points refer to the means by condition, while the error bars show the standard errors of the mean calculated at the trial-level.

Figure 4
Response times (in ms) from Experiment 2 in the different conditions (Affix Status × Position) by age group. The upper row shows the distribution of the data, with boxplots indicating medians and interquartile ranges; the points represent single data points. In the bottom row, the points refer to the means by condition, while the error bars show the standard errors of the mean calculated at the trial-level. Note that the scales are equal across grades in the upper row, but range in the bottom row.
Table 3
Means and ΔMeans of Error Rates and Response Times in Experiment 1 and 2 combined (Standard Deviations in Parentheses).
| POSITION | REGULAR | REVERSED | ||||
|---|---|---|---|---|---|---|
| AFFIX STATUS | SUFFIXED | NONSUFFIXED | Δ(NON-SUFF) | SUFFIXED | NONSUFFIXED | Δ(NON-SUFF) |
| Error Rates (in %) | ||||||
| Grade 3 | 18.95 (1.22) | 19.43 (1.24) | 0.48 | 17.29 (1.18) | 16.50 (1.16) | –0.79 |
| Grade 5 | 15.70 (1.14) | 12.46 (1.04) | –3.24 | 15.10 (1.12) | 15.66 (1.14) | 0.56 |
| Adults | 7.21 (0.73) | 9.86 (0.84) | 2.65* | 11.54 (0.90) | 12.50 (0.94) | 0.96* |
| Response Times (in ms) | ||||||
| Grade 3 | 1182 (370) | 1171 (345) | –11 | 1147 (345) | 1139 (356) | –8 |
| Grade 5 | 1042 (336) | 1034 (313) | –8 | 1026 (311) | 1022 (321) | –4 |
| Adults | 678 (187) | 679 (188) | 1 | 691 (186) | 680 (189) | –11 |
[i] * Significant difference (p < .05) according to the reported linear mixed-effects model.
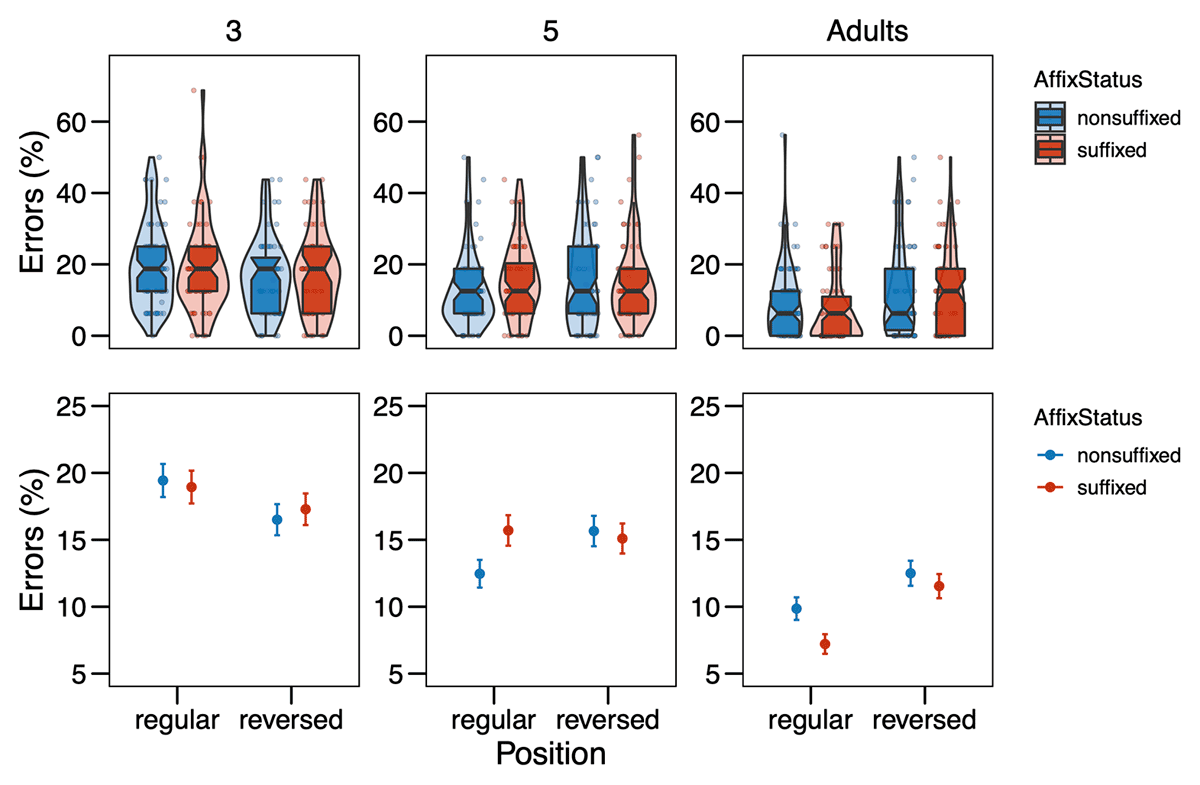
Figure 5
Error rates (in %) from Experiment 1 and 2 combined in the different conditions (Affix Status × Position) by age group. The upper row shows the distribution of the data, with boxplots indicating medians and interquartile ranges; the points represent by-subject means. In the bottom row, the points refer to the means by condition, while the error bars show the standard errors of the mean calculated at the trial-level.

Figure 6
Response times (in ms) from Experiment 1 and 2 combined in the different conditions (Affix Status × Position) by age group. The upper row shows the distribution of the data, with boxplots indicating medians and interquartile ranges; the points represent single data points. In the bottom row, the points refer to the means by condition, while the error bars show the standard errors of the mean calculated at the trial-level. Note that the scales are equal across grades in the upper row, but range in the bottom row.