
Figure 1
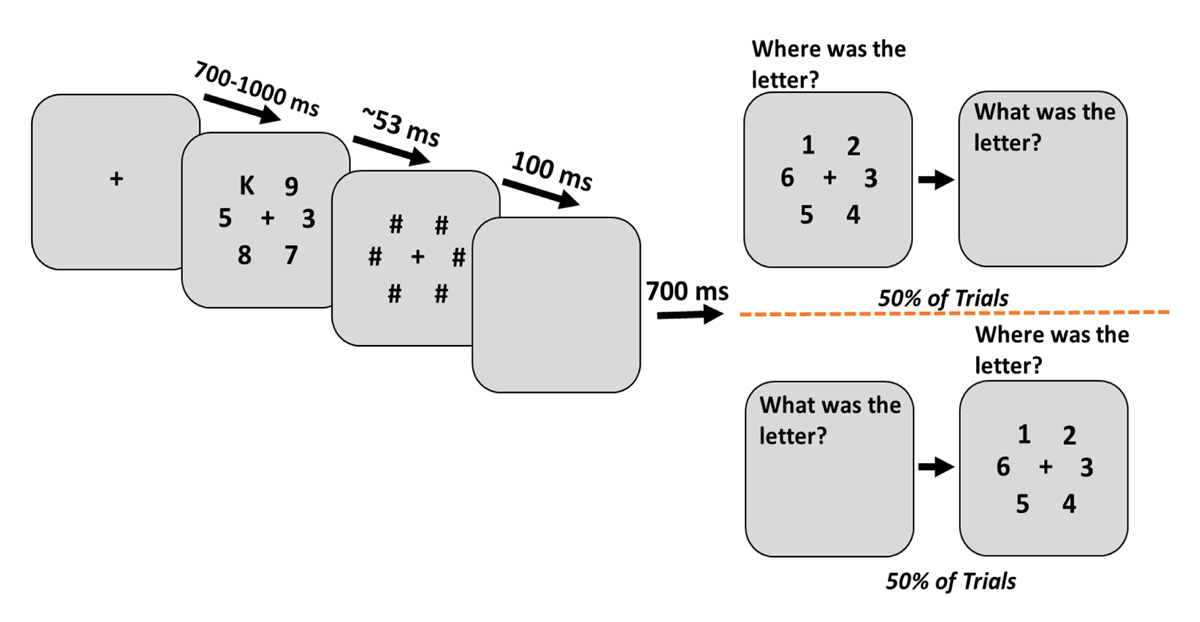
A trial example for experiment 1a. A black fixation cross was presented for 700–1000 ms in the center of a gray background. Stimuli consisting of a letter and five digits were shown for roughly 53 ms and then masked for 100 ms. Participants were asked to report the letter and its location during each trial with the two questions in random order.
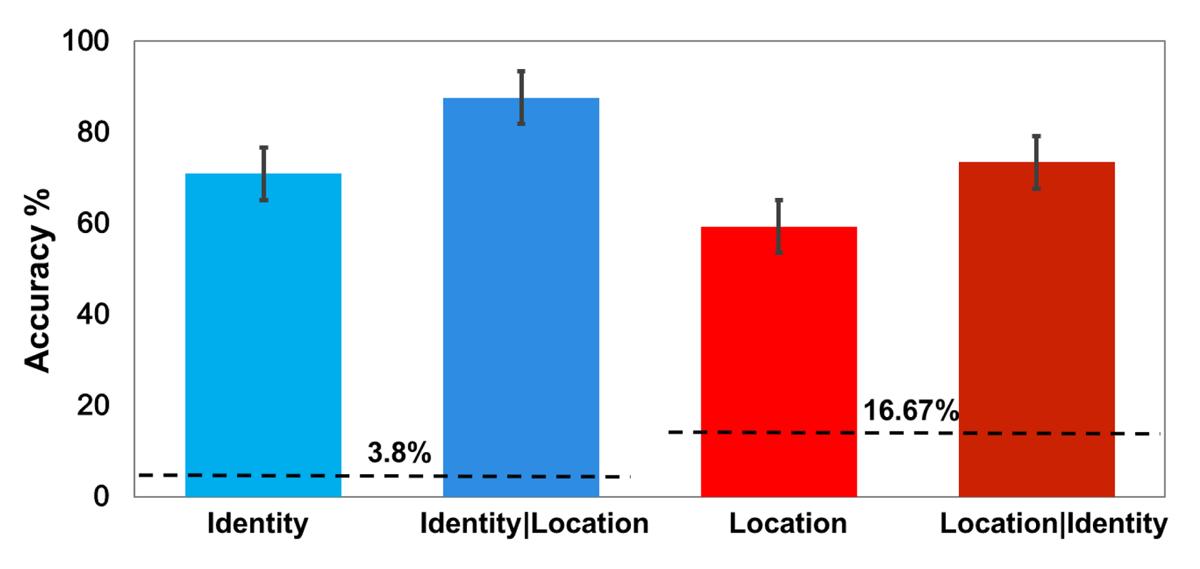
Figure 2
The results from Experiment 1a, before correcting for guesses. The first and third bars show the accuracy of identity and location respectively. The second bar depicts identity accuracy for trials in which participants correctly reported the target location. The last bar represents location accuracy for trials in which the target was correctly identified. Error bars represent standard errors and the horizontal dashed lines represent chance levels.
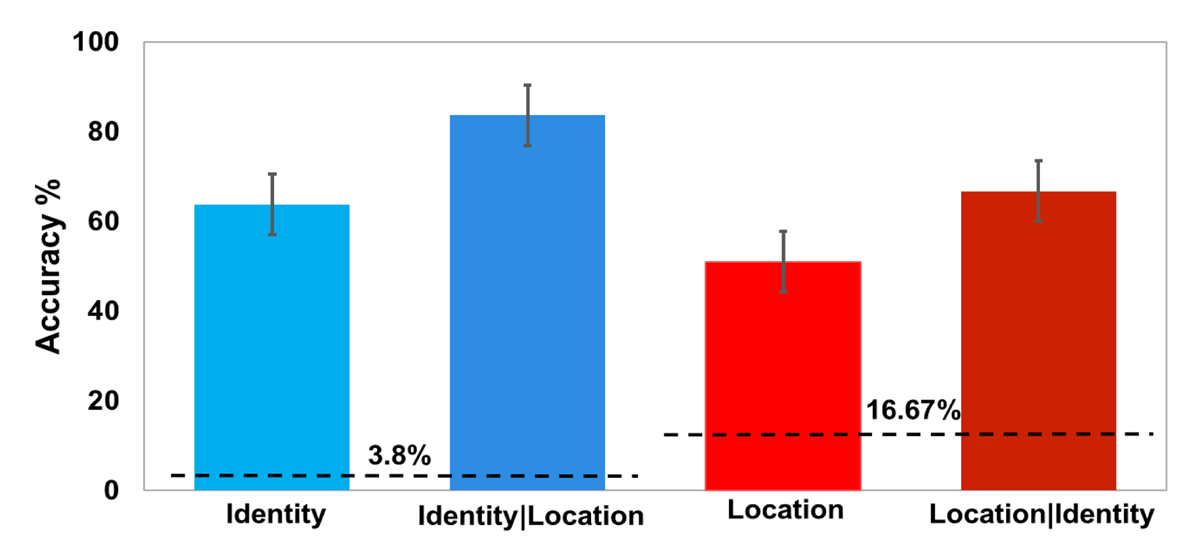
Figure 3
The results from Experiment 1b, before correcting for guesses. Bars represent the same parameters as in Figure 2.
Table 1
Performance on identity and location in trials where identity had been reported successfully. The last column (numbers in bold) represents location report error rate in successful identity reports after correction for all guesses.
| Experiments | Identity accuracy | Location accuracy given correct identity | True location errors | ||
|---|---|---|---|---|---|
| Observed | Observed | After correction for location guessing | After correction for location and identity guessing | ||
| 1a | 70% | 71% | 65.2% | 63.5% | 36.5% |
| 1b | 62.7% | 64.3% | 56.8% | 54.5% | 45.5% |
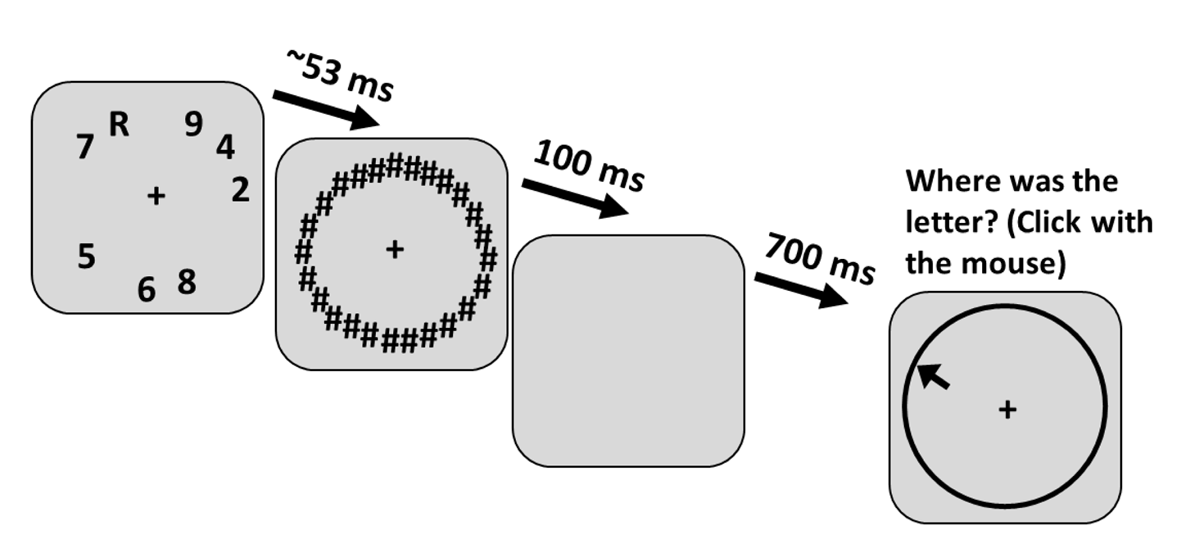
Figure 4
Experiment 2a trial example. Participants reported both location and identity in each trial in randomly selected order, but the question of identity has not been included in the figure. There were 60 hash-marks in the actual trial. The black arrow indicates the mouse pointer that had to be moved to the circle to complete a response.
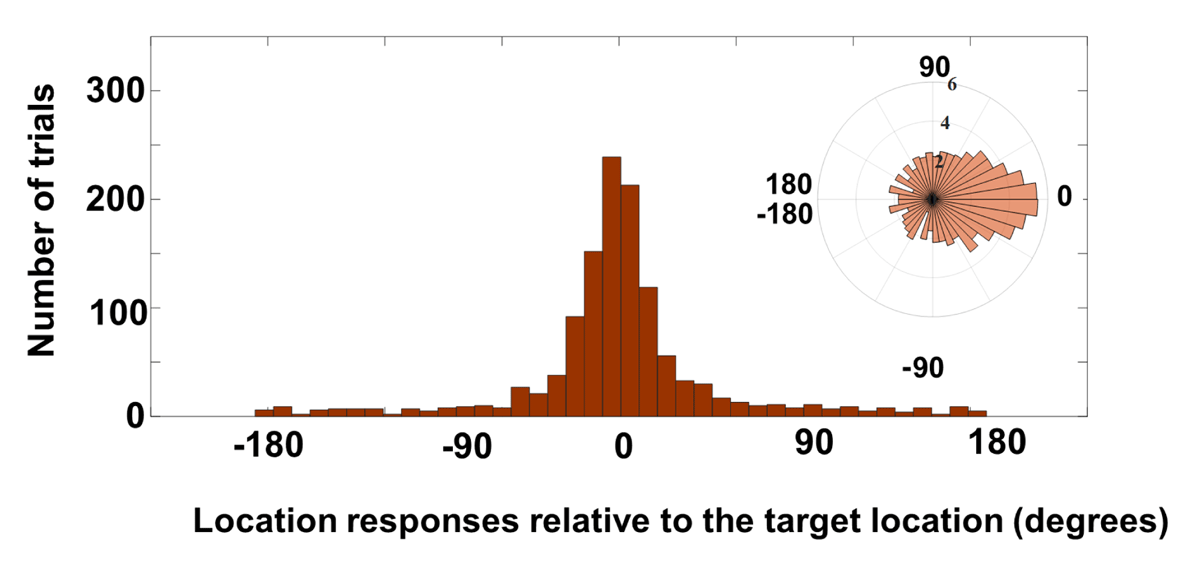
Figure 5
Location report data of Experiment 2a for all correctly identified letters. The polar plot has been log-transformed for the ease of visualizing low-N bins.
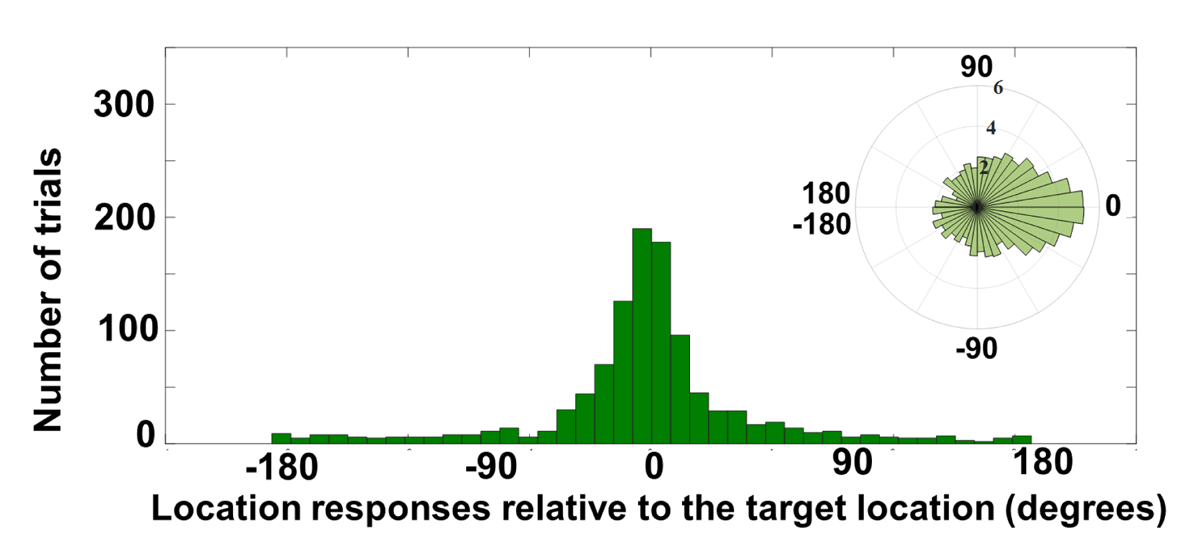
Figure 6
Location report data of Experiment 2b for all correctly identified letters. The polar plot was log-transformed for the ease of visualizing low-N bins.
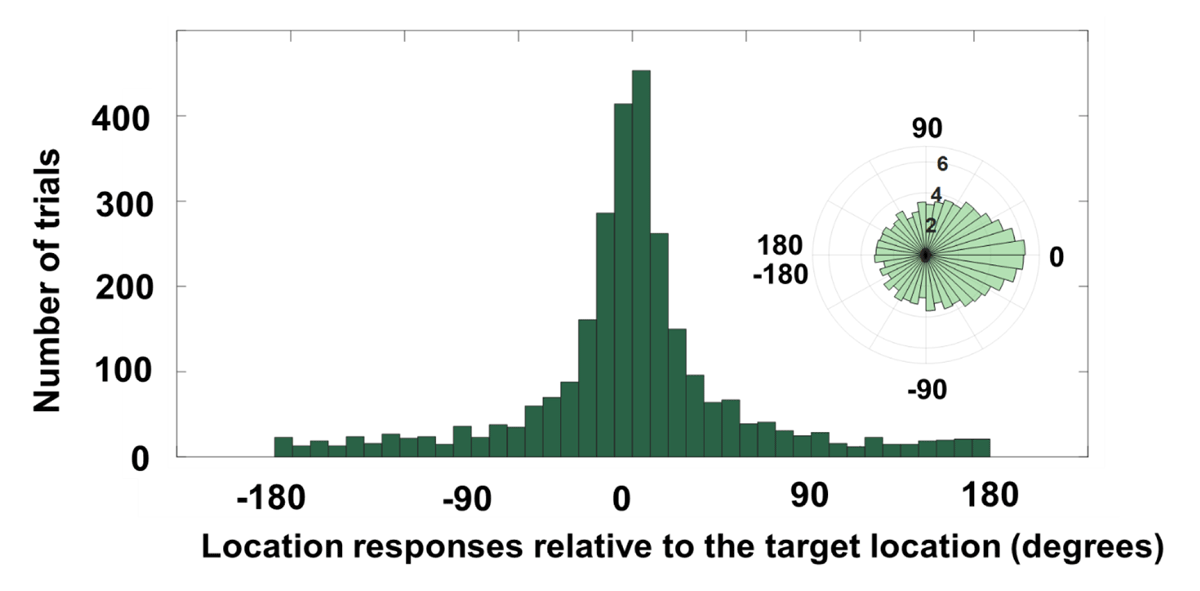
Figure 7
Location report data of Experiment 2c for all correctly identified letters. The polar plot was log-transformed for the ease of visualizing low-N bins.
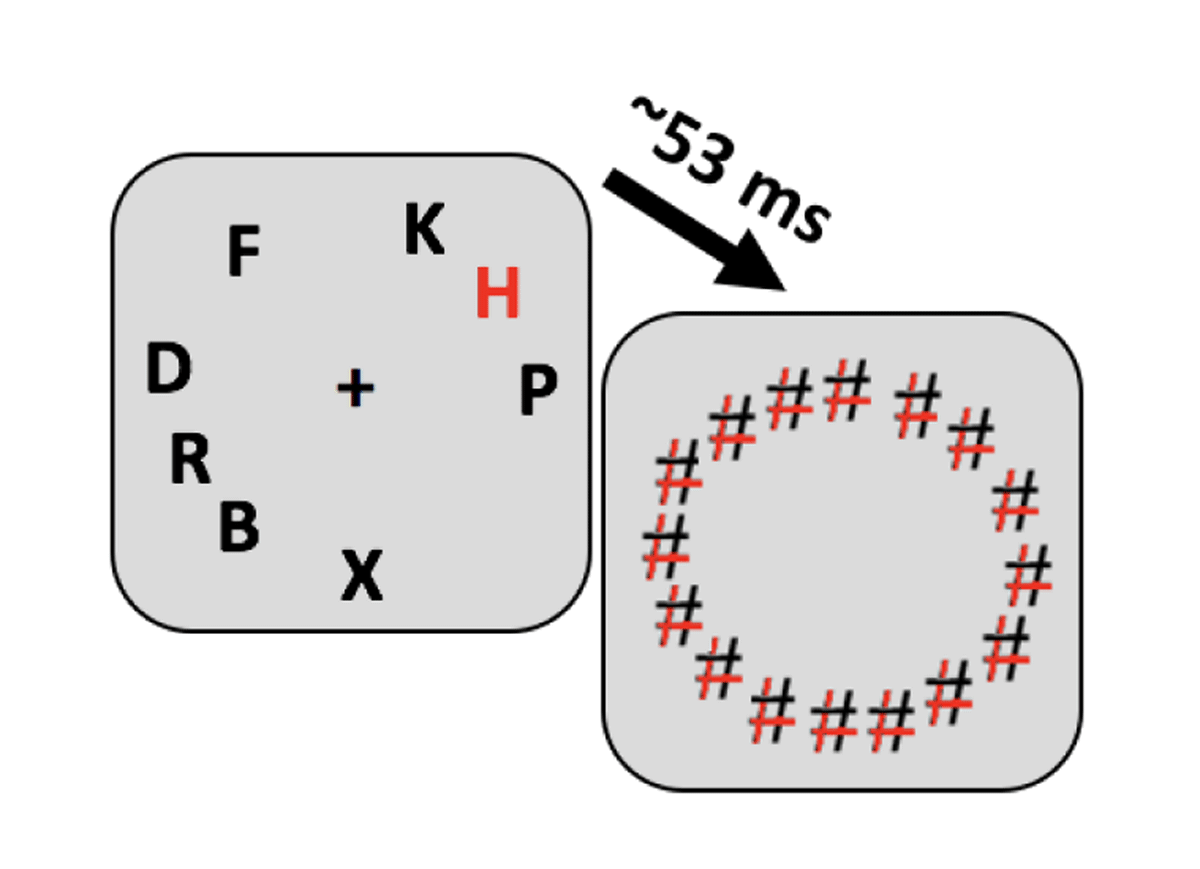
Figure 8
A trial example of Experiment 3 (There were 34 hash marks in the actual display). The response display is similar to Experiment 2.
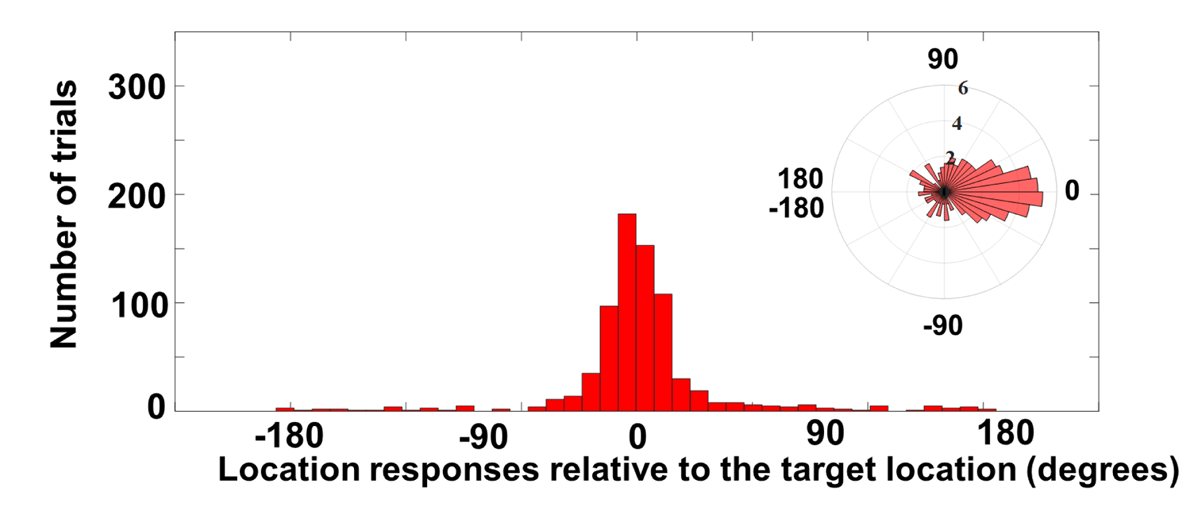
Figure 9
Location report data of Experiment 3 for all correctly identified letters. The polar plot was log-transformed for the ease of visualizing low-N bins.
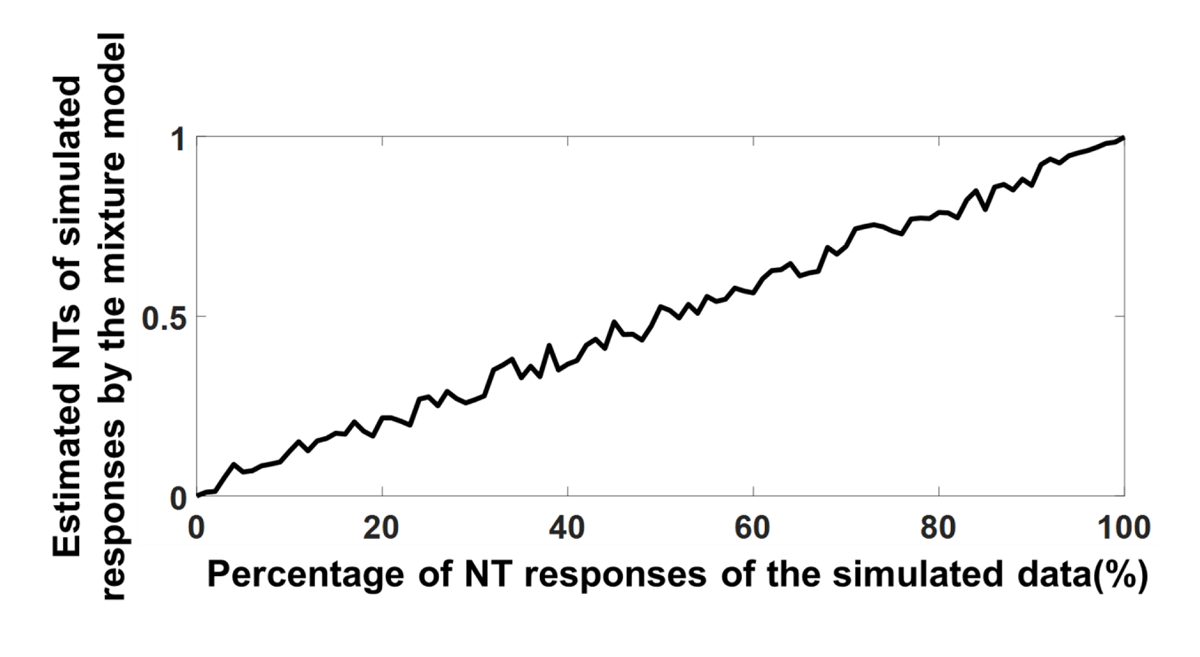
Figure 10
Mixture model NT testing. Proportion of estimated NT responses of the simulated data by the mixture model as a function of NT responses of the simulated data.
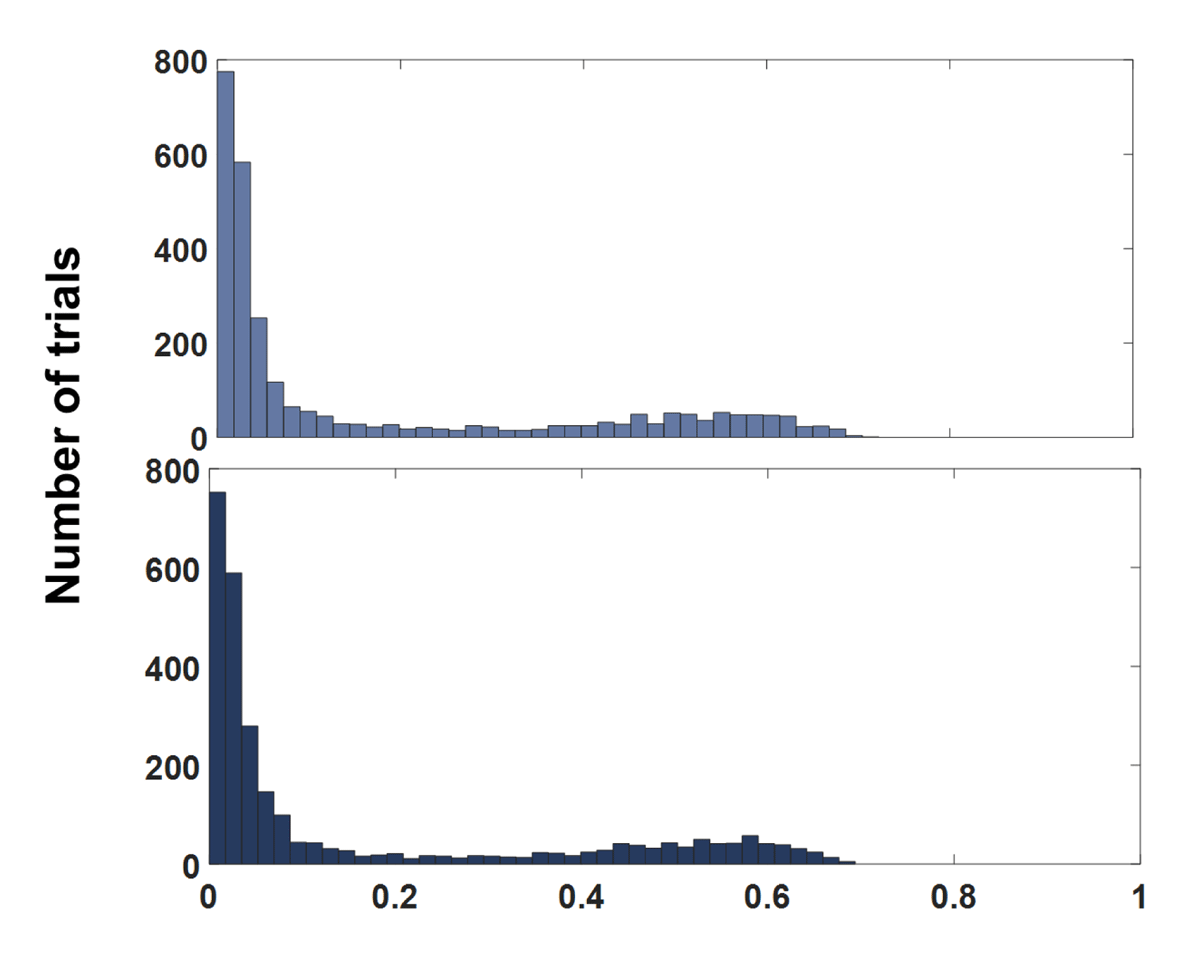
Figure 11
Estimated log likelihood of the NT component by the mixture model for the real data (top) and the simulated data (bottom).