
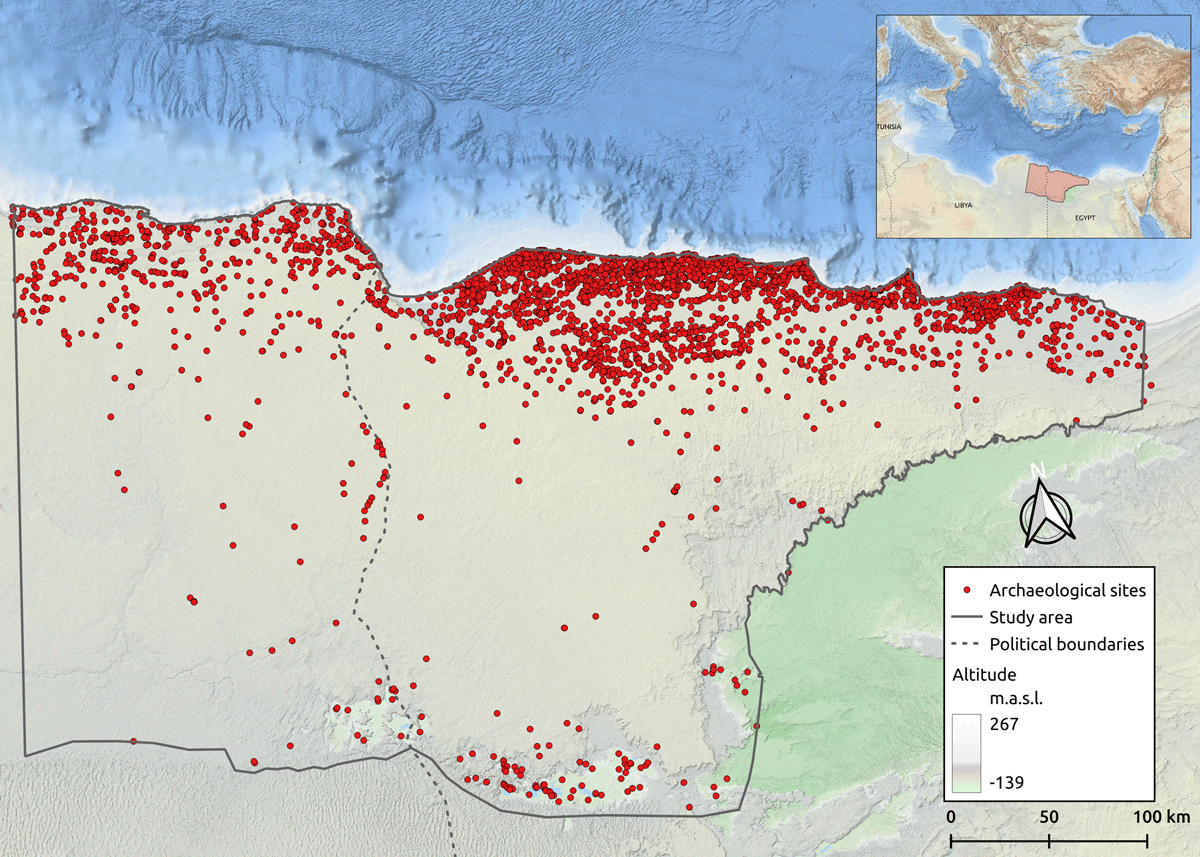
Figure 1
Map of the Marmarica region displaying the sites documented during the project.
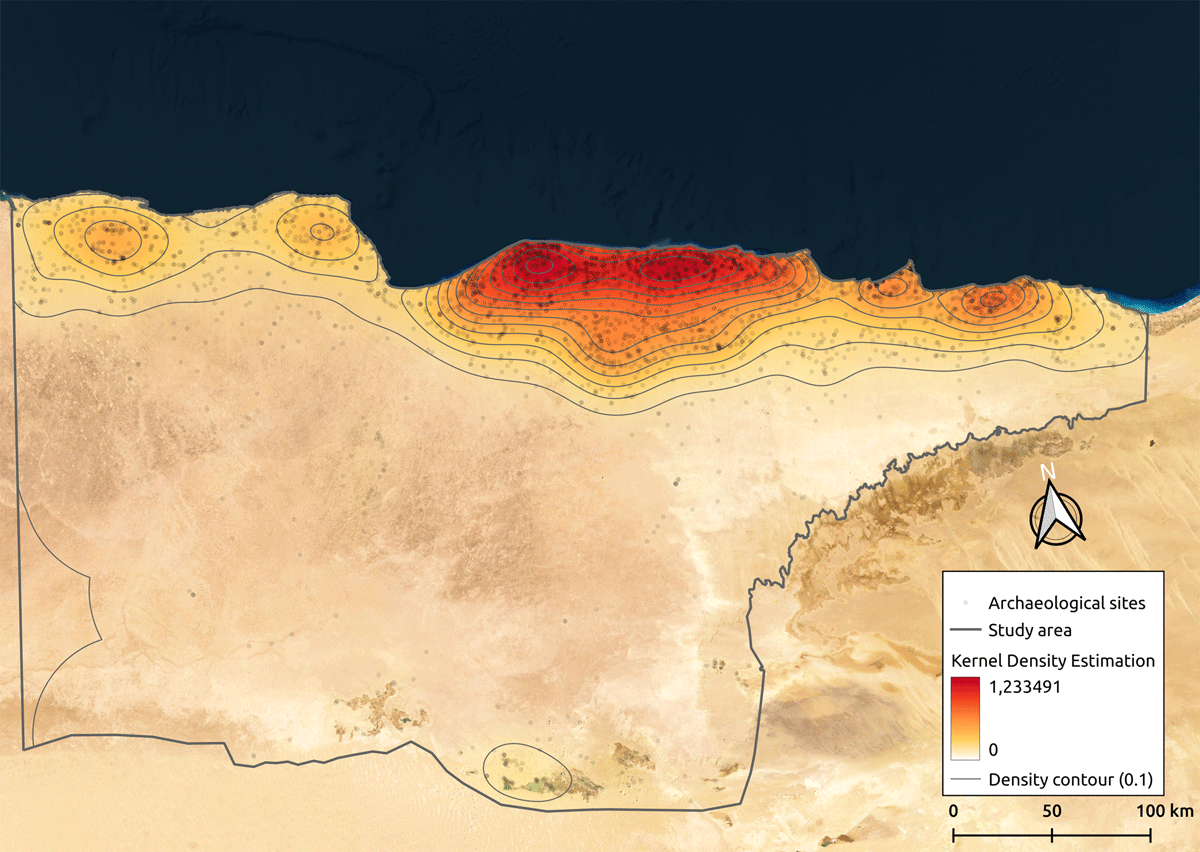
Figure 2
Kernel density shows a high cluster of archaeological and heritage sites mostly along the coast and inland oases.
Table 1
Chronological scheme.
| TEMPORALITIES | CULTURAL PERIOD | DATE |
|---|---|---|
| Late Bronze Age | New Kingdom | 15th – 11th BC |
| Early Iron Age | Third Intermediate period | 11th – 7th BC |
| Archaic (Iron Age) | ||
| Classical | Late period | 7th – 4rd BC |
| Hellenistic | Ptolemaic period | 4rd – 1st BC |
| Roman | Roman period | 1st BC – 3rd AD |
| Late Roman | Late Roman period | 3rd – 7th AD |
Table 2
Database record structure.
| VARIABLE | TYPE | EXAMPLE |
|---|---|---|
| ID | string | PE_00002 |
| Zone | numeric | 2 |
| Modern_Name | string | Bates’s Island |
| Old_Name | string | Unknown |
| Coord_x | numeric | 27.266849 |
| Coord_y | numeric | 31.361078 |
| Accuracy | string | High |
| Validation | numeric | 4 |
| Type | string | Settlement |
| Subtype | string | Harbour |
| Eco_Zone | string | Coastal zone and northern tableland |
| Risk_Level | string | High |
| Cod_Risk | string | 2, 3, 4 |
| Remains | dichotomous | Yes |
| Chronology | string | Late Bronze Age, Early Iron Age, Archaic, Classical, Hellenistic, Roman, Late Roman |
| Keywords | string | Marmarica coast, Marsa Matruh, Shells, Cannanite amphora, Cypriot pottery, Trade, Ships |
| Description | string | Island settlement. Crete, which lies ca. 420 km northwest of Matruh, was perhaps the final point west for eastern Mediterranean traders |
| Biblio_ref | string | (White, D. 1986: 51–84) |
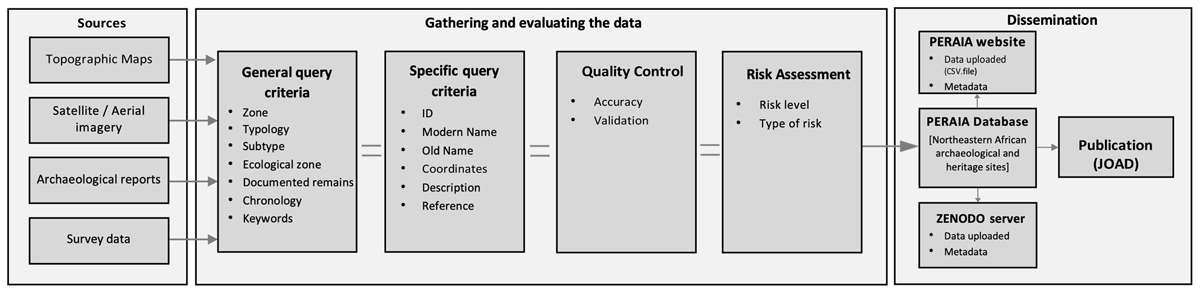
Figure 3
Conceptual model of data collection, validation, and dissemination process.
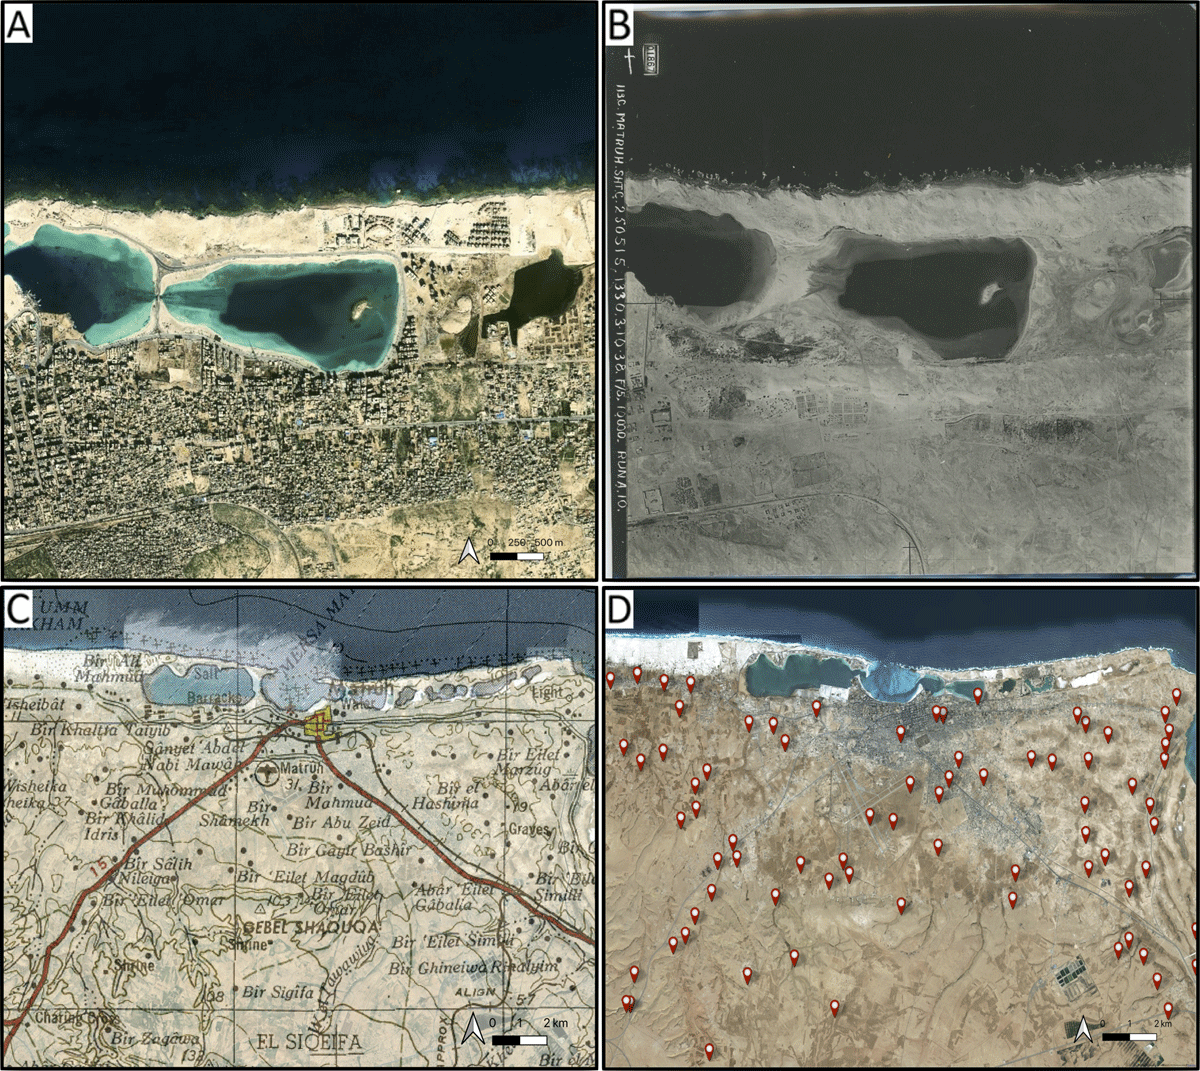
Figure 4
Digitisation process of the Mersa Matruh area (NW-Egypt) based on the cross-checking of different sources. (A) Satellite imagery showing changes to its coastline and present-day urban expansion; (B) Historical aerial photograph from 1938 taken by the Royal Air Force (RAF) (© UCL Institute of Archaeology); (C) Topographic map from 1955, US Army Map Service (P502, Sheet NH 35–3 Matruh); (D) Spatial distribution of digitised sites by the project covering the entire area (Basemap: © ESRI).
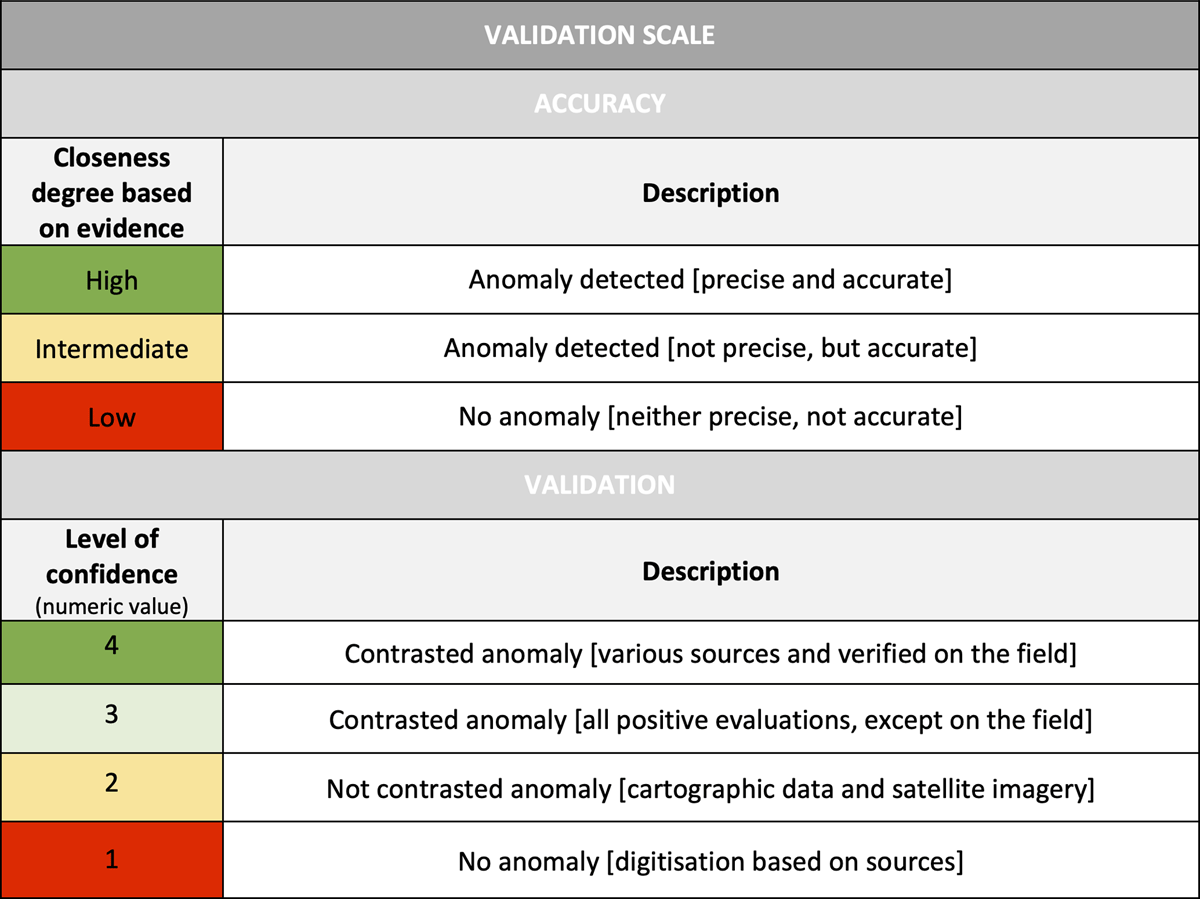
Figure 5
Validation scale with fields of accurate of digitized sites and level of confidence of sources.
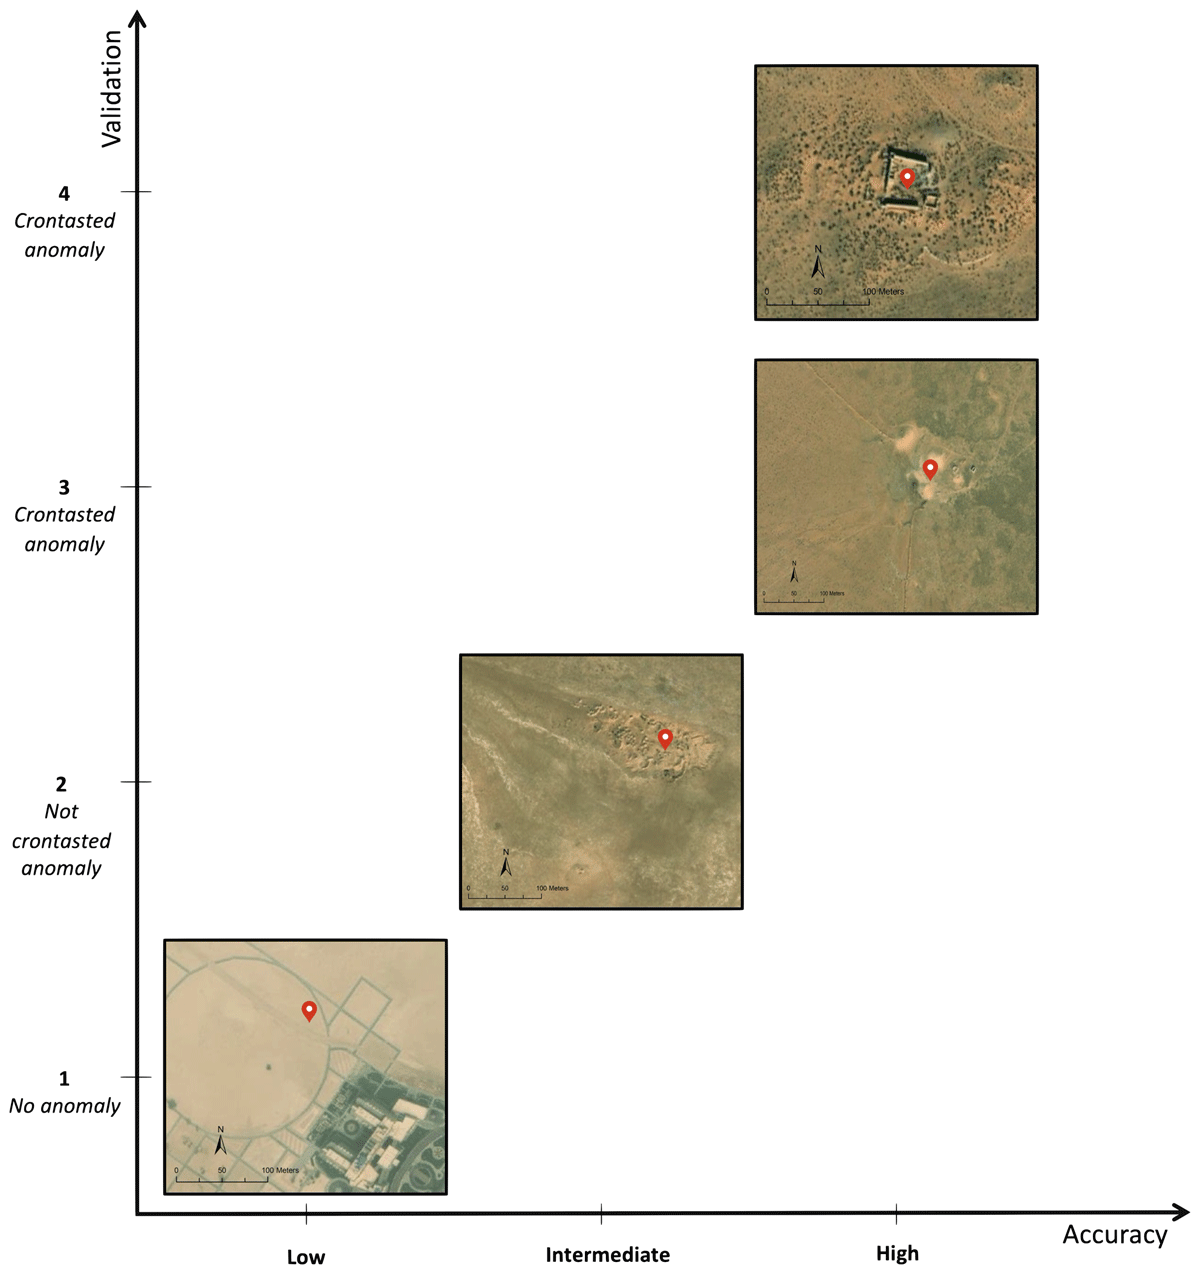
Figure 6
Examples of archaeological sites according to their closeness degree based on observed evidence, and the level of confidence provided by the sources.
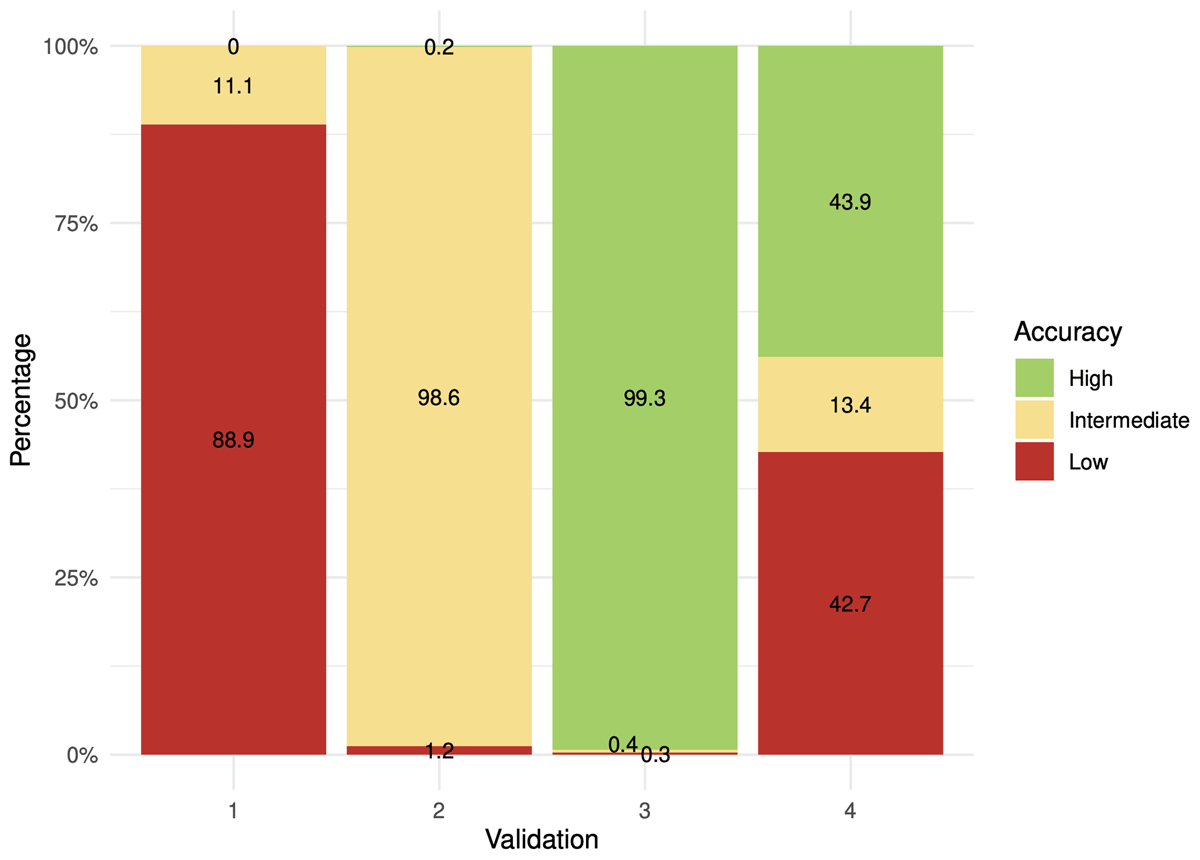
Figure 7
Chart displaying the relationship between accuracy and validation of the documented sites.
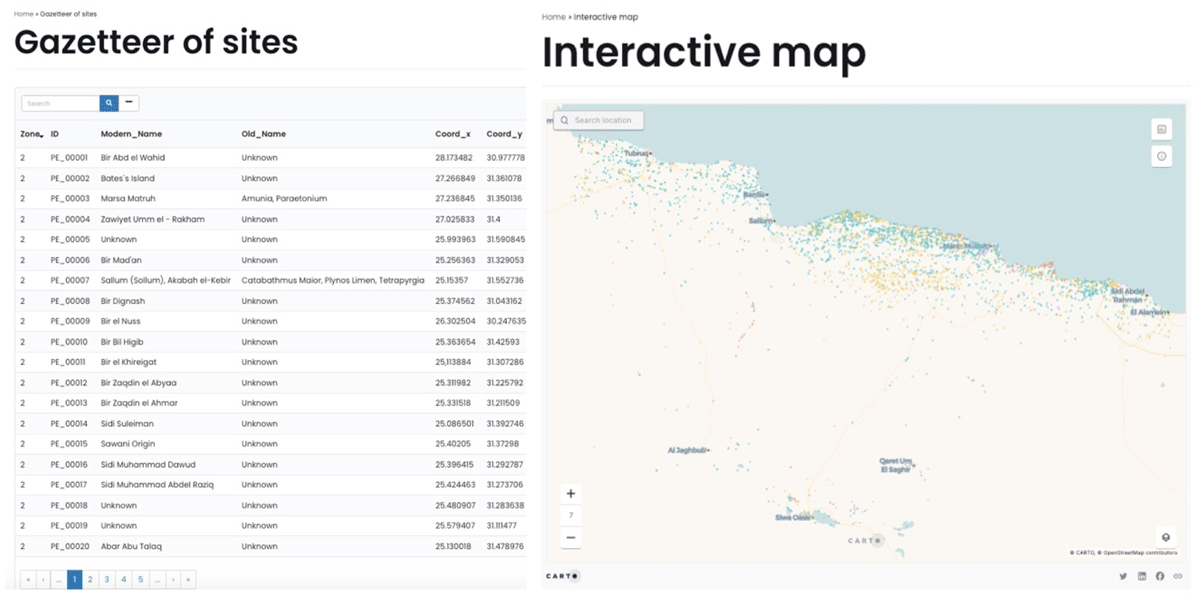
Figure 8
PERAIA web service providing access to the database for direct query and downloading in CSV format, and visualisation of the interactive map.