
(1) Overview
Context
Marmarica is a region located in north-eastern Mediterranean Africa, covering areas of present-day Libya and Egypt. Although Marmarica is not a well-defined geographical entity, its limits can be set at the Libyan Sea (Mediterranean Sea), to the North; the margins of the Libyan desert, to the South, and the borders with Cyrenaica (Jebel Akhdar, the “Green Mountain”), to the West. In its Eastern part the boundaries are much less clear, so we used the limits of the Qattara depression to define the study area [9, 10] (Figure 1). From a bioclimatic point of view, Marmarica is mainly characterized by its semi-arid and arid conditions. Meanwhile, its orography varies from stepped gullies in the North, to the great plains sloping down to the south occupying much of the region. At a more detailed scale, the presence of numerous dry riverbeds with potential seasonal flooding -known as wadis-, especially in the coastal zone, and a few oases in the South (mainly al-Jaghbub in Libya and Siwa in Egypt) should be highlighted [10, 14].
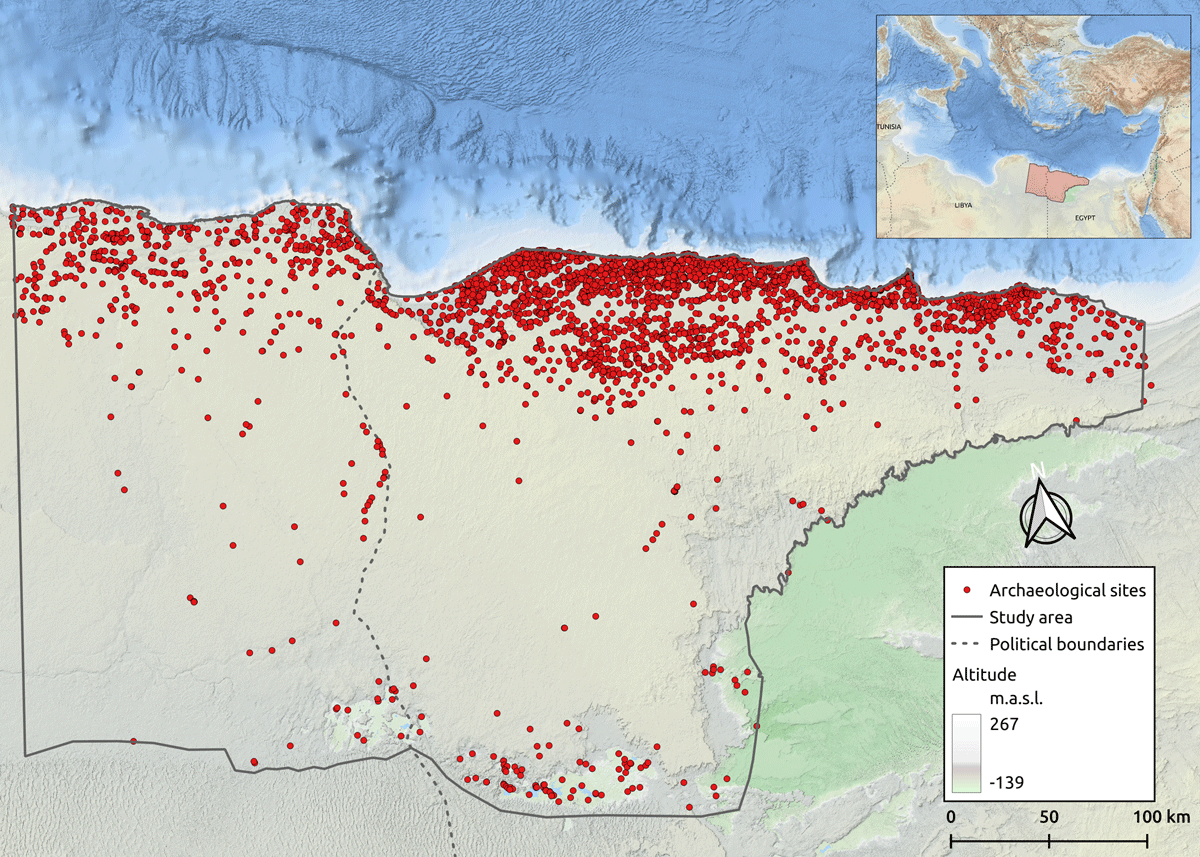
Figure 1
Map of the Marmarica region displaying the sites documented during the project.
From a historical and archaeological point of view, the special relevance of this region lies in the fact that it became a transit point between two key areas: the Nile Valley and Cyrenaica. Alongside this East-West mobility, multiple North-South connections have been documented between the coastal settlements and the inland oases [12]. In view of these circumstances, it is fundamental to consider the mobility patterns along these semi-arid and arid lands and their contribution to the development of settlement and livelihood strategies. Water scarcity was a factor that had a clear impact on the socio-spatial organisation of settlement, agriculture, and pastoral activities of ancient societies, but it would undoubtedly also have affected the way these communities would have moved through the landscape [5]. Nevertheless, its frontier character and environmental conditions might contribute to defining Marmarica as “marginal”. Notwithstanding, Rieger [9] has pointed out the “importance and value of studying marginal habitats, spaces, and socio-economic practices”, especially when some approaches “have been proven to be too simplistic and static”. This is precisely the case of Marmarica, an archaeological understudied region, mainly seen through textual and iconographic sources produced by the neighbouring groups.
To infer human mobility in such a context, it is common to locate settlements, watering places, and archaeological remains scattered across the landscape that serve as proxies to be integrated into GIS platforms to represent interrelationships with other geographical and environmental data. This procedure has been conducted by tying together various strands of evidence, from satellite imagery, historical resources, and environmental data. Our aim has been to establish a comprehensive open-access dataset of archaeological sites to provide a deeper archaeological and historical understanding of North African heritage (Figure 2); and, at the same time, to trace the network representation of human mobility and interaction patterns in harsh environments along the vast region of Marmarica.
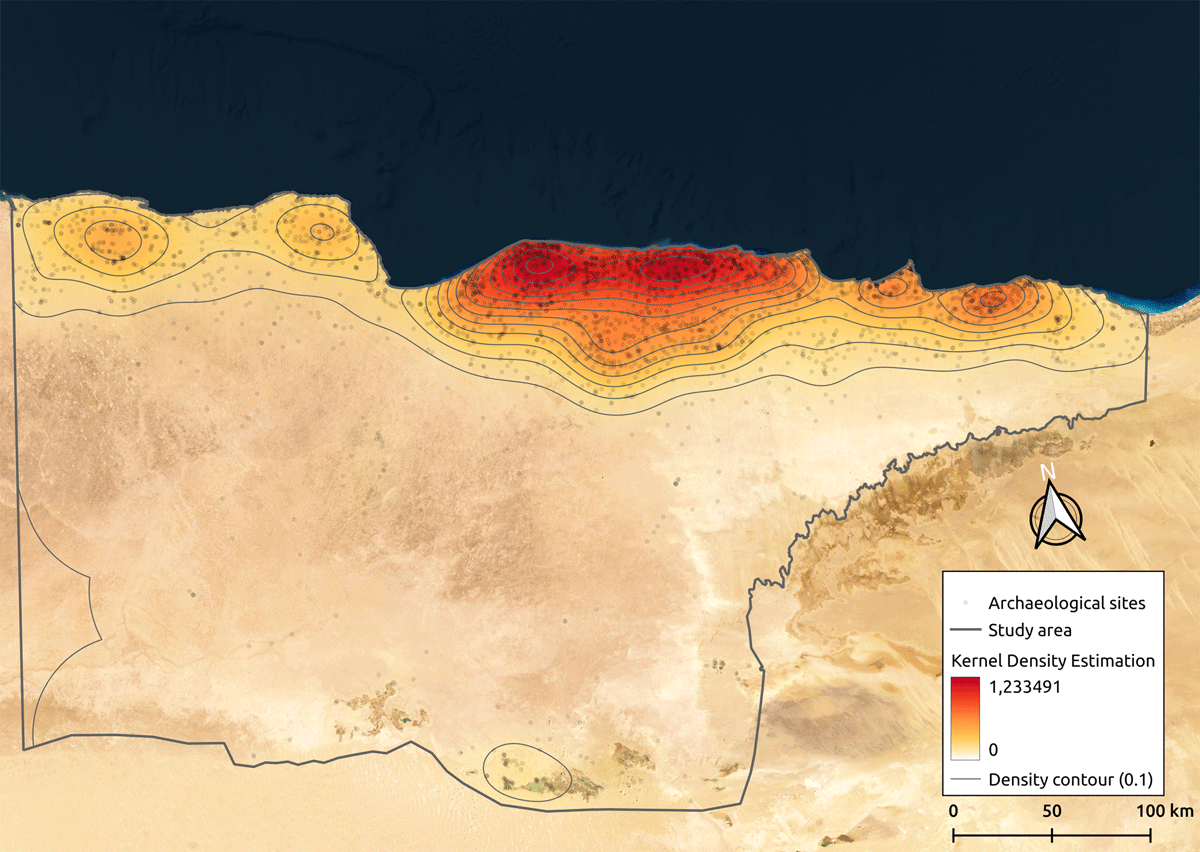
Figure 2
Kernel density shows a high cluster of archaeological and heritage sites mostly along the coast and inland oases.
Spatial coverage
WGS 84/UTM zone 35N [projected] [EPSG:32635]
Description: North-eastern Libya; North-western Egypt.
Northern boundary: 3608798 m
Southern boundary: 3164641 m
Eastern boundary: 711754 m
Western boundary: 95617 m
Temporal coverage
Late Bronze Age to the Roman period of present-day Egypt and Libya (ca. 1400 BC – 600 AD).
The temporal framework developed for this research is based on the chronology suggested on the Digital Egypt for Universities website, a learning and teaching resource developed by the University College London (UCL) [3]. The complete set of temporalities was established as follows: sites are defined into temporal brackets of human occupation predominantly identified by pottery sherds, soil sedimentation analysis or architectural features identified during field surveys or published archaeological reports. The information contained in the field “Temporalities” of Table 1 corresponds to the chronology assigned for each site in the database.
Table 1
Chronological scheme.
| TEMPORALITIES | CULTURAL PERIOD | DATE |
|---|---|---|
| Late Bronze Age | New Kingdom | 15th – 11th BC |
| Early Iron Age | Third Intermediate period | 11th – 7th BC |
| Archaic (Iron Age) | ||
| Classical | Late period | 7th – 4rd BC |
| Hellenistic | Ptolemaic period | 4rd – 1st BC |
| Roman | Roman period | 1st BC – 3rd AD |
| Late Roman | Late Roman period | 3rd – 7th AD |
(2) Methods
Steps
The development of the data model was a fundamental preliminary step. The design was based on a solid, yet modular structure for the spatial database, with the aim of storing and managing all the data associated with each site (Table 2). The goal was to develop a model adaptable to the research questions of the project and, at the same time, extend its inferential capacity considering ontologies and controlled vocabularies shared with other projects working with Open Data (Figure 3) ([1, 4, 17] among others).
Table 2
Database record structure.
| VARIABLE | TYPE | EXAMPLE |
|---|---|---|
| ID | string | PE_00002 |
| Zone | numeric | 2 |
| Modern_Name | string | Bates’s Island |
| Old_Name | string | Unknown |
| Coord_x | numeric | 27.266849 |
| Coord_y | numeric | 31.361078 |
| Accuracy | string | High |
| Validation | numeric | 4 |
| Type | string | Settlement |
| Subtype | string | Harbour |
| Eco_Zone | string | Coastal zone and northern tableland |
| Risk_Level | string | High |
| Cod_Risk | string | 2, 3, 4 |
| Remains | dichotomous | Yes |
| Chronology | string | Late Bronze Age, Early Iron Age, Archaic, Classical, Hellenistic, Roman, Late Roman |
| Keywords | string | Marmarica coast, Marsa Matruh, Shells, Cannanite amphora, Cypriot pottery, Trade, Ships |
| Description | string | Island settlement. Crete, which lies ca. 420 km northwest of Matruh, was perhaps the final point west for eastern Mediterranean traders |
| Biblio_ref | string | (White, D. 1986: 51–84) |
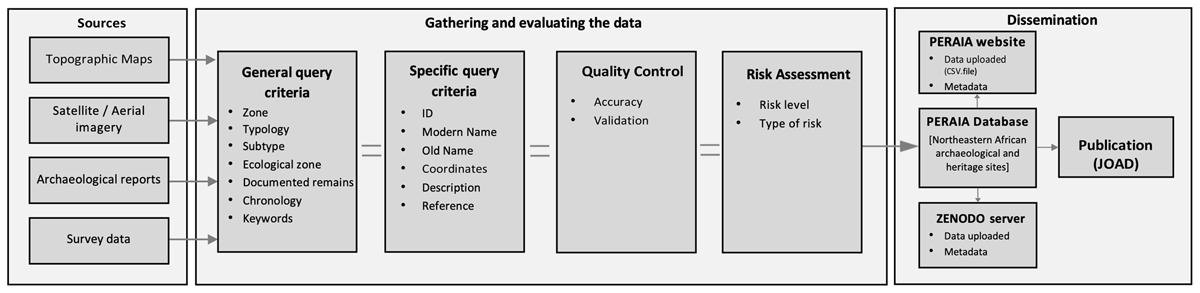
Figure 3
Conceptual model of data collection, validation, and dissemination process.
The current situation of the data available for the study region prompted the use of different sources to collate and obtain more information on archaeologically underrepresented areas. To this end, we carried out an aerial survey through photo-interpretation aimed at the identification of known and unknown archaeological and heritage sites in the study area, using satellite imagery and historical aerial photographs, combined with data from field surveys and georeferenced topographic maps1 (Figure 4). This last set of maps contains relevant information about the region, such as topographical features, water places, settlements, or traditional paths. Interpreting satellite imagery has made it possible to map and to record archaeological and heritage sites across large areas and places where access would not otherwise have been possible [7, 8, 11]. This procedure had two main outcomes: first, it led to a better understanding of the spatial organisation of the territory and the location of features in the landscape; second, it allowed for a digitally mapping and recording of the ancient archaeological and heritage sites, along with geographical and environmental data inside the study area (i.e., how sites interrelate and form complex social landscapes).
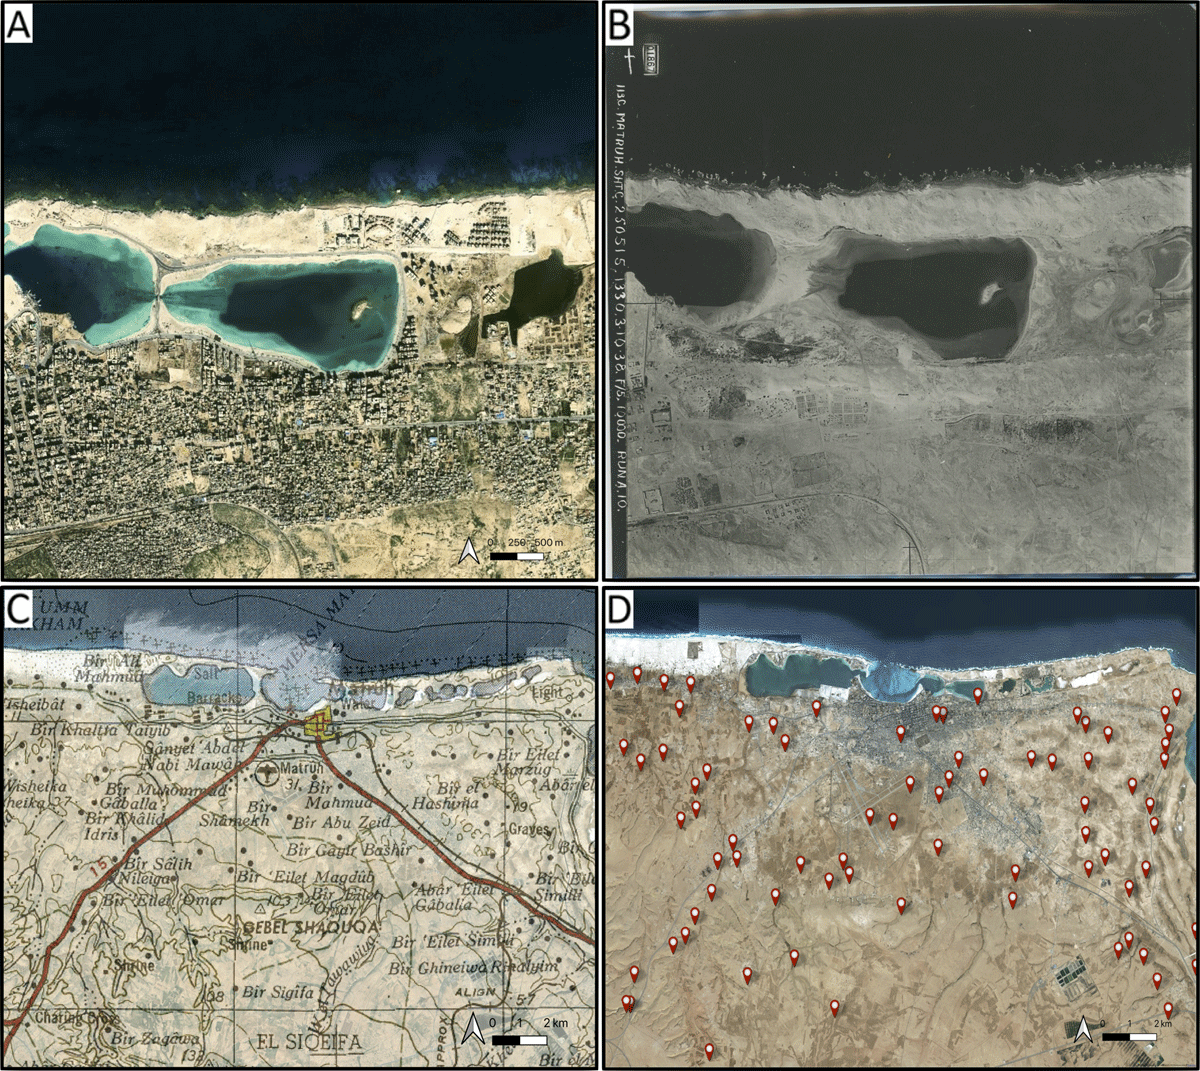
Figure 4
Digitisation process of the Mersa Matruh area (NW-Egypt) based on the cross-checking of different sources. (A) Satellite imagery showing changes to its coastline and present-day urban expansion; (B) Historical aerial photograph from 1938 taken by the Royal Air Force (RAF) (© UCL Institute of Archaeology); (C) Topographic map from 1955, US Army Map Service (P502, Sheet NH 35–3 Matruh); (D) Spatial distribution of digitised sites by the project covering the entire area (Basemap: © ESRI).
Sampling strategy
All data were collected in ArcGIS 10.5. The GIS platform enabled us to georeference the imagery and historical sources in order to identify and register each archaeological site in its geographical location within the study area. In addition, the information from available published surveys and archaeological reports completes the dataset. In this sense, several aspects regarding the long-term human occupation of Marmarica need to be addressed. Evidence for water harvesting and management of historical agropastoral production ranging from the second millennium BC onwards can be used to trace the historical human activity in the region [6, 9, 10, 12, 13, 14, 15]. To this end, our recording has not only been focused on historical settlements and burial places but also on productive areas and watering places (cisterns). These last two locations arguably act as junction nodes; by extension, these sources can be used for the reconstruction of mobility patterns within the region and their connections to other surrounding areas.
Each site recorded in the database is identified with an ID, name, place categories, coordinates, and chronology. Some of these core elements are present in other gazetteers, and for interoperability reasons, we have followed their same semantic structure. Likewise, these elements are complemented with fields specific to this project, such as zonification number, ecological zone, documented remains, keywords, description, and associated references. Furthermore, we have integrated a validation scale based on the geolocation and available information of sites, and –complementarily– a risk assessment of potential risks threat (Figure 3). As a result, a total of 3352 sites were recorded, with a chronology ranging from Late Bronze to Roman times. Thus, 2717 of these sites correspond to Eastern Marmarica (NW-Egypt), and 635 sites to Western Marmarica (NE-Libya).
Quality Control
We are aware of the uncertainties caused by the nature of the archaeological record. Even data obtained by direct measurements conducted during field surveys (and, therefore, considered to be absolute) are accompanied by some level of uncertainty. Although the importance of this issue is widely recognised [2], we still need to advance in the development of processes and methods to reduce such uncertainties.
To this end, the project has developed a scale for validating the collected data, which was applied during the identification and mapping of archaeological and heritage sites (Figure 5). This scale is relevant for two reasons. First, the variable “Accuracy” refers to two observational measurements: i) each digitized site is categorized according to the degree of observed evidence (i.e., if the anomaly corresponding to the site is detected or not in the imagery); ii) the degree of closeness to the exact location of the site (i.e., the difference between the real geographic position where the archaeological site is located and the place where we placed the digitised site). To obtain a close approximation to the real geographic position of the sites, the model takes into account the precision provided by the sources (e.g., if we have more than one source indicating the location of a site, or if the source provides us with the coordinates). Second, it refers to “Validation”, which is a qualitative variable based on the level of confidence placed in the type of source from which we have obtained the information. It is used to contrast and also collect the associated information for each of the sites that make up this dataset (Figures 6 and 7). We state that this procedure ensures research transparency as much as recognizes the uncertainty surrounding the data.
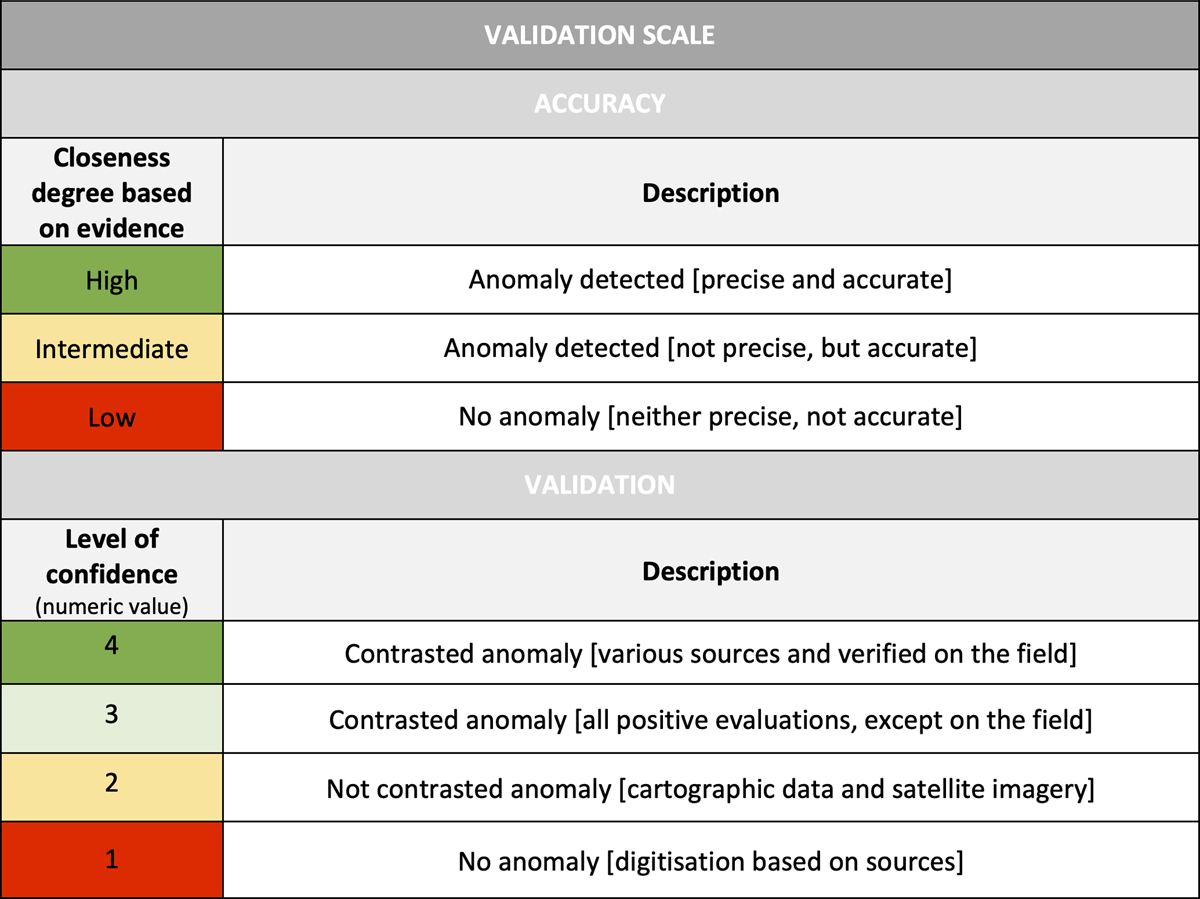
Figure 5
Validation scale with fields of accurate of digitized sites and level of confidence of sources.
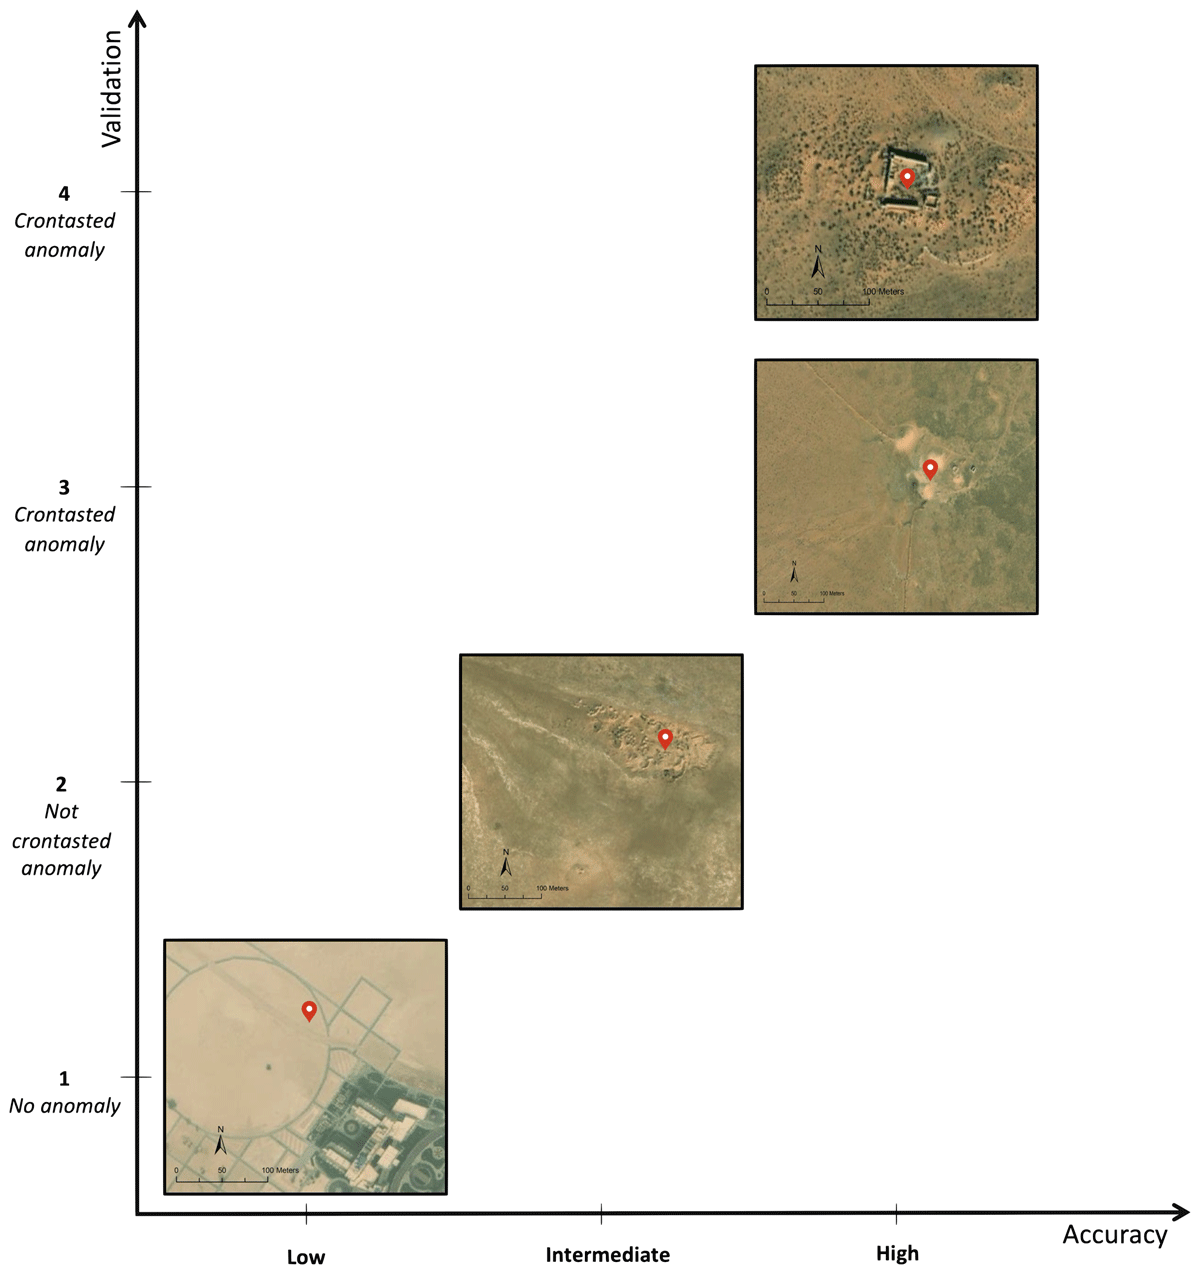
Figure 6
Examples of archaeological sites according to their closeness degree based on observed evidence, and the level of confidence provided by the sources.
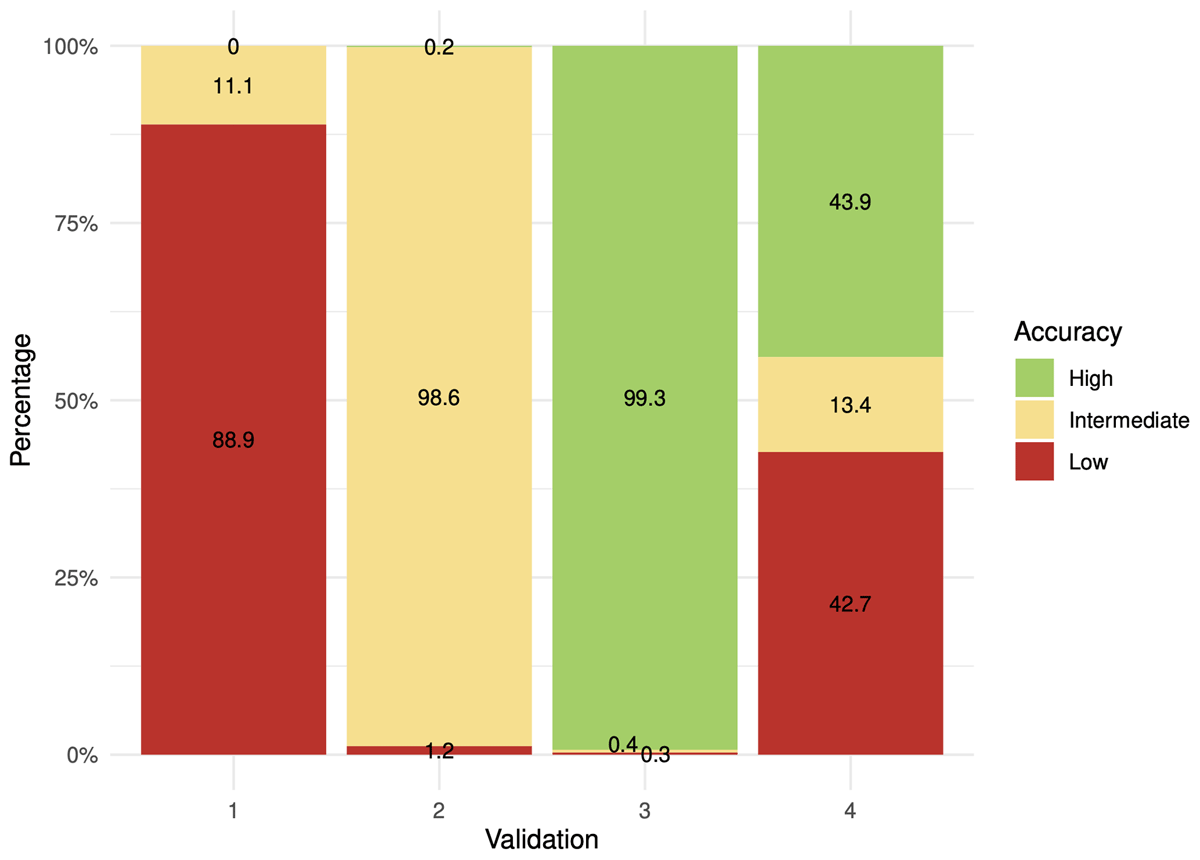
Figure 7
Chart displaying the relationship between accuracy and validation of the documented sites.
Risk Assessment
The anthropic and environmental processes pose unique challenges for the preservation of archaeological heritage in north-eastern Africa. Vast parts of this region are defined by landscape changes caused by heightened regional development. Such risk is mainly due to contemporary socio-economic processes, such as urban expansion and agricultural intensification, or environmental processes as coastline changes, accelerated by global warming and natural erosion. As a result, we are facing a fast-paced disappearance of heritage sites in the region.
We take a position in line with the approach of other projects, such as EAMENA,2 documenting the potential risk of destruction to which these historical sites are exposed [16]. This dataset also contains a model that evaluates the impact of the potential risks on this archaeological heritage. Furthermore, we provide a framework to assess the potential vulnerabilities of archaeological sites within the Marmarica region.
Constraints
Each site of interest is represented only as a point in space and no account is taken of the extent or size of the original extension. This simplified geometry has two advantages: it can be applied consistently to all sites, regardless of the information available about their original extent; it is best suited to the spatial architecture required for the reconstruction of the network representation.
(3) Dataset description
Object name
Marmarica_sites
Data type
Primary Data.
Format names and versions
.csv, .txt, .xlsx, .tiff
Creation dates
01/01/2021 – 01/05/2022
Dataset Creators
All data has been created by David Laguna-Palma.
Language
English
License
CC BY 4.0, Creative Common License.
Repository location
Zenodo last version repository (https://doi.org/10.5281/zenodo.7678852).
PERAIA website (https://peraia.ugr.es/gazetteer/).
Publication date
19/12/2022
(4) Reuse potential
The data has been stored in the project’s gazetteer, which already contains more than 3000 sites with archaeological interest. It should be noted that the gazetteer’s data does not only contain information relevant to our project, but it is designed to be connected to other archaeological platforms and portals that work with Open Data. To this end, the complete database has been uploaded to Zenodo, an open repository developed in the framework of the European Union programme, which allows uploading the dataset and associated metadata in a versionable format, as well as obtaining an alphanumeric identifier code (DOI) that allows the data to be linked and cited when utilised by other users. Our intention is that both the scientific community and local administrations, as well as any interested user, can access, review, and use the data provided.
In addition, the database of sites is embedded in the PERAIA website (https://peraia.ugr.es/), which is hosted by the University of Granada (Spain). The website service facilitates general and specific queries depending on the search criteria by providing selection tools. Ancillary to the potential reuse of all these data, the interface also enables the downloading of the entire database as a CSV file. Moreover, the web service integrates an interactive map, developed using Carto technology, where users can visualise the sites in their geographic location, and the types of sites are represented in different colors (Figure 8). Thus, any researcher, project, or institution can access the complete database and associated information of the more than 3000 archaeological sites that currently make up the gazetteer.
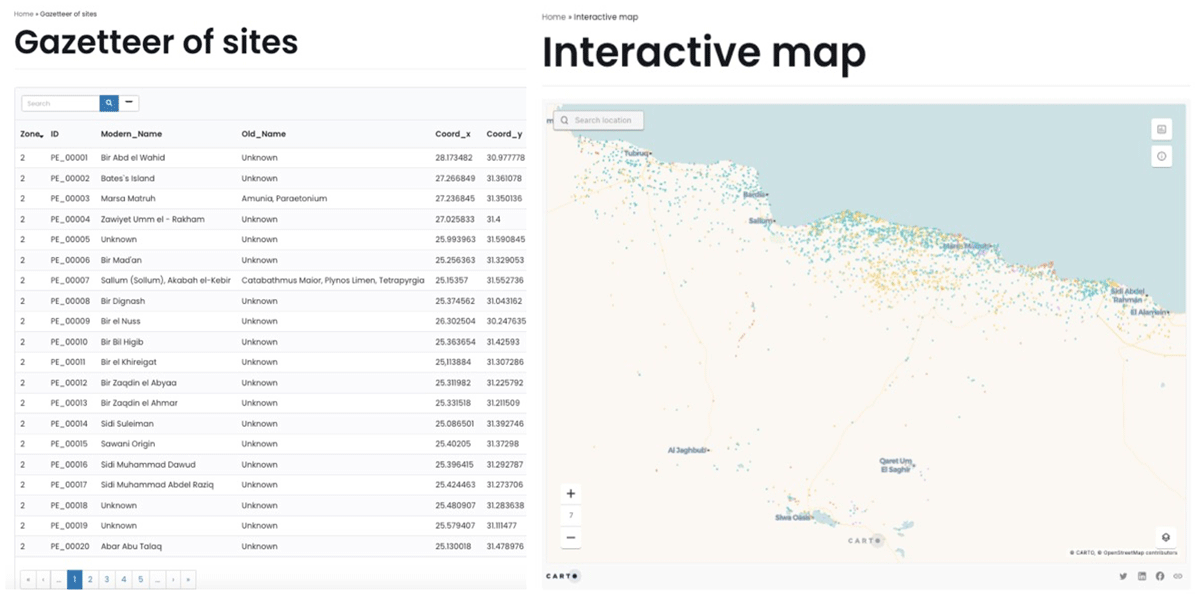
Figure 8
PERAIA web service providing access to the database for direct query and downloading in CSV format, and visualisation of the interactive map.
Notes
[2] EAMENA database. Available at: https://database.eamena.org.
Acknowledgements
The project is a joint effort between academics from different universities and countries. For this reason, we would like to thank Pau de Soto from the Autonomous University of Barcelona, Borja Legarra Herrero from the Institute of Archaeology, University College London, and Tom Brughmans from the Centre for Urban Network Evolutions (UrbNet) at the University of Aarhus for their collaboration and support in this project.
Funding Information
This project has been funded by the Spanish Ministry of Universities (FPU17/06503), and the Vice-Rectorate for Research and Knowledge Transfer of the University of Granada (Ref: PPJIB2020.18).
Competing Interests
The authors have no competing interests to declare.