
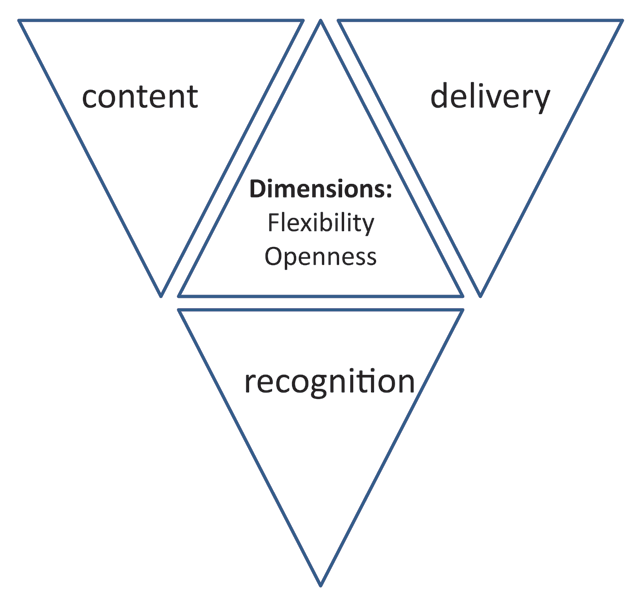
Figure 1
The OOFAT conceptual model.
Table 1
Descriptive elements in the conceptual OOFAT model.
| Category | Sub-categories | Dimension: flexibility | Dimension: openness |
|---|---|---|---|
| Delivery of higher education (of “interaction services”) | Access to content | How flexible is delivery by time/location/pace? | How open is the institution to all learners (i.e. also those not enrolled formally)? |
| Access to guidance and support | How flexible is access to full support? | Who can access support? Who can provide support? | |
| Content | Resources | [not applicable] | How open is the provision of content? (i.e. who determines the content, is co-creation being used, is it personalised or the same for all learners)? |
| Assessment | Is assessment static, and one size fits all? | Are there restrictions on who can be assessed? Who does the assessing (e.g. peer review)? | |
| Recognition | Content and process | Can different elements contribute to recognition? Are there flexible paths to recognition? | Is recognition available from multiple groups or only from one body? |
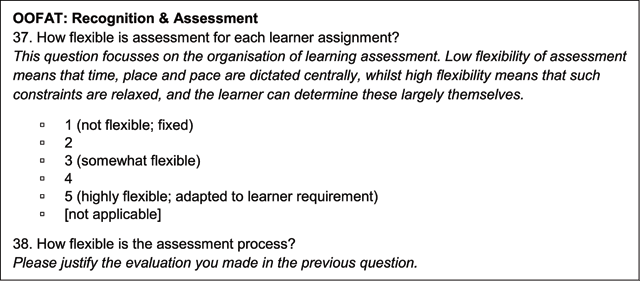
Figure 2
Example of OOFAT survey questions.
Table 2
Mode of provision by size of institution.
| Size of institution by number of enrolled students | Primarily online providers (n = 21) | Primarily distance and correspondence providers (n = 9) | Primarily campus-based providers (n = 17) |
|---|---|---|---|
| More than 100,000 (n = 10) | 5 | 5 | 0 |
| 20 – 100,000 (n = 12) | 4 | 1 | 7 |
| 1 – 20,000 (n = 15) | 5 | 3 | 7 |
| Less than 1,000 (n = 4) | 3 | 0 | 1 |
| no data | 4 | 0 | 2 |
[i] Data based on 47 cases, which provided full details on all dimensions of the OOFAT model and their prime mode of delivery.
Table 3
Mode of provision by main funding source.
| Source of funding | Primarily online providers (n = 21) | Primarily distance and correspondence providers (n = 9) | Primarily campus-based providers (n = 17) |
|---|---|---|---|
| Mainly private revenues (n = 13) | 9 | 1 | 3 |
| Roughly balanced revenues from private and public sources (n = 1) | 1 | 0 | 0 |
| Mainly public revenues (n = 30) | 9 | 8 | 13 |
| no data | 2 | 0 | 1 |
[i] Data based on 47 cases, which provided full details on all dimensions of the OOFAT model and their prime mode of delivery.
Table 4
Use of various technologies by main mode of higher education provision.
| Primarily online courses (n = 21) | Primarily distance and correspondence courses (n = 9) | Primarily campus-based courses (n = 17) | |
|---|---|---|---|
| Online Assessment | Very frequently | Used selectively | Very frequently |
| Open Educational Resources (OER) | Very frequently | Very frequently | Very frequently |
| Learning Management System (LMS) | Very frequently | Very frequently | Very frequently |
| Mobile Learning | Very frequently | Very frequently | Frequently used |
| Social Media | Frequently used | Very frequently | Very frequently |
| Massive Open Online Course (MOOC) | Frequently used | Frequently used | Used selectively |
| Videoconference | Frequently used | Frequently used | Frequently used |
| Learning Analytics | Frequently used | Used selectively | Used rarely |
| E-Portfolios | Used selectively | Used rarely | Used selectively |
| Bring Your Own Device (BYOD) | Used selectively | Used rarely | Frequently used |
| Wikis | Used selectively | Used rarely | Used selectively |
| Teleconference | Used selectively | Used selectively | Used selectively |
| Blogging and micro-blogging | Used selectively | Not used | Used selectively |
| Digital Badging | Used rarely | Not used | Used rarely |
| Artificial Intelligence | Used rarely | Not used | Used rarely |
[i] Legend: data based on 47 cases, which provided full details on their OOFAT model and their prime mode of delivery. Data ordered by frequency of deployment in primarily online course providers. Survey asked for multiple responses. Definition of terms: used very frequently = more than 75% of all HEIs in group); used frequently = by 50%–75% of HEIs; used selectively = by 25–50% of HEIs; used rarely = by 1–25% of HEIs; not used = zero responses.
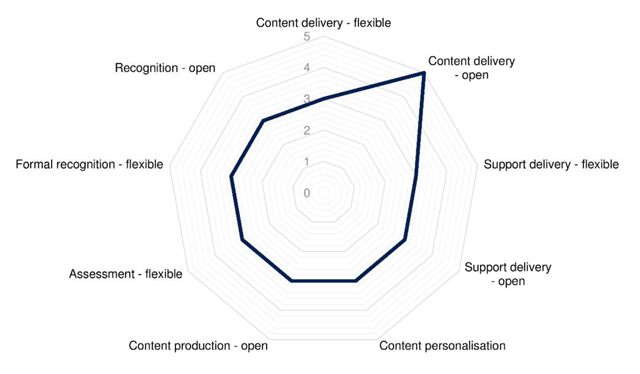
Figure 3
Dimensions of the OOFAT Model of Korea National Open University.
Interpretational aid: The score of this HEI is 5 for openness of content delivery, which means that the access is not limited to enrolled students. The score for all other areas is 3, which means that the university is active in all these areas, but they have not been prioritised.
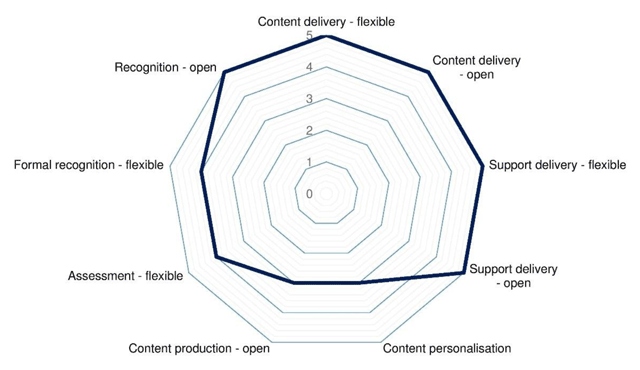
Figure 4
Example of OOFAT at the centre – OERu, New Zealand.
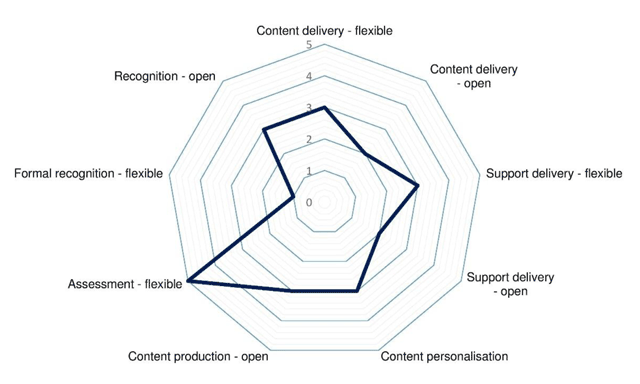
Figure 5
Example of OOFAT for organisational flexibility – College of the Canyons, USA.
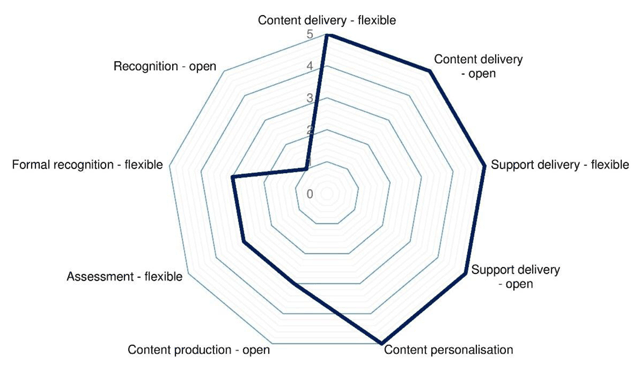
Figure 6
Example of content-focused OOFAT – National Open University of Nigeria (NOUN).
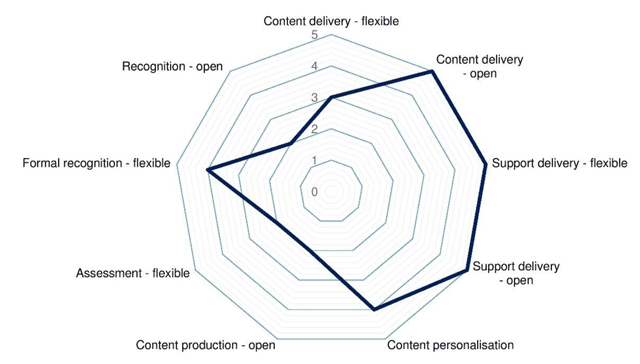
Figure 7
Example of access-focused OOFAT – Odisha State Open University, India.
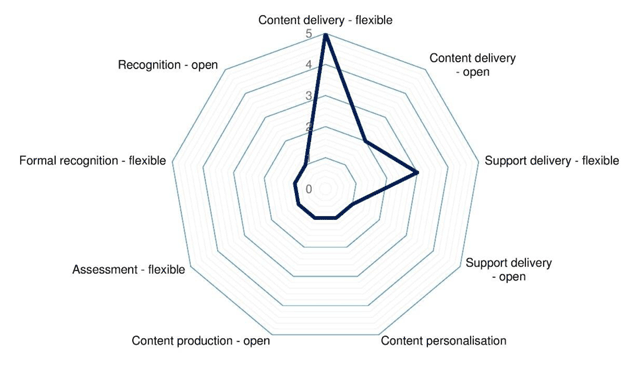
Figure 8
Example of single purpose OOFAT – Universitas Terbuka.
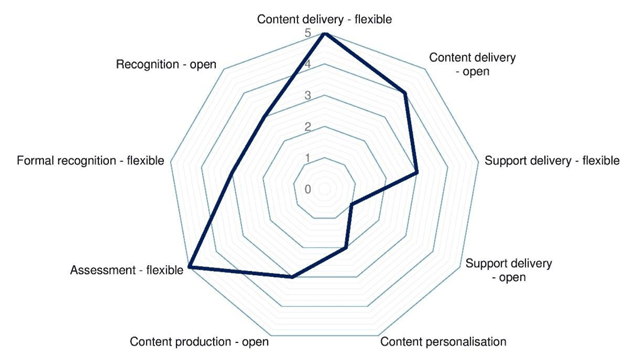
Figure 9
Example of OOFAT for multiple projects – Thompson Rivers University, Canada.
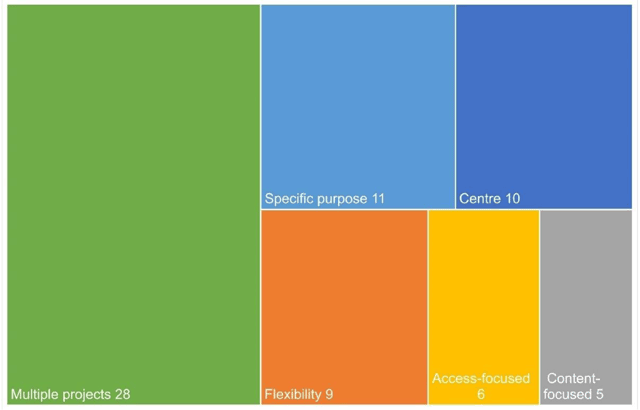
Figure 10
Spread of OOFAT models in the data set.
Note: n = 69 HEIs providing complete responses on all dimensions of the OOFAT model.