
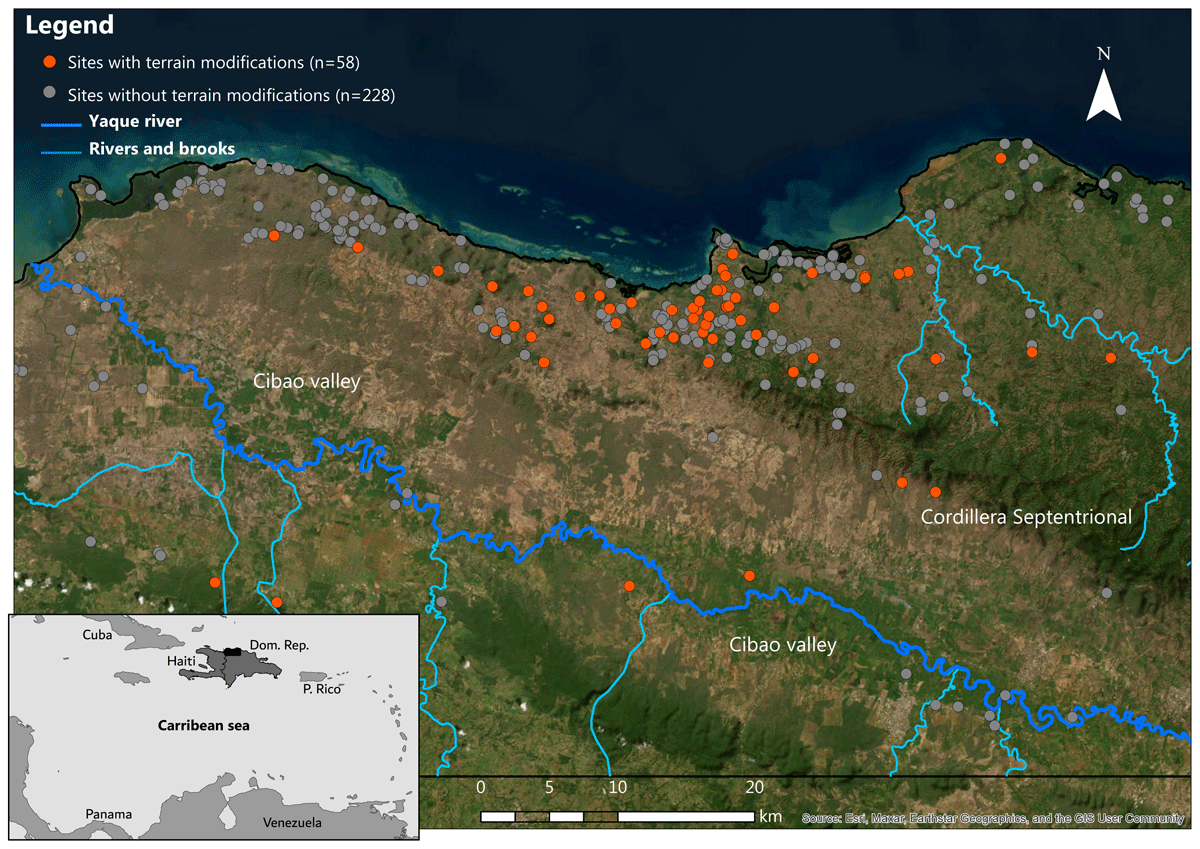
Figure 1
Archaeological site distribution in the north-western Dominican Republic (map by Eduardo Herrera Malatesta).
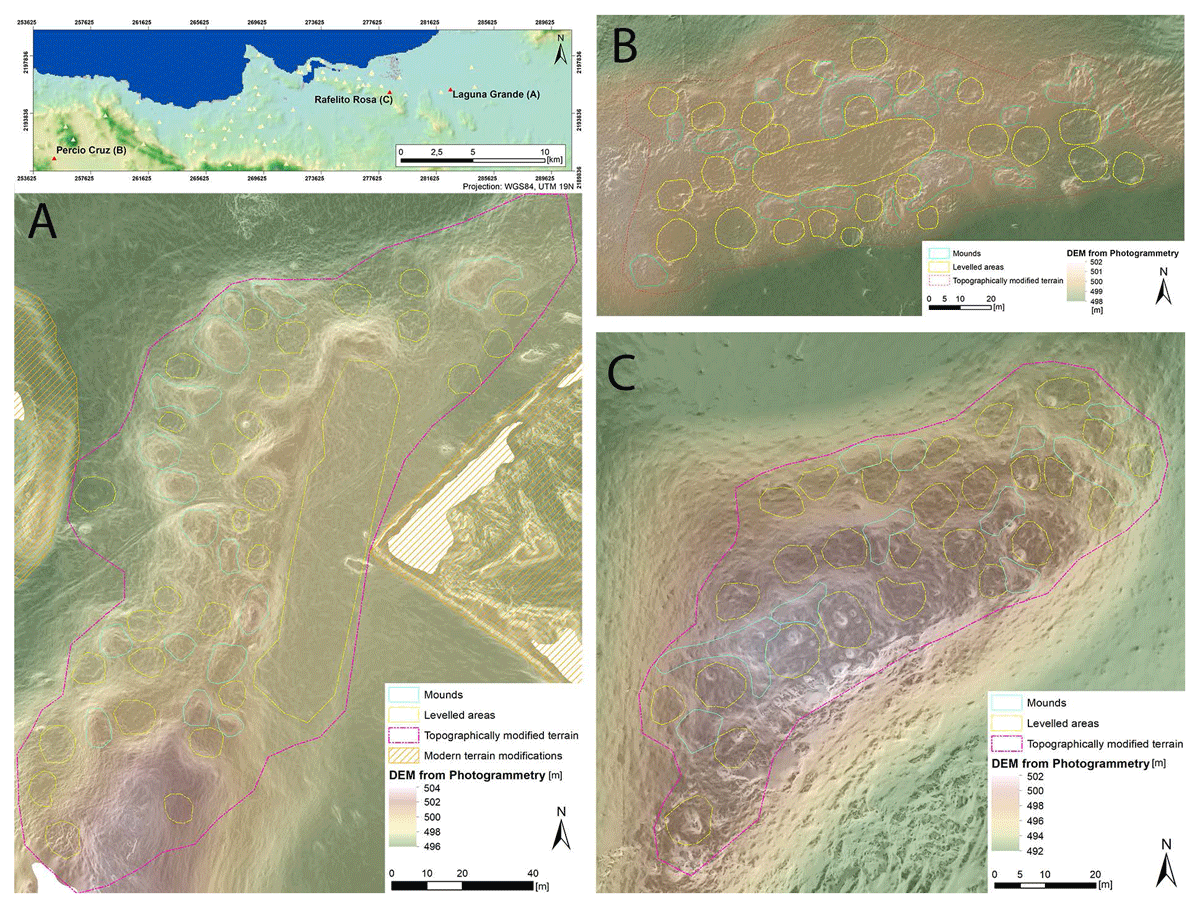
Figure 2
Three topographically modified settlement sites from the survey region. The topography was recorded from drone imagery and a 3D model produced by photogrammetry. Each site is visualized by DEM (50% visibility), over slope (50% visibility), and over a hillshade visualization. Based on a visual analysis the mounds and levelled areas were drawn by hand (models created by Till Sonnemann).
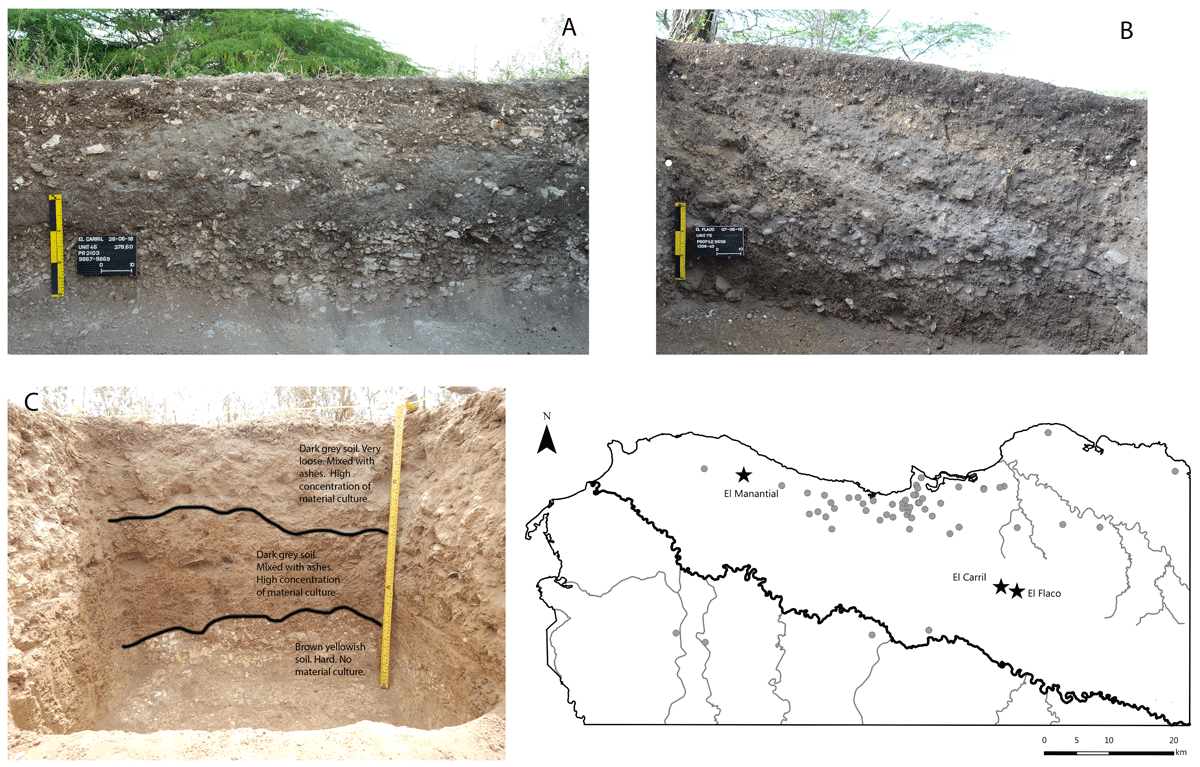
Figure 3
Stratigraphy of mound units at four sites with alternating layers and lenses of ash and soil. A) El Carril, B) El Flaco, C) El Manantial (photographs A & B by Menno Hoogland, C by Eduardo Herrera Malatesta).
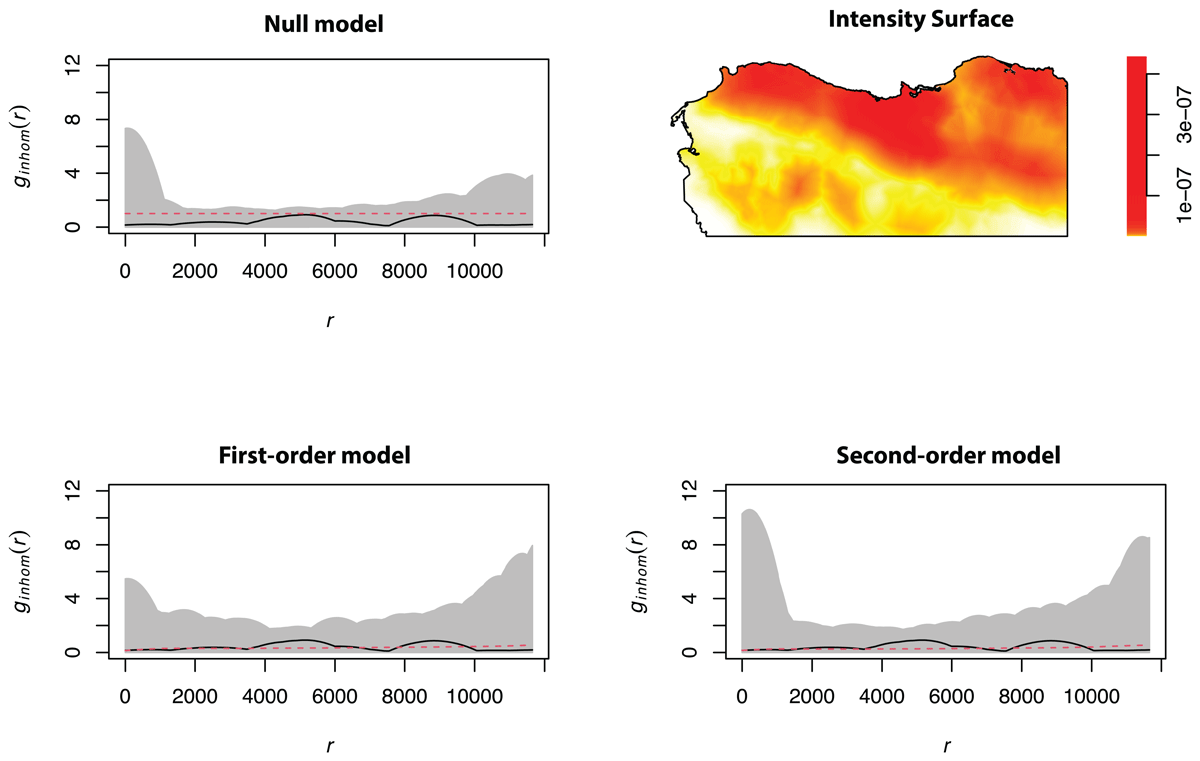
Figure 4
Results of point process modelling for sites with terrain modifications. Null: The pair correlation function estimated on an assumption of complete spatial randomness. Intensity surface: the predicted intensity surface created from the first-order fit. First-order: the pair correlation function with a critical envelope conditioned on the covariate data as first-order variables. Second-order: incorporating a point interaction term in the first-order model, accounting for all spatial variability.
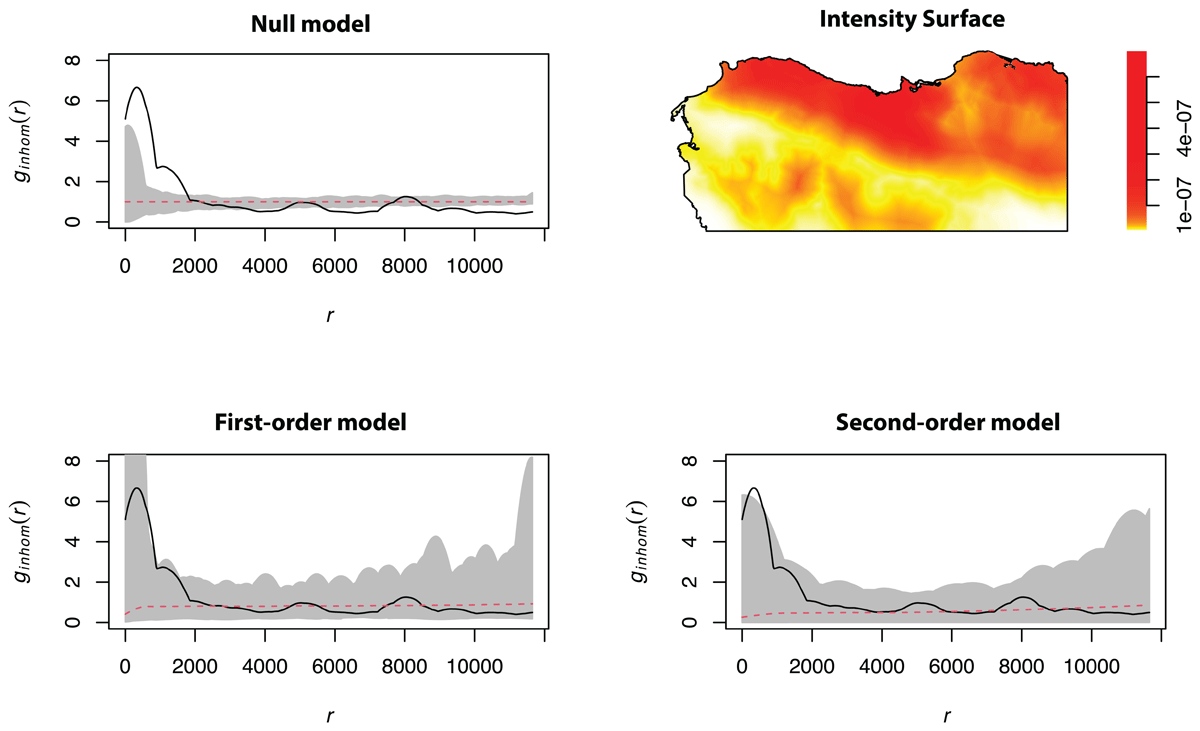
Figure 5
Results of point process modelling for sites without terrain modifications. Null: The pair correlation function estimated on an assumption of complete spatial randomness. Intensity surface: the predicted intensity surface created from the first-order fit. First-order: the pair correlation function with a critical envelope conditioned on the covariate data as first-order variables. Second-order: incorporating a point interaction term in the first-order model, accounting for all spatial variability.
Table 1
Fitted covariate datasets for the first-order model, sites with terrain modifications.
| COVARIATES | ESTIMATE | STD. ERROR | Z VALUE | SIGNIFICANT |
|---|---|---|---|---|
| (Intercept) | –1.7504450 | 4.7434160 | –36.902629 | *** |
| Alluvium | 0,0001872681 | 0,00003771534 | 4.965303 | *** |
| Hills and Plateaus | –0,0002048970 | 0,00004904832 | –4.177451 | *** |
| Mountainous areas | –0,0001380711 | 0,00003149600 | –4.383766 | *** |
| Arable soils | –0,0001164922 | 0,00003183083 | –3.659729 | *** |
Table 2
Fitted covariate datasets for the first-order model, sites without terrain modifications.
| COVARIATES | ESTIMATE | STD. ERROR | Z VALUE | SIGNIFICANT |
|---|---|---|---|---|
| (Intercept) | –1.6048930 | 2.0523640 | –78.1972737 | *** |
| Alluvium | 0,0001314754 | 0,00001791114 | 7.3404269 | *** |
| Hills and Plateaus | –0,0001393845 | 0,00002166846 | –6.4325969 | *** |
| Mountainous areas | –0,00006091828 | 0,00001397768 | –4.3582533 | *** |
| Arable soils | –0,00001786111 | 0,00003669478 | –0.4867479 | *** |