
1. Introduction
During several field campaigns between 2007 and 2018 in the northern region of the Dominican Republic, we were able to register and revisit more than 300 archaeological sites showing a wide range of cultural contexts (Hofman et al., 2018; Ulloa Hung and Herrera Malatesta, 2015; De Ruiter, 2012; Ulloa Hung, 2014; Herrera Malatesta, 2018). While several of these sites were identified through the scattering of surface material culture, others show terrain modifications in the form of anthropogenic mounds and levelled areas. Their anthropogenic nature was identified by either studying looter pits in already damaged mounds, revealing their stratigraphy, or by performing test pits and/or small excavations combined with large-scale excavations on a small number of sites (Ulloa Hung, 2014; Herrera Malatesta, 2018; Hofman et al., 2020; Hofman and Hoogland, 2015). In addition, UAV photogrammetry was used to study the intrasite topographic structure of a sample of sites with terrain modifications (Sonnemann, Herrera Malatesta and Hofman, 2016; Sonnemann, Ulloa Hung and Hofman, 2016). From the resulting digital terrain models (DTM) and the excavations, we observed that artificial mounds were spatially associated with levelled areas in all cases. From small- and large-scale excavations on the levelled areas of different sites, we identified patterns of postholes. Our current hypothesis is that these areas were purposely levelled out by the Indigenous people to provide even ground for settlement structures (Hofman and Hoogland, 2015). The soil from the areas was swept aside and together with the accumulated dirt from domestic and planting activities began to form mounds next to the houses. Such mounds could reach up to three meters in height and twelve meters in diameter, and in some cases also served as burial locations (Pagán-Jiménez et al., 2020; van Dijk, 2019; Sonnemann, Ulloa Hung and Hofman, 2016; Hofman and Hoogland, 2015). Furthermore, we were able to perform palaeoecological analysis at two of the excavated sites, as well as at key places along one of the major rivers, the Yaque, that has provided fundamental information about the human impact on the surrounding environment (Castilla-Beltrán et al., 2018; Castilla-Beltrán et al., 2020). The recent identification of some of the crops that were cultivated on the mounds and/or eaten by the Indigenous people on the site further contextualized this environmental setting (Pagán-Jiménez et al., 2020). These studies highlight that the Indigenous people were active agents in modifying their surroundings to establish a variety of settlements.
Furthermore, the terrain modifications had a wide range of functions for the Indigenous people, from small-scale agriculture, and dumping of garbage, to ritual activities (Pagán-Jiménez et al., 2020; van Dijk, 2019; Herrera Malatesta, 2018; Hofman et al., 2018; Hofman et al., 2020). However, owing to limited resources and time, work has been concentrated on a selection of archaeological sites. As a result, most archaeological sites with terrain modifications have not been extensively excavated. Based on the available data and field observations, we know that mounds usually occur on the foothills and hills of the Cordillera Septentrional. Although there are a few sites on the Yaque river valley that also contain mounds, these do not present recognizable levelled areas. As the valley is a floodplain of the Yaque river, its soils are quite fertile, more so than those of the Cordillera Septentrional. This difference between sites with terrain modifications in the hills and the valley brings up the main aim of this paper of exploring the relationship between the archaeological sites with and without terrain modifications and the environmental setting and assessing if the environmental setting had an influence on the location of these terrain modifications.
2. Archaeological background
The recently available regional archaeological database has permitted a more comprehensive exploration of how Indigenous people inhabited, used, and transformed this landscape (Hofman et al., 2018). In particular, it allows the discernment of multiscalar regional patterns. Broadly said, the settlement pattern in the study region, i.e., the Puerto Plata, Valverde and Montecristi provinces, shows a wide range of archaeological sites located in different environmental and topographical settings, with a potential tendency towards the coast (Figure 1). Based on their archaeological contexts and the number of materials distributed on the surface, these sites were grouped into size categories. The size division was done using Jenks Optimization, which is a statistical method that attempts to find clusters in the data. To do this, it determines the ‘natural breaks’ in a dataset by minimizing the sum of the squared deviations from class means, in this case, the sites’ area sizes in square meters (Conolly and Lake, 2006, p. 142). Four size categories were defined. First, the small sites (≤10,000 m2), have a low diversity of material remains, consisting of undecorated ceramics, few stone tools, usually axes and/or hammerstones, and scarce mollusk shells. Second, the medium-sized sites (10,001–30,000 m2) tend to be more complex, presenting a wider range of material culture, consisting of undecorated and decorated ceramics, a variety of stone and shell tools, and more evidence of marine food resources, e.g., various types of mollusk shells and fish remains. Third, large sites (30,001–60,000 m2), have characteristics like those of medium-sized sites but tend to have more diverse and abundant material culture and other remains. Finally, the very large sites (60,001–140,000 m2) present a material culture pattern like that of large sites, but their spatial distribution covers a larger area.
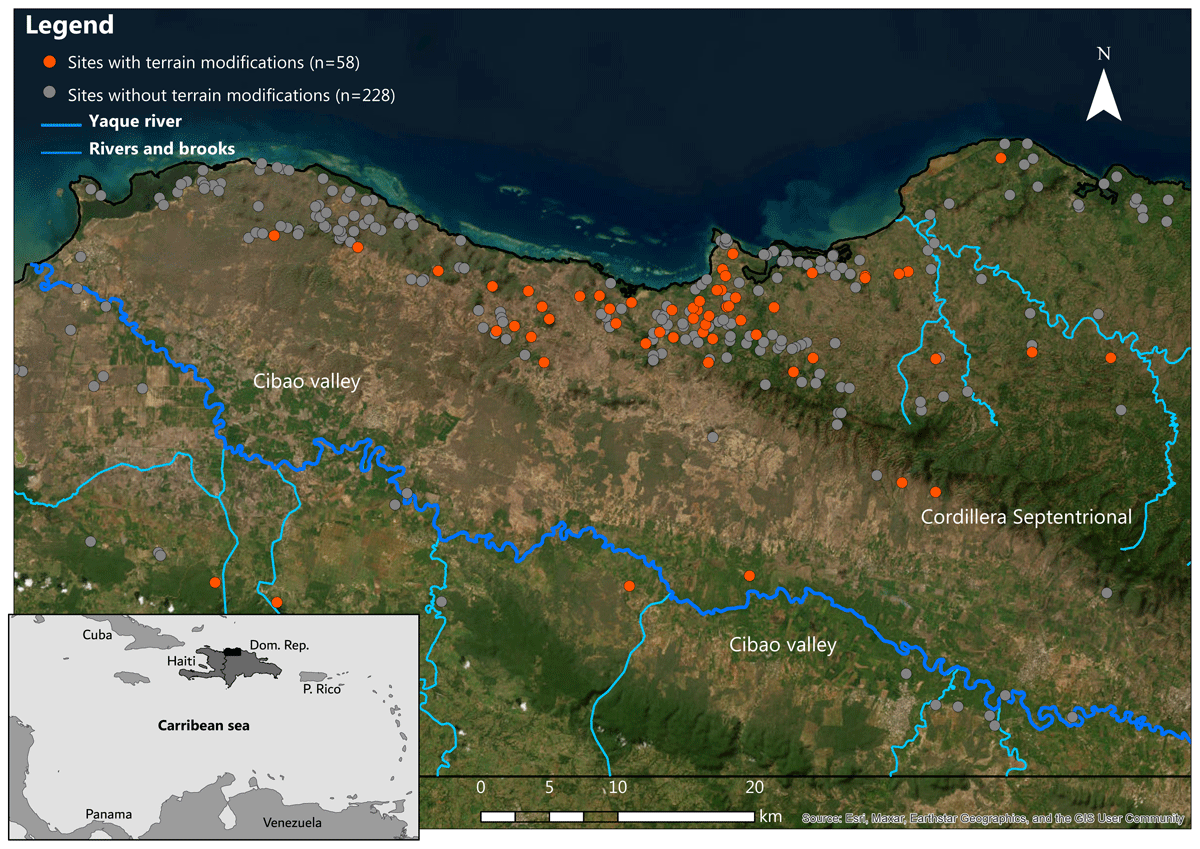
Figure 1
Archaeological site distribution in the north-western Dominican Republic (map by Eduardo Herrera Malatesta).
Archaeological sites with anthropogenic mounds and levelled areas show an arrangement where two or more mounds that have either a circular, oval, or “U” shape, are located around the levelled areas. In some cases, the levelled area is located between mounds or in the middle of the “U” shape (Figure 2). The registered mounds on the foothills and/or hilltops of the Cordillera Septentrional have diameters ranging from 3 m to 12 m and do not exceed 3 m in height (De Ruiter, 2012; Sonnemann, Ulloa Hung and Hofman, 2016; Hofman et al., 2020; Herrera Malatesta, 2018; Hofman and Hoogland, 2015; Ulloa Hung, 2014). At some sites, the topography has been greatly affected by human or environmental influences, which complicates the identification of mounds and levelled areas. The levelled areas between the mounds usually have a circular shape and an area between 40 and 200 m2. Their extent also depends on the size of the settlement: investigated larger sites, featuring more and bigger mounds tend to also have larger levelled areas (Hofman et al., 2020; Sonnemann, Ulloa Hung and Hofman, 2016). Several of the excavated sites, e.g., El Flaco, El Carril, and El Manantial, featured levelled areas, or areas in between mounds, with postholes and other cultural features, which confirmed the existence of settlement structures (Figure 3), possibly the houses of the Indigenous inhabitants (Hofman et al., 2018; Herrera Malatesta, 2018). The mounds are composed of layers of brown and dark brown soil, ash lenses and refuse, which alternate with layers of white soil removed from the surrounding area to create levelled areas for various settlement structures (Hofman, 2017). The layers of dark brown soil suggest that during certain periods of occupation, the mounds may have been used as ‘kitchen gardens’, i.e. small household gardens (Pagán-Jiménez et al., 2020). Additionally, the presence of human and animal burials in some of the mounds also indicates their possible use as ritual areas (Hofman and Hoogland, 2015; Hofman, Ulloa Hung and Hoogland, 2016; Hofman et al., 2020). Finally, during the large-scale excavations at the site of El Flaco, we identified a small number of mounds that were not the result of human intervention but of the natural topography of the karstic terrain (Hofman and Hoogland, 2015). Yet, we have not observed this at the (also extensively investigated) site of El Carril, or in any other excavated site in the region (Hofman et al., 2020; Herrera Malatesta, 2018). The excavations of these sites increased our comprehension of their general chronology, covering between 800 and 1500 CE, and provided a better context for the ceramic repertoire of the three main ceramic groups present in the region, i.e. Ostionoid (600–1200 CE), Meillacoid (800–1550 CE), and Chicoid (900–1700 CE) (Keegan and Hofman, 2017). This new evidence on the relationship between sites with terrain modifications and the environment, including their topographic location strongly highlights the need to study and understand the regional pattern of archaeological sites with terrain modifications.

Figure 2
Three topographically modified settlement sites from the survey region. The topography was recorded from drone imagery and a 3D model produced by photogrammetry. Each site is visualized by DEM (50% visibility), over slope (50% visibility), and over a hillshade visualization. Based on a visual analysis the mounds and levelled areas were drawn by hand (models created by Till Sonnemann).

Figure 3
Stratigraphy of mound units at four sites with alternating layers and lenses of ash and soil. A) El Carril, B) El Flaco, C) El Manantial (photographs A & B by Menno Hoogland, C by Eduardo Herrera Malatesta).
3. Material and methods
3.1. Archaeological data
The focal region encompasses geopolitically the modern provinces of Montecristi, Puerto Plata, and Valverde in the Dominican Republic and topographically the northern coastal strip, Cordillera Septentrional and the Cibao valley, which includes the Yaque river (Figure 1). The database results from a compilation of regional archaeological surveys carried out in this region since 2007 (Ulloa Hung, 2014; Ulloa Hung and Herrera Malatesta, 2015; Herrera Malatesta, 2018; Herrera Malatesta and Hofman, 2019). Several factors, from environmental (dense thorny bushland, marshes) to topographical (steep valleys and mountains) hindered a systematic survey approach for the great extent of the study region. Therefore, sites were primarily recorded using an opportunistic survey methodology (Orton, 2000), which involved intense ethnographical work with local communities and collaborations with local guides to locate archaeological sites. Alternatively, some sites were registered by implementing predictive modelling methods that determined areas with a high probability of archaeological evidence (Herrera Malatesta, 2017). For the present study, 285 of the more than 300 analyzed archaeological sites were used, the remaining ones being unsuitable for a variety of reasons, e.g., the total or partial alteration of the site; dense vegetation that prevented full recording of evidence on the ground, or sites in caves or rock shelters. Of the 285, less than 5% were previously registered by Dominican researchers (Ortega, 2005; Veloz Maggiolo and Ortega, 1980). The database contains information regarding the location of sites, their associated material culture, functionality, the size of the site, and the presence/absence of mounds. Since the database is composed of surface finds, its structure is mostly in a binary format of presence/absence of material evidence. For the spatial statistical analysis, the dataset of archaeological sites was divided into two groups. One contains the archaeological sites with terrain modifications (n = 58) and the other one, the archaeological sites without terrain modifications (n = 227). The dataset used for this paper is open access (Herrera Malatesta and Hofman, 2019).
3.2. Environmental data
The related environmental data consist of modern records compiled in two atlases published by the Environmental Ministry of the Dominican Republic (Moya Pons, 2004; MMARN, 2012). Considering the available archaeological and palaeobotanical data from the sites with terrain modifications, the focus was on exploring a group of environmental variables that have already been identified as having some sort of relationship with the archaeological distribution of sites with and without terrain modifications. The selected variables are related to the geomorphology and soil quality of the region. To facilitate locating them in the Atlas, we decided to use an English translation of their original Spanish names. From the geomorphology, the covariates are (i) alluvium, (ii) hills and plateaus, and (iii) mountainous areas. The alluvium variable was chosen because it represents an area in the valley where some important sites with terrain modification have been registered. The area itself is close to the major rivers in the study region, and the land on and near the alluvium is highly arable and fertile soil. The second and third variables were selected because several sites with and without terrain modifications are located in the low-relief hills of the Cordillera Septentrional and the more mountainous areas. From the quality of soils, the covariates are: (i) arable soils and (ii) soils suitable for forests, pastures and mountain crops. These two variables were selected to test if the location of the archaeological sites with and without terrain modifications are being affected by the presence of arable soils in the valley and the low relief hills and/or the suitable areas for crops located in the mountains. To prepare these covariates for the spatial statistical analysis, a Euclidian distance map was calculated for each variable using ESRI ArcGIS 10.7. Since the vectors created from the environmental variables are based on copyrighted materials, though allowed to be replicated and used for the purposes of the research study, it is not possible to share the digital data. Nonetheless, all data can be accessed in paper form in the mentioned publications.
3.3. Methods
To study the spatial relationships of the Indigenous settlement patterns, we focused on applying Point Pattern Analysis, which is simply defined as the study of the spatial arrangement of points in space (Riris, 2020; Costanzo et al., 2021; Carrero-Pazos, Bevan and Lake, 2019). When the intensity of the point pattern is constant, i.e., corresponding to a stationary and isotropic process within the region, it is called a Homogeneous Poisson Process (HPP). Alternatively, when the intensity is not spatially uniform it is called Inhomogeneous Poisson Process (IPP). If evidence indicates that a regional pattern can be the result of an IPP, it is relevant to assess whether the intensity of the events depends on the influence of spatial variables (the covariates) and, if so, it becomes necessary to quantify this dependence. In spatial statistics, this is referred to as the intensity of the pattern depending on First-order effects. However, when the intensity of the point pattern is the result of the points showing independence or rejection from each other, then the point pattern is the result of Second-order effects (Baddeley, Rubak and Turner, 2016; Diggle, 2013). Based on this framework and the archaeological background of this region, this paper aims to determine the impact of the regional environmental setting on the distribution of archaeological sites with and without terrain modifications. For this, we defined two complimentary null hypotheses:
H1 the intensity of the point pattern of archaeological sites with and without terrain modifications is uniform, i.e., it is stationary and isotropic. The environmental variables (covariates) do not affect the spatial distribution of the points.
H2 the archaeological sites with and without terrain modifications are completely independent of each other, and they do not show any spatial correlation.
3.4. Fitting covariate spatial data
To statistically address these two hypotheses, the point process intensity was explored by applying parametric methods that explore the degree to which the covariates affect the distribution of archaeological sites. The first step to fit the covariates was to test the presence of multicollinearity using Pearson’s R, to assess if each variable can be used as an independent model for further analysis. This test showed that there are no collinear effects among the five considered variables. Then, the observed point pattern of archaeological sites with and without terrain modifications was fitted to a Poisson point process model, equivalent to an initial null hypothesis of complete spatial randomness (CSR). For this, the Bayesian Information Criterion (BIC) was used as a guideline for information gain per model. The stepwise model selection procedure rejected the same covariate for the two groups of sites, i.e., soils suitable for forests, pastures and mountain crops. The resulting four covariates for each group of archaeological sites, and the assumed Poisson process, comprise the multivariate first-order model. The spatial intensity (density) of the archaeological sites with and without terrain modifications in this region as described by the interaction of these parameters, is a function of their combined maximum logistic likelihood (Baddeley and Turner, 2000). Next, to assess the possible effects of interaction between the sites with and without terrain modifications at a landscape level, a second-order test was incorporated into the fitted first-order model to generate a combined model. This model statistically accounted for induced and internal spatial dynamics simultaneously. For this, a Strauss point process model was advanced to replace CSR as the null model and to obtain the range of observed variability in the empirical point pattern (Kelly and Ripley, 1976). Although there are other alternatives such as Poisson, Area Interaction or Multiscale Geyer Process (Baddeley and Turner, 2005; Riris, 2020), the selected function provided clearer results to understand the distribution of sites with and without terrain modifications in this region.
After fitting the covariates and the archaeological site distribution, the resulting models were tested by a goodness-of-fit for each of the six models (‘null’, ‘first-’, and ‘second-order’ for the sites with and without terrain modifications), comparatively employing a pair correlation function (PCF). This method provides an estimation of the degree of spatial clustering and regularity of the spatial pattern at multiples scales within a window of observations (Baddeley, Rubak and Turner, 2016). Other common methods to test second-order effects are the Ripley’s K and L functions (Ripley, 1977; Orton, 2004; Bevan and Conolly, 2006; Bivand, Pebesma and Gómez-Rubio, 2008; Vanzetti et al., 2010; Bevan et al., 2013), which analyses point patterns at different scale ranges. However, considering the characteristics of the available data and the hypothesis to be tested, PCF was a more adequate method. This is because, contrary to the K and L functions, PCF measures the intensity of pair points in doughnut-shaped rings from and around each point (Baddeley, Rubak and Turner, 2016) in a non-cumulative matter, allowing an improved measure for spatial association at different scales. PCF quantifies how each point in the dataset is surrounded by other points, and therefore the resulting value will present the variation of site density across the study region. This allows a better differentiation of patterns at different scales.
To illustrate the critical scales where sites with and without terrain modifications attract or reject one another, a significance envelope was computed via Monte Carlo simulations from the ‘null’, ‘first-’, and ‘second-order’ models. The envelopes were generated by simulating 999 point patterns for each calculation of the PCF to the six fitted models (Baddeley and Turner, 2005). Rather than expressing confidence intervals at a level of 95%, these envelopes estimated acceptance intervals (or non-rejection intervals), which are the likelihood of incorrectly rejecting the null hypothesis of no spatial structure as a function of the number of simulated runs. For the envelopes generated here, the value of α corresponded to 0.002, which is highly robust. The workflow for fitting and testing the models was fully implemented as R code, and it is available in the supplementary information. It was based on the codes of Bevan et al. (2013) and Riris (2020), and it draws on functions from several R packages, such as ‘sp’, ‘rgdal’, ‘raster’, ‘MASS’, ‘maptools’, ‘dismo’, ‘DAAG’ and ‘spatstat’ (Pebesma and Bivand, 2005; Maindonald and Braun, 2010; Baddeley and Turner, 2005; Bivand, 2022; Bivand et al., 2022; Ripley et al., 2022; Hijmans, 2021; Hijmans et al., 2022).
4. Spatial point process modelling
4.1. Null model
All spatial statistical processes begin with the assumption that point patterns are distributed in space stochastically (Illian et al., 2008), and this random pattern is called Complete Spatial Randomness (CSR). When a point pattern is defined by a stochastic process, it is said to have a Poisson process that affects the distribution, i.e., that the events occur continuously and independently from each other. For the two sets of archaeological sites used in this study, their spatial structure was illustrated by the initial application of the PCF (Figures 4 and 5, top left). Figure 4 (top left) shows that the archaeological distribution of sites with terrain modifications shows a pattern of repulsion at all spatial scales. The red dotted line (equal to 1) marks the value of CSR, all values above this line represent a cluster point pattern and all below a regular point pattern. The grey area indicates the Monte Carlo simulation threshold (Baddeley, Rubak and Turner, 2016).
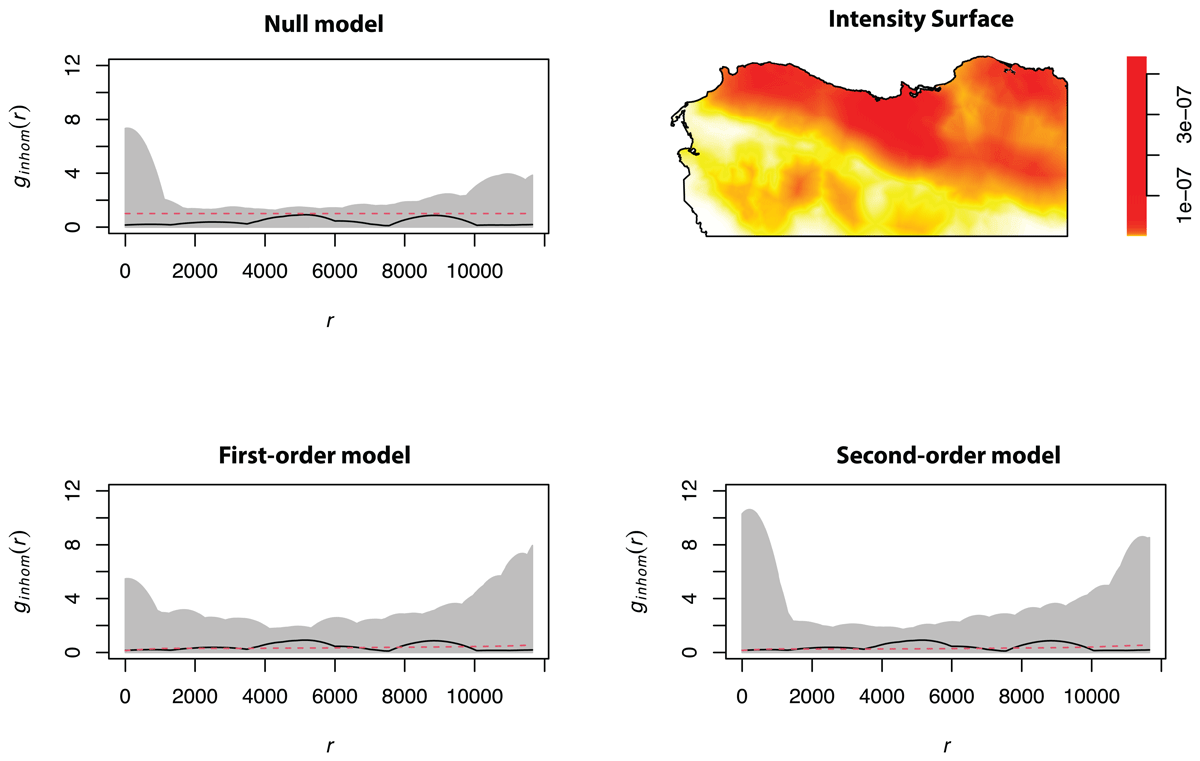
Figure 4
Results of point process modelling for sites with terrain modifications. Null: The pair correlation function estimated on an assumption of complete spatial randomness. Intensity surface: the predicted intensity surface created from the first-order fit. First-order: the pair correlation function with a critical envelope conditioned on the covariate data as first-order variables. Second-order: incorporating a point interaction term in the first-order model, accounting for all spatial variability.

Figure 5
Results of point process modelling for sites without terrain modifications. Null: The pair correlation function estimated on an assumption of complete spatial randomness. Intensity surface: the predicted intensity surface created from the first-order fit. First-order: the pair correlation function with a critical envelope conditioned on the covariate data as first-order variables. Second-order: incorporating a point interaction term in the first-order model, accounting for all spatial variability.
For the sites without terrain modifications (Figure 5, top left) the first maximum and minimum values outside the simulation envelope mark the range at which points are most strongly attracted or repelled by each other. For the study region, there is a peak cluster of sites without terrain modifications at around 500 m distance from each other that decreases over space to reach a maximum point of rejection, i.e., a regular pattern, at around 4000 m. This initial pattern implies that a variety of spatial processes may be affecting the distribution suggesting a strong range clustering up to 2000 m and a weaker longer-range repulsion between sites without terrain modifications from 4000 m up to 10000 m. Yet, the results for the two groups of sites are not conclusive and are just a baseline for further explorations. This baseline assessment lacks sufficient context to properly explore the implications of these results, and therefore the analysis turns to the assessment of the fitted covariate data and point process models.
4.2. First-order model
The first-order model (Figures 4 and 5, bottom left) presents a more interesting fit over the CSR null model. For the sites with terrain modifications, this model (Figure 4, bottom left) controls all the signals of spatial autocorrelation at all ranges within the spatial frame. Of the five tested covariates, four showed highly significant correlations (Table 1). Interestingly, when the covariates are included, the pattern shows two clusters of sites, one in the range of 3800 m and 6000 m and another at 7800 m and 9500 m, approximately. Before the first cluster, the pattern shows CSR; after the first and second clusters, there is repulsion among the sites. The intensity surface (log-odds of points per unit of area) from this model (Figure 4, top right) offers a visual summary of the degree to which this model explains the spatial structure of sites with terrain modifications. The pattern is inhomogeneous, this is spatially variable along the study region, and the predicted spatial trend is strong, with several zones highlighting values at the high end of the scale. Together with the results of the pair correlation functions, the fitted first-order model suggests that there is spatial variation within this pattern.
Table 1
Fitted covariate datasets for the first-order model, sites with terrain modifications.
| COVARIATES | ESTIMATE | STD. ERROR | Z VALUE | SIGNIFICANT |
|---|---|---|---|---|
| (Intercept) | –1.7504450 | 4.7434160 | –36.902629 | *** |
| Alluvium | 0,0001872681 | 0,00003771534 | 4.965303 | *** |
| Hills and Plateaus | –0,0002048970 | 0,00004904832 | –4.177451 | *** |
| Mountainous areas | –0,0001380711 | 0,00003149600 | –4.383766 | *** |
| Arable soils | –0,0001164922 | 0,00003183083 | –3.659729 | *** |
For the sites without terrain modifications, of the five tested covariates, four showed highly significant correlations (Table 2). The covariate presence provides an improved fit compared to the CSR null model, controlling most of the signals of spatial autocorrelation. In this iteration, the strong pattern of short-range clustering and long-range repulsion remains. However, a small new cluster appears at a range of 4800 m and 5800 m, approximately. As with the previous group of sites, the intensity surface (Figure 5, top right) provides a clear view of the degree to which this model explains the spatial structure of sites without terrain modifications. Again, the inhomogeneous pattern shows spatial variability in the study region, and the strong predicted spatial trend illustrates several zones with values at the high end of the scale. Together with the results of the pair correlation functions, the fitted first-order model suggests that there is spatial variation within this pattern.
Table 2
Fitted covariate datasets for the first-order model, sites without terrain modifications.
| COVARIATES | ESTIMATE | STD. ERROR | Z VALUE | SIGNIFICANT |
|---|---|---|---|---|
| (Intercept) | –1.6048930 | 2.0523640 | –78.1972737 | *** |
| Alluvium | 0,0001314754 | 0,00001791114 | 7.3404269 | *** |
| Hills and Plateaus | –0,0001393845 | 0,00002166846 | –6.4325969 | *** |
| Mountainous areas | –0,00006091828 | 0,00001397768 | –4.3582533 | *** |
| Arable soils | –0,00001786111 | 0,00003669478 | –0.4867479 | *** |
4.3. Second-order model
The second-order model was created by fitting a nonstationary Strauss process by maximizing the profile information entropy with respect to a series of fixed spatial interaction distances (Baddeley, Rubak and Turner, 2016). For the sites with terrain modifications, the analysis was permuted in 100-meter intervals from 100 m to 2500 m to produce 25 candidate models. According to Akaike’s Information Criterion (AIC), this procedure provides the best fit for the area interaction parameter at r = 2500 m. In this case, the AIC was used instead of the BIC, as while BIC is better at selecting the true model than AIC, the latter is optimal for estimating the regression function (Yang, 2005). The second model also incorporates the first-order model as a trend parameter. For the sites without terrain modifications, the analysis was permuted in 250-metre intervals from 250 m to 6500 m to produce 25 candidate models. In this case, Akaike’s Information Criterion indicated that the best fit for this group of sites in the area interaction parameter is at r = 750 m. This combined first- and second-order model successfully controls for both exogenous and endogenous processes within the point pattern of archaeological sites with and without terrain modifications. Conditioning the simulation envelope for the pair correlation function on the combined null model (Figures 4 and 5, bottom right) illustrates the effect of incorporating between-point interaction.
For the sites with terrain modifications (Figure 4, bottom right), the results indicate that most of the variability in the spatial structure can be explained by controlling the second-order factors. Like with the first-order trend, the second-order trend affects the site patterning, as both models show clustering at 3800 m to 6000 m and 7800 m to 9800 m, approximately. For the sites without terrain modifications, a more interesting picture is presented by the results of the second-order trend (Figure 5, bottom right). The second-order model emphasizes the presence of the second and third clusters, which are smaller in the first-order trend and almost non-existent with the null model. This represents a greater influence of the second-order trend within this distribution. While other analyses with a better goodness-of-fit could be done to further untangle the relationship between the influences of first and second-order effects in the site pattern, the results are satisfactory as they present an explanation of the landscape-level archaeological distribution of the sites with terrain modifications. Among the results of the two groups of sites, a noticeable exception not accounted for by the second-order model is a short-distance statistically significant clustering of sites without terrain modifications in a range of 500 m and 800 m. This indicates a relevant spatial threshold for the sites without terrain modifications, which could help with the understanding of the distributional pattern of this type of site within the region.
5. Discussion
This paper has applied advanced spatial statistical methods to study a regional archaeological dataset in the northwestern Dominican Republic to augment the understanding of past Indigenous regional settlement patterns. It demonstrated the analytical possibilities of using spatial statistics for non-systematic regional survey data. As verified in other regions, applying spatial statistical methods in correlation with environmental and cultural variables proved to be a valuable tool to understand regional patterns (Riris, 2020; Bevan et al., 2013), complementing previous site-based research in the region. The performed analysis proves the importance of comparing archaeological data to known environmental variables to explore their correlation on a large scale. The analyses have also proven that further tests must be done to continue looking for explanations on the cultural reasons behind the location of settlements and the construction of mounds and levelled areas in the region. Nonetheless, the methods presented here provided a robust and rigorous starting point for future regional and landscape research in the region.
The results provided two main takeaways. First, both sets of archaeological sites presented the same positive and negative correlations with the same variables (Tables 1 and 2). In archaeological terms, this could mean that, on the one hand, these variables do not explain the variability of archaeological sites as expected. On the other hand, it could mean that, contrary to expectations, in terms of the regional pattern there is no difference between the sites with and without terrain modifications and the presence or absence of these environmental variables. This means that the potential reasoning behind the location of the sites and the eventual construction of levelled areas and mounds was similar and not led by certain environmental variables. The results indicated that both sets of sites have a positive correlation with the alluvium variable, which is physically located in the Cibao valley, running along the Yaque river. This implies that, contrary to the visual assessment that the sites are clustered towards the coast, the statistical results suggest that the regional pattern tends to be towards the valley, the major water sources, and the high-productivity soils. Along the same line, the negative correlation with the other three variables does not negate the presence of archaeological sites in the same spatial areas, just that the regional pattern shows a tendency of rejection towards those variables.
Secondly, the analysis provided valuable information regarding the structures of the regional patterns concerning the three models. For the two sets of archaeological sites, there were clear differences between the null model and the first and second-order trends. For the sites with terrain modifications, the null model presented an image of a regular regional pattern with no insights into the decision of locating sites. For the sites without terrain modifications, the null model showed a significant cluster at distances <2000 m, and significant regular patterns at 4000, 6–7000, and above 9000 m, approximately. Yet, when the environmental variables were considered, patterns of clustered sites appeared at different spatial scales for both sets of archaeological sites. This indicates that the regional site distribution could be influenced by the environmental setting. Furthermore, when the pattern was fitted against the second-order trend, the clusters were even more clear. These results indicate that, as Riris (2020) proposed, regional spatial palimpsests cannot be explained by fixed-scale summary statistics under a null assumption of spatial homogeneity. They also show that the regional archaeological pattern is affected by exogenous factors that influence the locations of points at different spatial scales, yet the cluster pattern becomes clearer and more significant when the intrinsic properties of the point pattern are considered. With these results, the two null hypotheses are rejected, as there was evidence that the environmental variables (covariates) do affect the spatial distribution of the points, and the archaeological sites with and without terrain modifications do show a spatial correlation.
Past Indigenous peoples took advantage of the topographical conditions in and around their settlements to remodel the landscape to their needs, and the terrain modifications are evidence of this. They transformed the surroundings with new topographies. The results emphasize the complexity and multiscalar conditions between the archaeological sites and environmental context. This gives way to a debate on how past Indigenous peoples interacted with their environment and created this complex landscape, where specific cultural features correlate with environmental conditions at different spatial scales.
Data Accessibility Statement
The Montecristi data used in this research is open access at the DANS EASY repository https://doi.org/10.17026/dans-xyn-cu72. The rest of the data will be also deposited in DANS later this year. Supplementary materials of this article can be found online on the Open Science Framework at https://doi.org/10.17605/OSF.IO/WUBA7.
Acknowledgements
Many thanks go out to the communities in the northern Dominican Republic for their collaboration during our research. The Ministerio de Cultura and the Museo del Hombre Dominicano are acknowledged for providing us with permissions and research authorization in the country, as well as the Servicio Geológico Nacional and the Ministerio de Ambiente for providing environmental and geopolitical digital data of the country.
Funding Information
This research has received funding from the European Research Council under the European Union’s Seventh Framework Programme (FP7/2007–2013)/ERC grant agreement n° 319209. Supplementary funds for the realization and publishing of this paper came from Horizon Europe, HORIZON-MSCA-2021-PF-01-01, Marie Skłodowska Curie Action, Grant agreement n° 101062882.
Competing Interests
The authors have no competing interests to declare.
Author contributions
EHM conceptualized and designed the study, wrote the main text, executed the analyses, and created most figures. JUH and CLH contribute to the paper’s ideas, wrote specific sections, contribute to the figures, and provided unpublished data.