
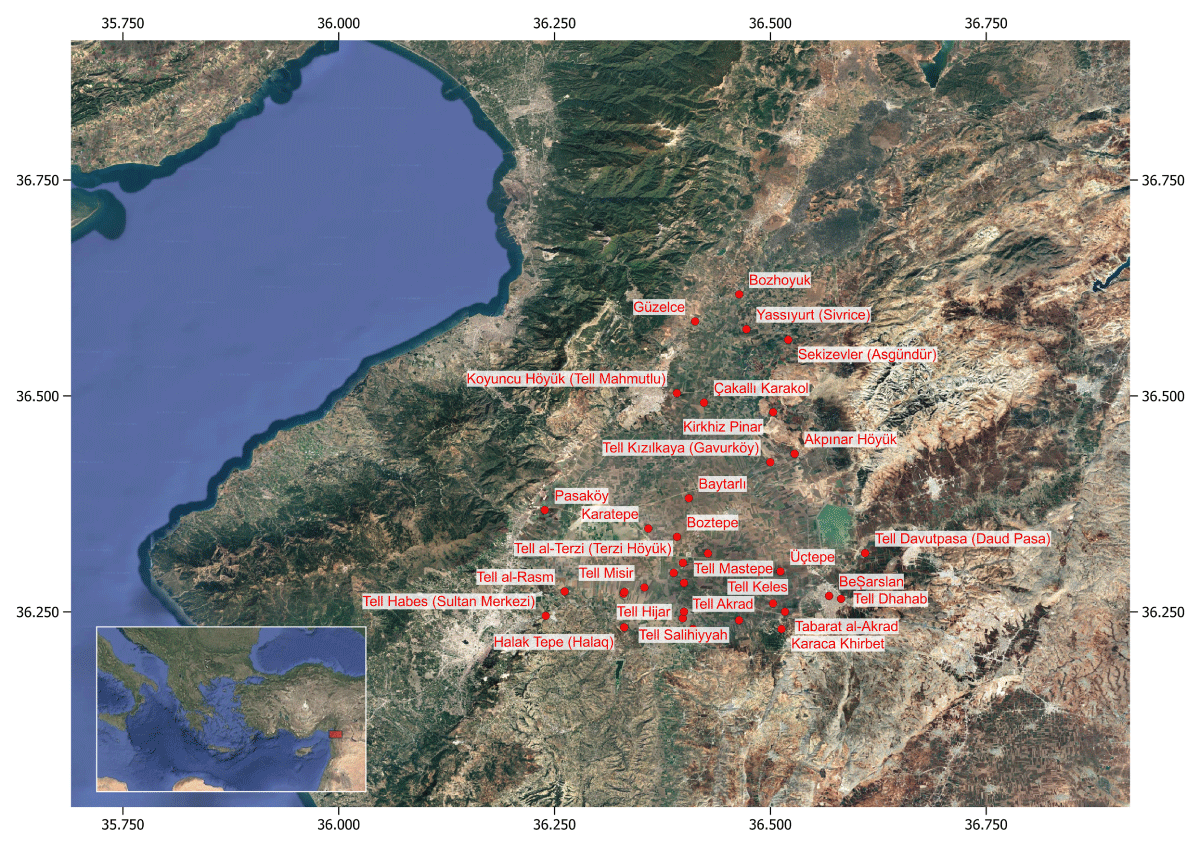
Figure 1
Location of Bronze Age sites analysed in the Amuq Valley. Regional map showing the spatial distribution of the 35 surveyed sites included in the dataset used for the similarity network analysis.
| SITE | RED-BLACK BURNISHED WARE | PLAIN SIMPLE WARE | WHITE SLIPPED WARE | SLIPPED WARE |
|---|---|---|---|---|
| Guzelce | 1 | 1 | 0 | 0 |
| Yassiyurt (Sivrice) | 0 | 0 | 1 | 0 |
| Pasakoy | 1 | 1 | 0 | 0 |
| Koyuncu Hoyuk (Tell Mahmutlu) | 1 | 1 | 0 | 0 |
| Kirkhiz Pinar | 1 | 0 | 0 | 0 |
| Tell Kizilkaya | 1 | 1 | 0 | 0 |
| Tell Baytarli (Toprakli) | 0 | 0 | 1 | 0 |
| Akpinar Hoyuk | 1 | 1 | 0 | 0 |
| Tell Misir | 1 | 0 | 0 | 0 |
| Tell al-Rasm | 0 | 1 | 0 | 0 |
| Tell Uzunarab (Bozhoyuk) | 1 | 1 | 0 | 0 |
| Karatepe | 1 | 1 | 0 | 0 |
| Boztepe | 1 | 1 | 0 | 0 |
| Tell Hasanusagi | 1 | 1 | 0 | 1 |
| Tell al-Terzi (Terzi Hoyuk) | 1 | 0 | 0 | 0 |
| Kucuk Avara (Turhan Bey Ciftlik) | 1 | 0 | 0 | 0 |
| Tell Keles | 1 | 1 | 0 | 1 |
| Tulul Salihiyyah al-Saghir | 1 | 0 | 0 | 0 |
| Halak Tepe (Halaq) | 1 | 1 | 0 | 0 |
| Tell Akrad | 1 | 0 | 0 | 0 |
| Tell Saluq | 1 | 0 | 0 | 0 |
| Besarslan (Tell Hamda) | 1 | 1 | 0 | 0 |
| Tell Mastepe (Mastepe) | 1 | 0 | 0 | 0 |
| Tell Davutpaia (Daud Pasa) | 1 | 0 | 0 | 0 |
| Putoglu (Uctepe) | 1 | 1 | 0 | 0 |
| Karaca Khirbet ‘Ali | 1 | 0 | 0 | 0 |
| Tell Ermeneia | 1 | 1 | 0 | 1 |
| Tell Dhahab (Altin Tepe) | 1 | 0 | 0 | 0 |
| Tell Hijar | 1 | 0 | 0 | 0 |
| Tabarat al-Akrad (Tell al-Hayey) | 1 | 0 | 0 | 0 |
| Temel Kizilkaya | 1 | 0 | 0 | 0 |
| Sekizevler (Asgundur) | 1 | 1 | 0 | 0 |
| Kucuk Avara (South Çiftlik) | 0 | 1 | 0 | 0 |
| Tell Habes (Sultan Merkezi) | 1 | 0 | 0 | 0 |
| Cakalli Karakol | 1 | 0 | 0 | 0 |
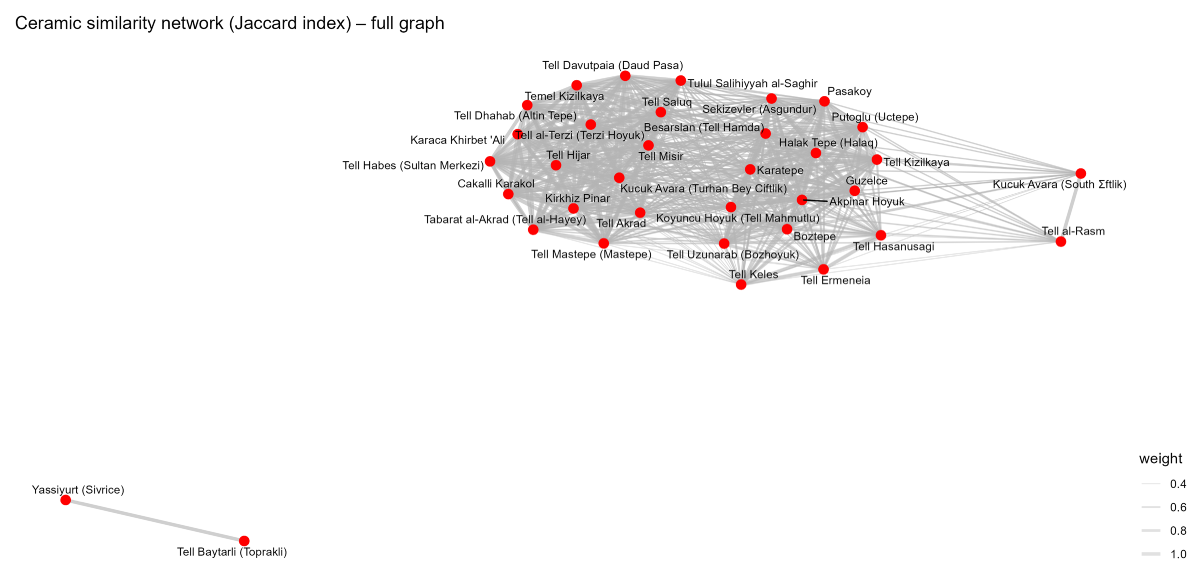
Figure 2a
Full similarity network derived from ceramic co-occurrence. Network representation of the site–site similarity structure based on the Jaccard index calculated from the bipartite site-by-ceramic category matrix. Nodes represent archaeological sites and edges represent pairwise similarity relations.
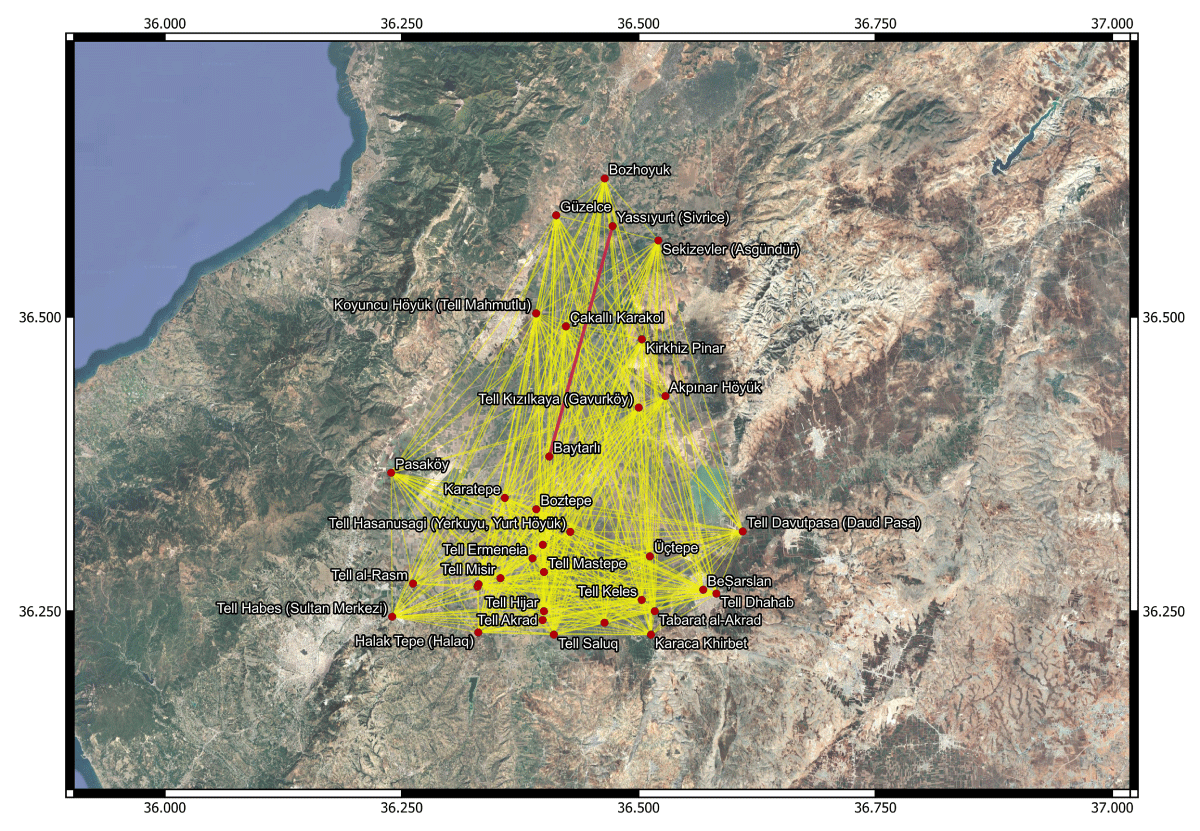
Figure 2b
Geographic projection of the complete site–site similarity network over satellite imagery. Nodes are placed at their real-world coordinates in the Amuq Valley; yellow edges represent pairwise Jaccard similarities. Near-complete connectivity spans the full spatial extent of the surveyed sites without forming spatial clusters, indicating regional-scale diffusion rather than localized interaction. The red edge marks the only exclusive tie — Yassıyurt (Sivrice)–Tell Baytarlı (Topraklı), sharing White Slipped Ware (cf. Section 5.3) — which carries the same weight as all others despite its rarity.
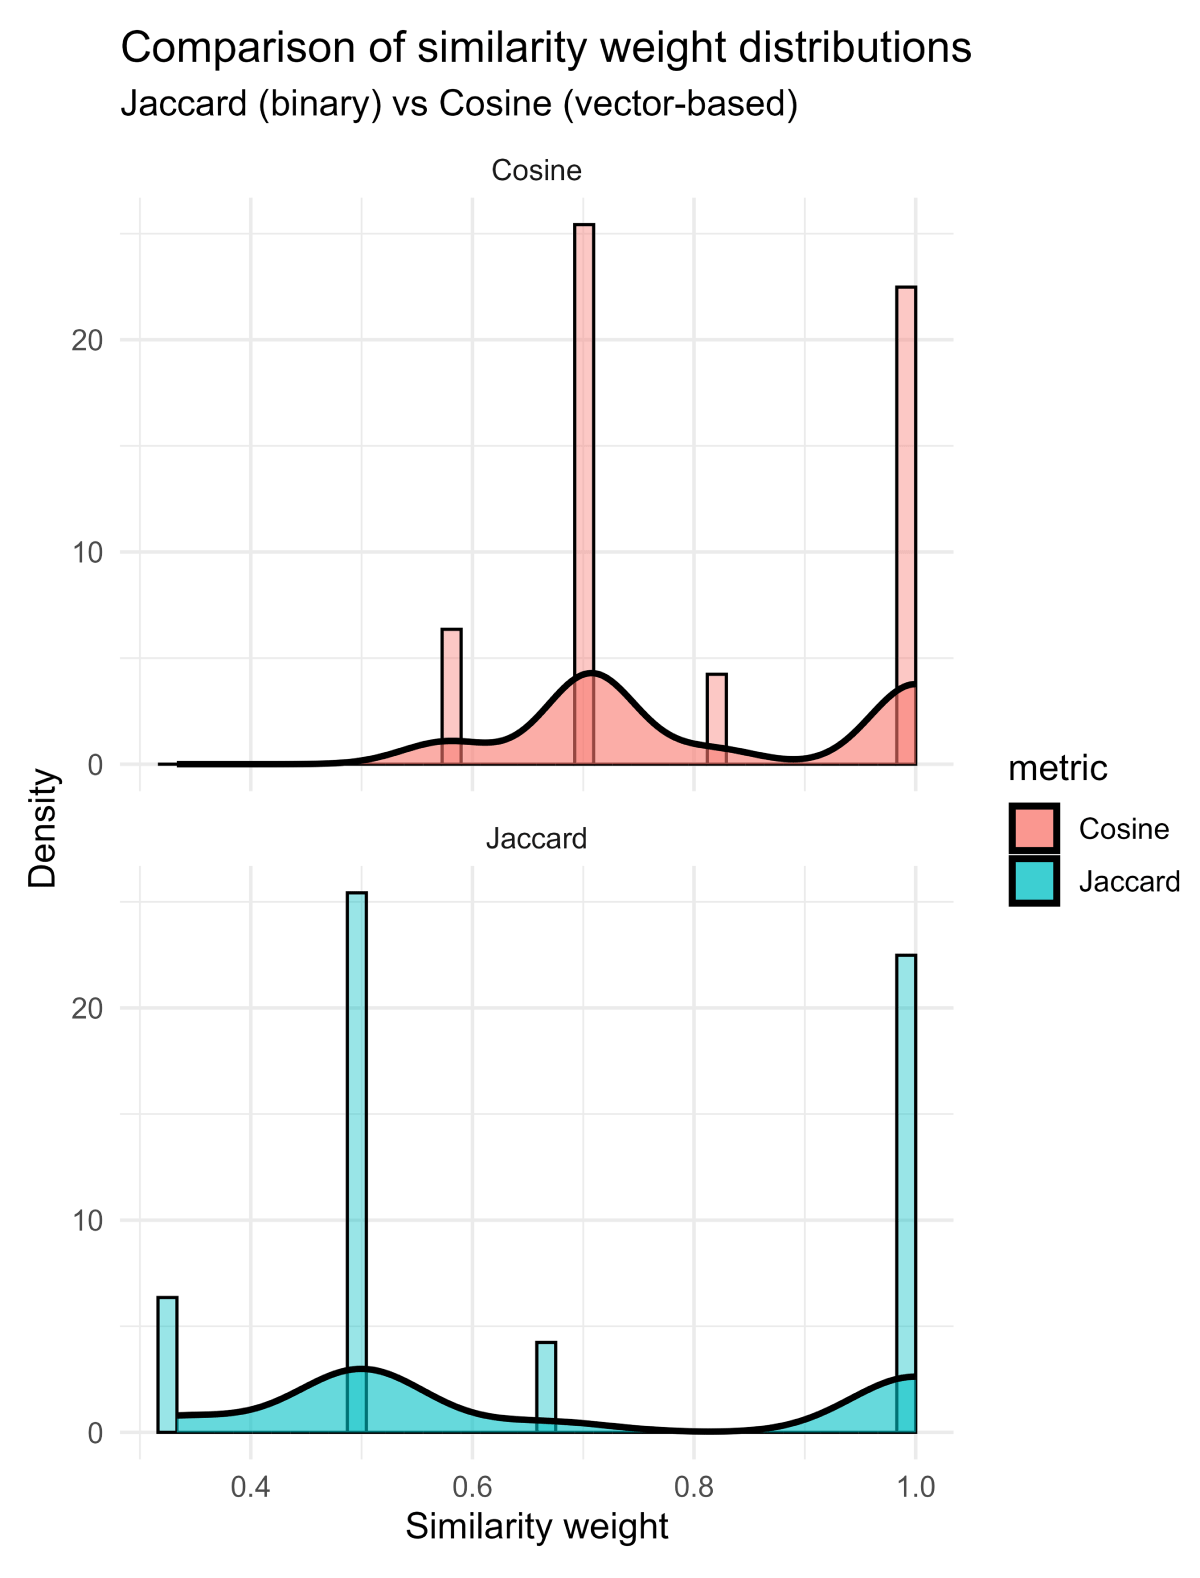
Figure s2
Comparison of similarity weight distributions for Jaccard and cosine metrics. Distribution of similarity weights derived from the Jaccard index (binary co-occurrence) and cosine similarity (vector-based measure) calculated from the same bipartite dataset.
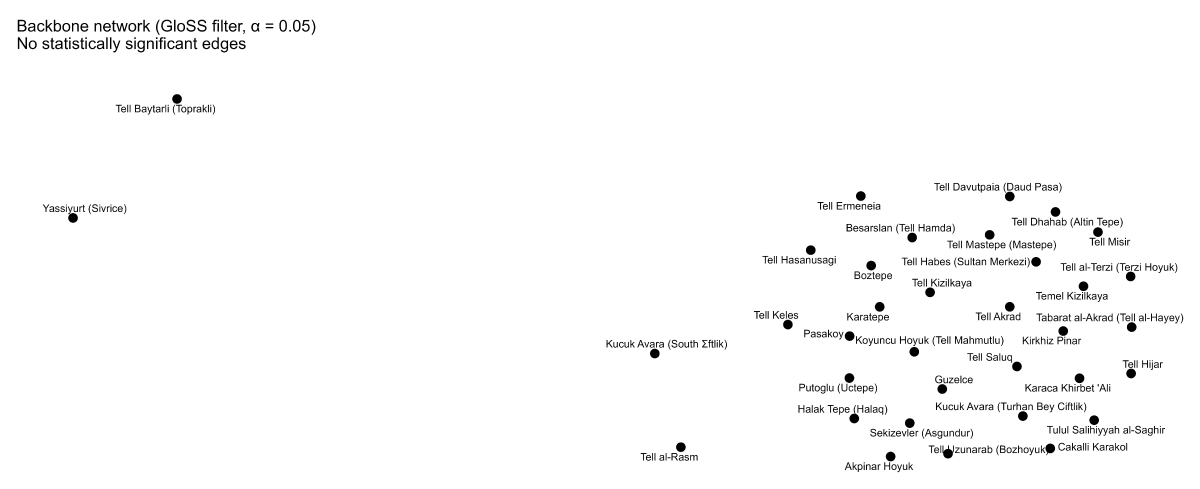
Figure 3
Similarity network after application of the GloSS filter. Backbone extraction using the Global Statistical Significance (GloSS) filter did not retain statistically significant edges at conventional significance thresholds, resulting in an empty backbone.
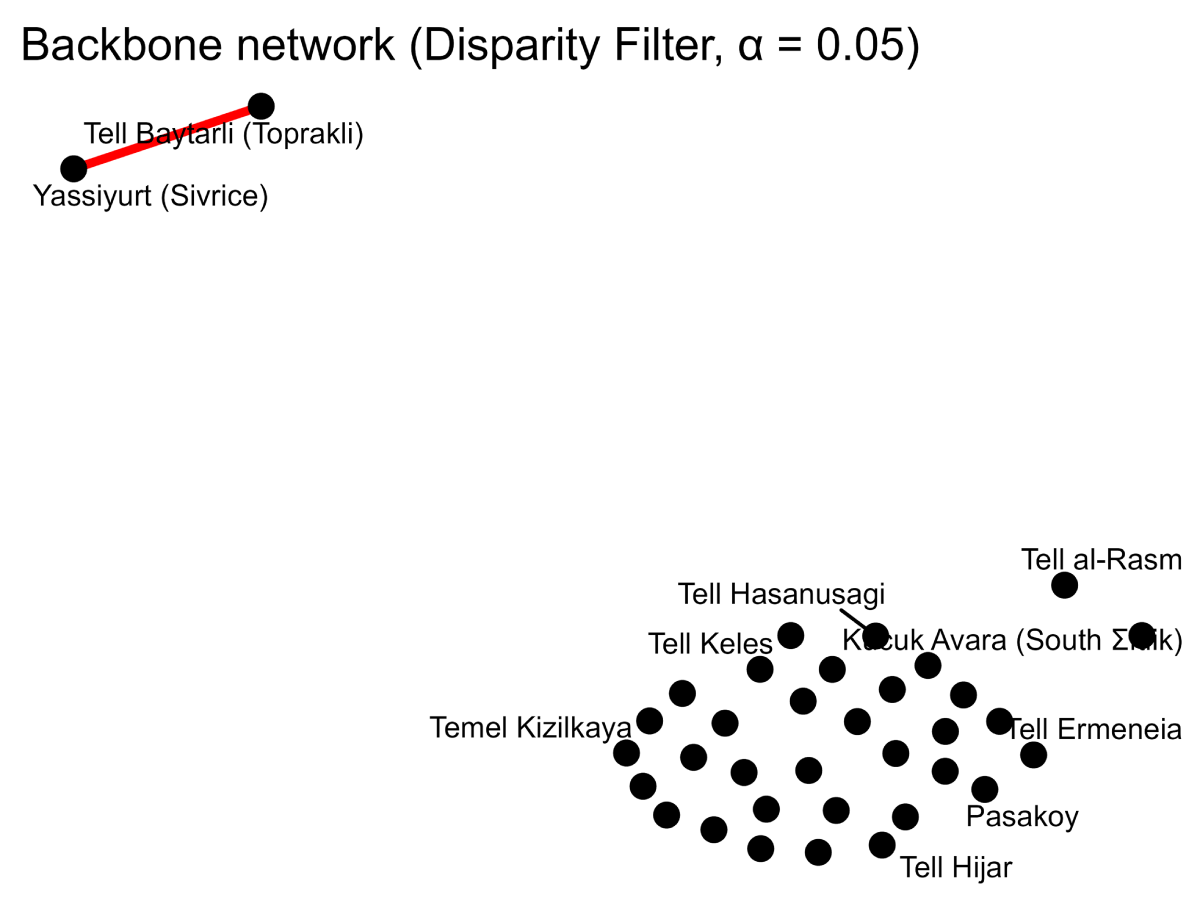
Figure 4
Backbone network extracted using the Disparity Filter (α = 0.05). The Disparity Filter retains no statistically significant edges. The single edge shown, connecting Yassiyurt (Sivrice) and Tell Baytarlı (Topraklı), reflects the exclusive co-occurrence of White Slipped Ware at these two sites: as a pair of degree-one nodes, it falls outside the domain of the disparity measure and is retained by default rather than by statistical significance.