
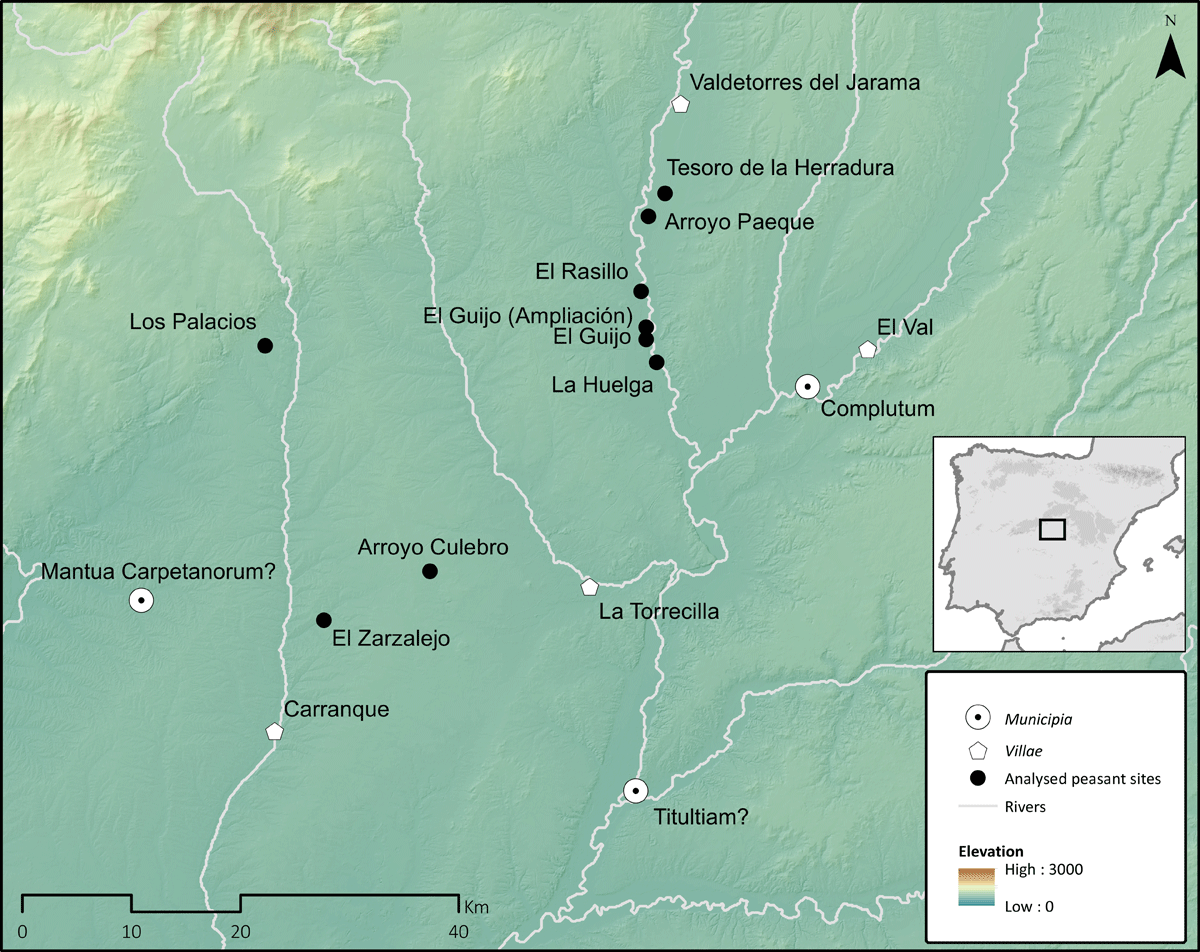
Figure 1
Analysed sites location map. The map shows the location of the analysed sites and other settlements as reference.
Table 1
Matrix with the Brainerd-Robinson similarity values for the 1st century AD.
| ARROYO CULEBRO | ARROYO PAEQUE | EL GUIJO AMPLIACIÓN | EL GUIJO | EL RASILLO | LA HUELGA | LOS PALACIOS | TESORO DE LA HERRADURA | |
|---|---|---|---|---|---|---|---|---|
| Arroyo Culebro | 200 | 101.961 | 66.762 | 71.221 | 87.129 | 95.469 | 89.693 | 98.862 |
| Arroyo Paeque | 101.961 | 200 | 124.837 | 83.406 | 98.130 | 113.021 | 147.678 | 141.822 |
| El Guijo Ampliación | 66.762 | 124.837 | 200 | 90.400 | 111.005 | 99.533 | 120.192 | 120.163 |
| El Guijo | 71.221 | 83.406 | 90.400 | 200 | 120.816 | 133.372 | 87.009 | 91.088 |
| El Rasillo | 87.129 | 98.130 | 111.005 | 120.816 | 200 | 120.851 | 95.778 | 101.832 |
| La Huelga | 95.469 | 113.021 | 99.533 | 133.372 | 120.851 | 200 | 122.873 | 128.354 |
| Los Palacios | 89.693 | 147.678 | 120.192 | 87.009 | 95.778 | 122.873 | 200 | 151.755 |
| Tesoro de la Herradura | 98.862 | 141.822 | 120.163 | 91.088 | 101.832 | 128.354 | 151.755 | 200 |
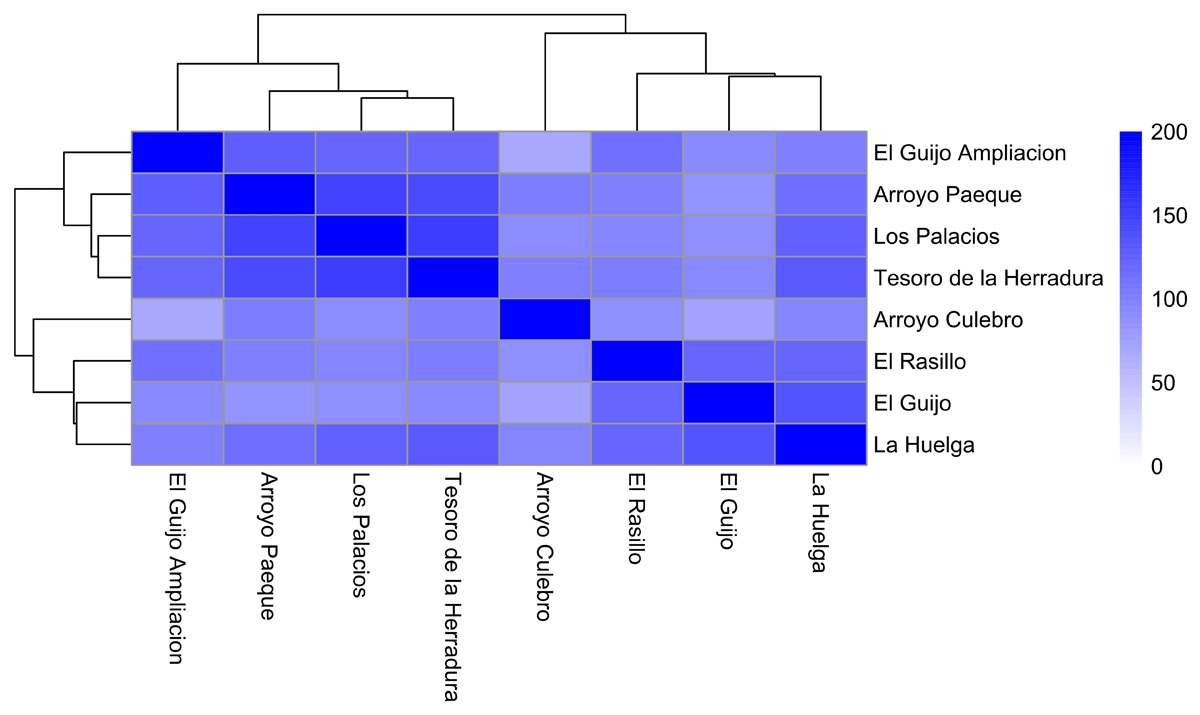
Figure 2
Heatmap of the Brainerd-Robinson similarity values of the archaeological sites during the 1st century AD.
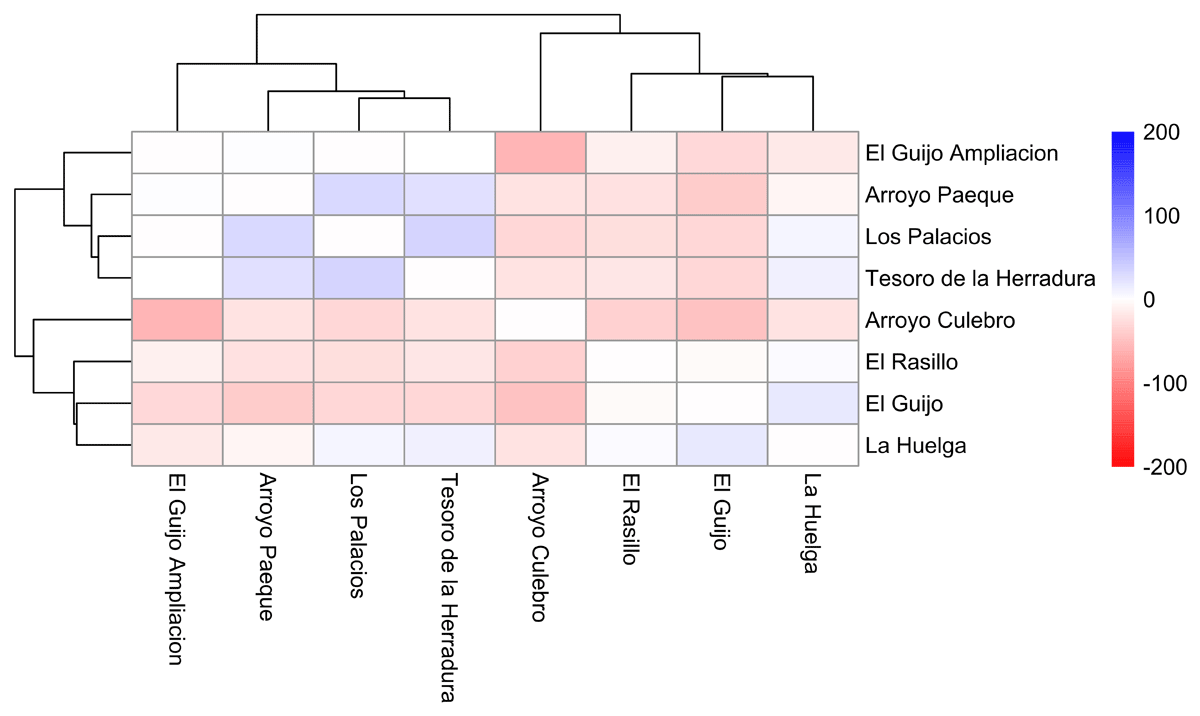
Figure 3
Matrix showing the difference between the Brainerd-Robinson values during the 1st c. AD and the B-R values of the bootstrapped sample.
Table 2
Matrix with the Brainerd-Robinson similarity values for the 2nd century AD.
| ARROYO PAEQUE | EL GUIJO AMPLIACIÓN | EL GUIJO | EL RASILLO | EL ZARZALEJO | LA HUELGA | LOS PALACIOS | TESORO DE LA HERRADURA | |
|---|---|---|---|---|---|---|---|---|
| Arroyo Paeque | 200 | 121.395 | 80.092 | 92.686 | 157.594 | 108.687 | 147.990 | 135.167 |
| El Guijo Ampliación | 121.395 | 200 | 88.303 | 108.753 | 107.752 | 98.305 | 119.596 | 119.991 |
| El Guijo | 80.092 | 88.303 | 200 | 119.217 | 82.887 | 134.389 | 83.230 | 88.919 |
| El Rasillo | 92.686 | 108.753 | 119.217 | 200 | 97.023 | 122.494 | 92.547 | 99.863 |
| El Zarzalejo | 157.594 | 107.752 | 82.887 | 97.023 | 200 | 114.767 | 137.066 | 128.383 |
| La Huelga | 108.687 | 98.305 | 134.389 | 122.494 | 114.767 | 200 | 119.430 | 127.542 |
| Los Palacios | 147.990 | 119.596 | 83.230 | 92.547 | 137.066 | 119.430 | 200 | 148.941 |
| Tesoro de la Herradura | 135.167 | 119.991 | 88.919 | 99.863 | 128.383 | 127.542 | 148.941 | 200 |
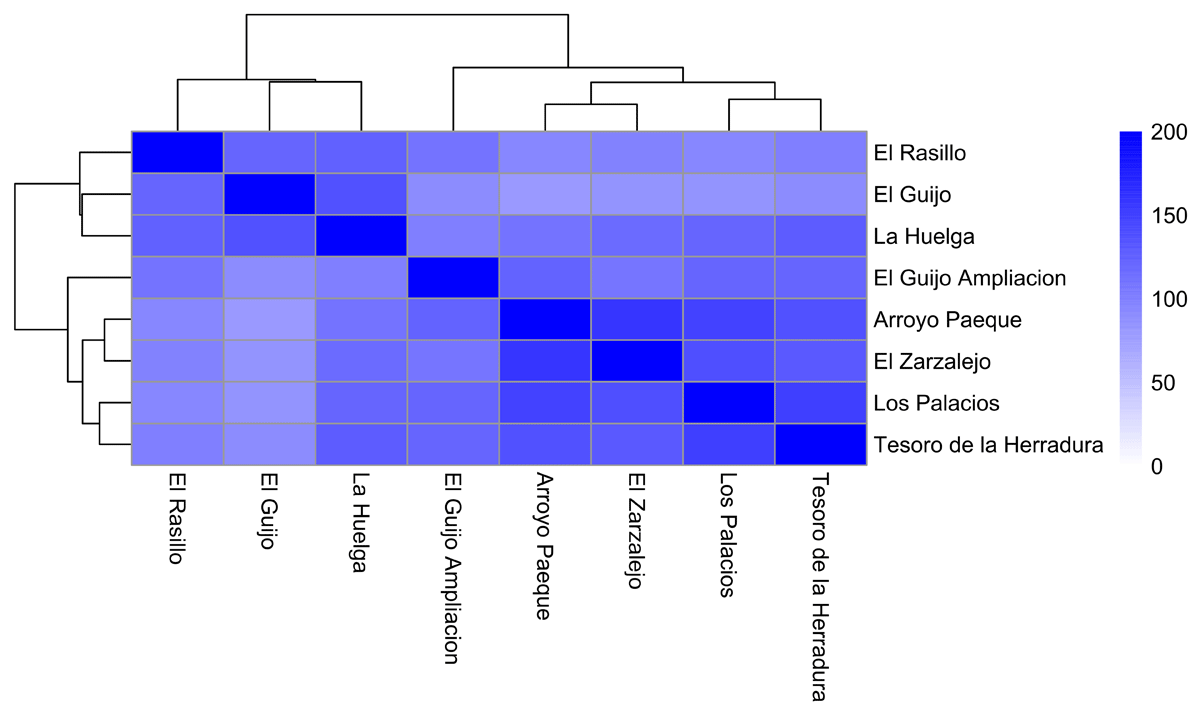
Figure 4
Heatmap of the Brainerd-Robinson similarity values of the archaeological sites during the 2nd century AD.
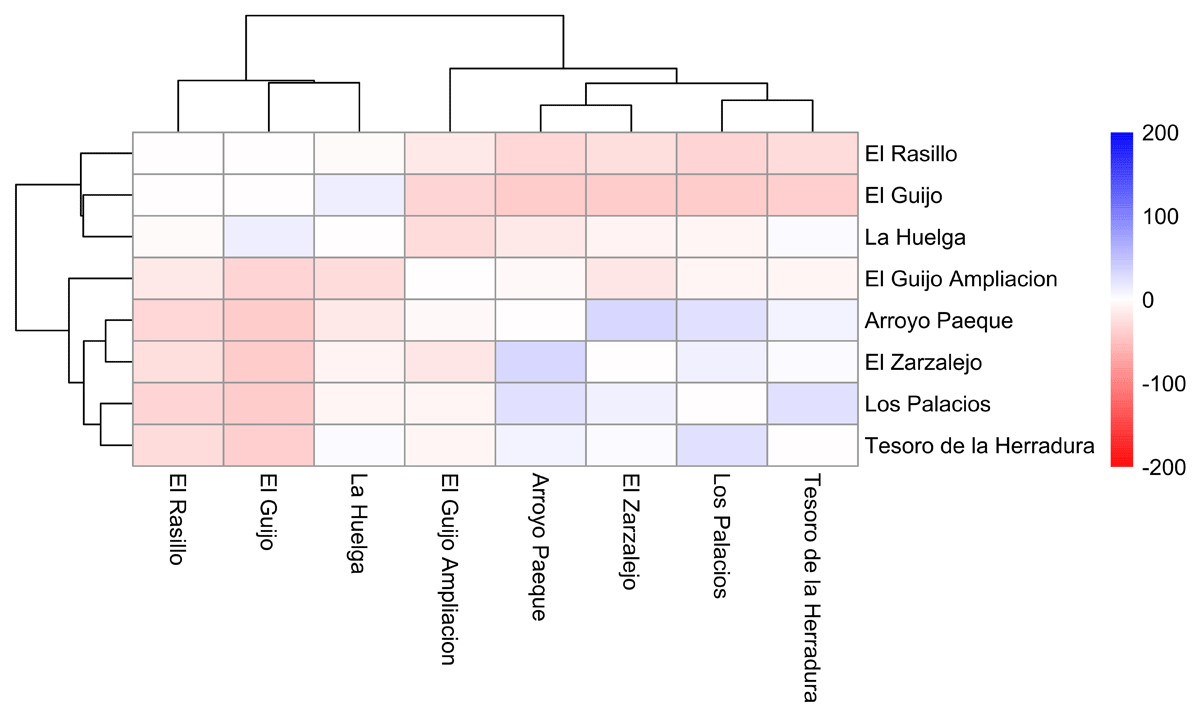
Figure 5
Matrix showing the difference between the Brainerd-Robinson values during the 2nd c. AD and the B-R values of the bootstrapped sample.
Table 3
Matrix with the Brainerd-Robinson similarity values for the 3rd century AD.
| ARROYO PAEQUE | EL ZARZALEJO | LA HUELGA | LOS PALACIOS | |
|---|---|---|---|---|
| Arroyo Paeque | 200 | 164.974 | 110.707 | 155.369 |
| El Zarzalejo | 164.974 | 200 | 119.359 | 140.532 |
| La Huelga | 110.707 | 119.359 | 200 | 124.061 |
| Los Palacios | 155.369 | 140.532 | 124.061 | 200 |
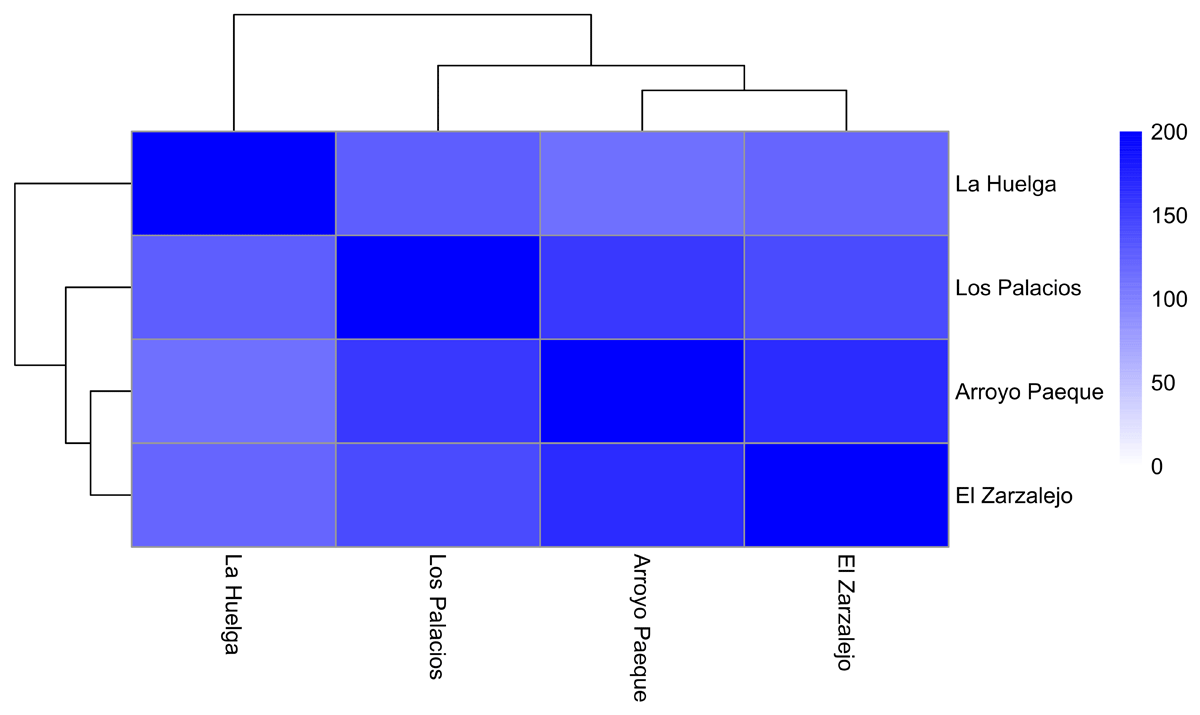
Figure 6
Heatmap of the Brainerd-Robinson similarity values of the archaeological sites during the 3rd century AD.
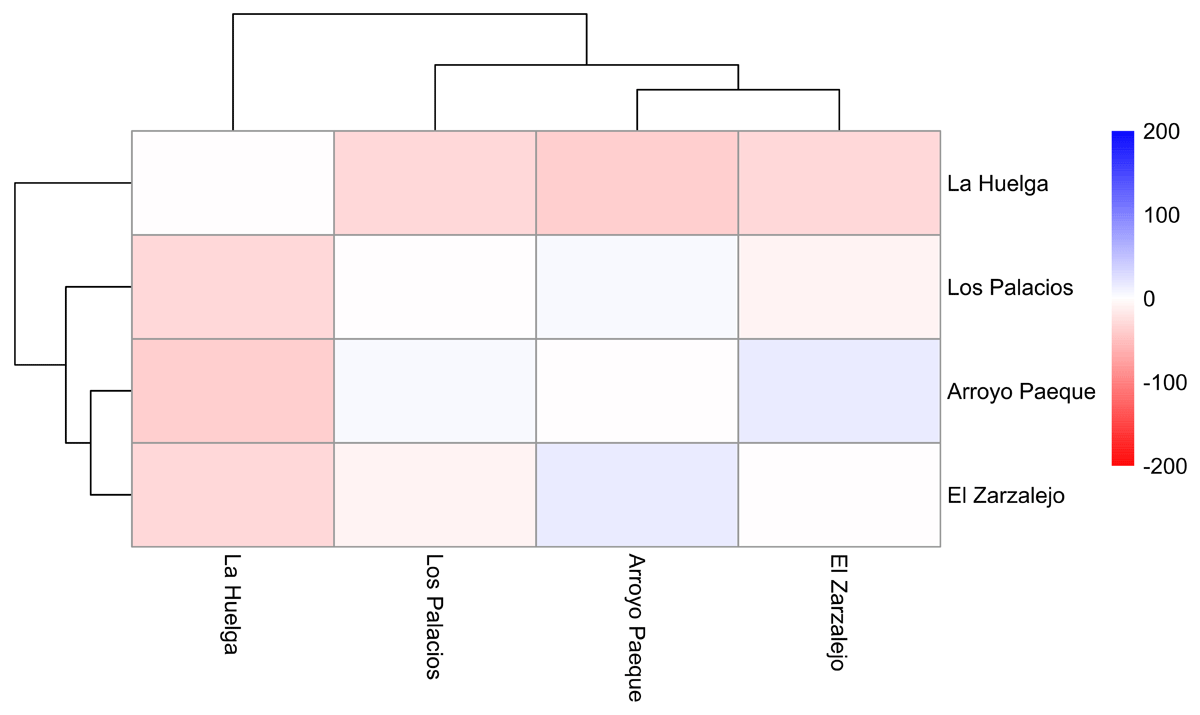
Figure 7
Matrix showing the difference between the Brainerd-Robinson values during the 3rd c. AD and the B-R values of the bootstrapped sample.
Table 4
Matrix with the Brainerd-Robinson similarity values for the 1st century AD without the ubiquitous artefact types.
| ARROYO CULEBRO | ARROYO PAEQUE | EL GUIJO AMPLIACIÓN | EL GUIJO | EL RASILLO | LA HUELGA | LOS PALACIOS | TESORO DE LA HERRADURA | |
|---|---|---|---|---|---|---|---|---|
| Arroyo Culebro | 200 | 0 | 13.559 | 24.265 | 26.667 | 58.514 | 33.333 | 47.647 |
| Arroyo Paeque | 0 | 200 | 58.860 | 48.864 | 26.667 | 42.105 | 76.923 | 58.182 |
| El Guijo Ampliación | 13.559 | 58.860 | 200 | 29.449 | 43.842 | 54.951 | 63.103 | 58.559 |
| El Guijo | 24.265 | 48.864 | 29.449 | 200 | 59.722 | 60.855 | 62.660 | 68.750 |
| El Rasillo | 26.667 | 26.667 | 43.842 | 59.722 | 200 | 61.053 | 50.940 | 60.000 |
| La Huelga | 58.514 | 42.105 | 54.951 | 60.855 | 61.053 | 200 | 57.760 | 56.579 |
| Los Palacios | 33.333 | 76.923 | 63.103 | 62.660 | 50.940 | 57.760 | 200 | 110.641 |
| Tesoro de la Herradura | 47.647 | 58.182 | 58.559 | 68.750 | 60.000 | 56.579 | 110.641 | 200 |
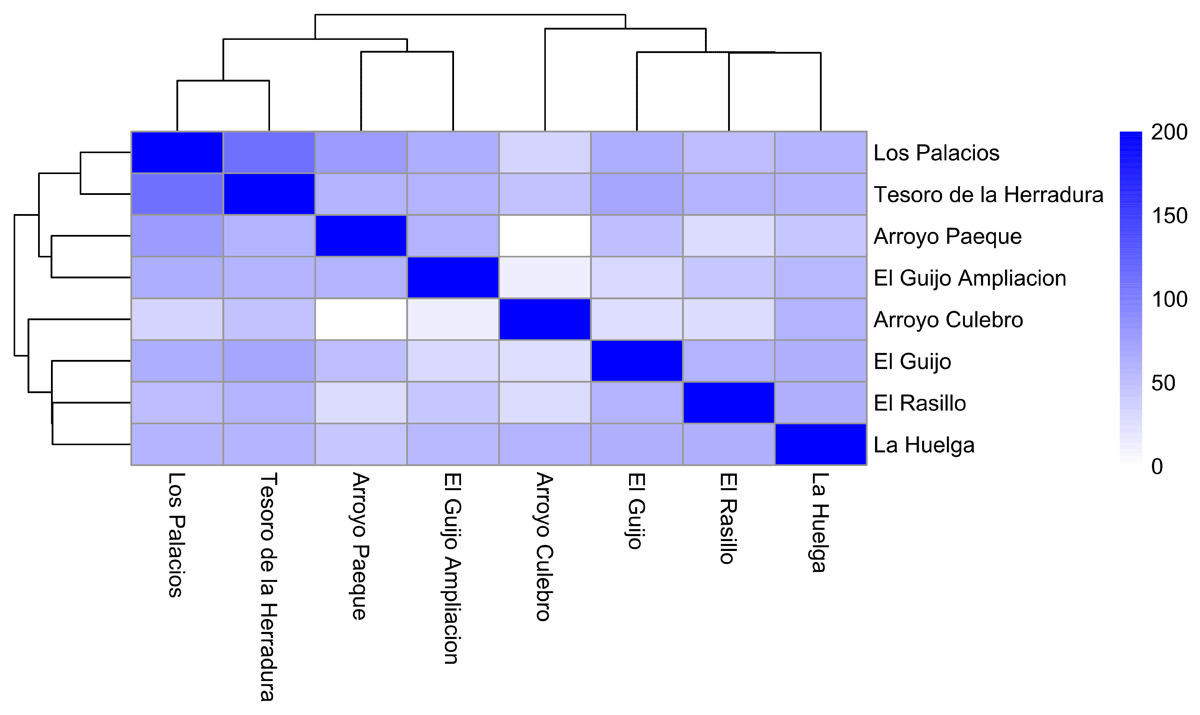
Figure 8
Heatmap of the Brainerd-Robinson similarity values of the archaeological sites without the ubiquitous artefact types during the 1st century AD.
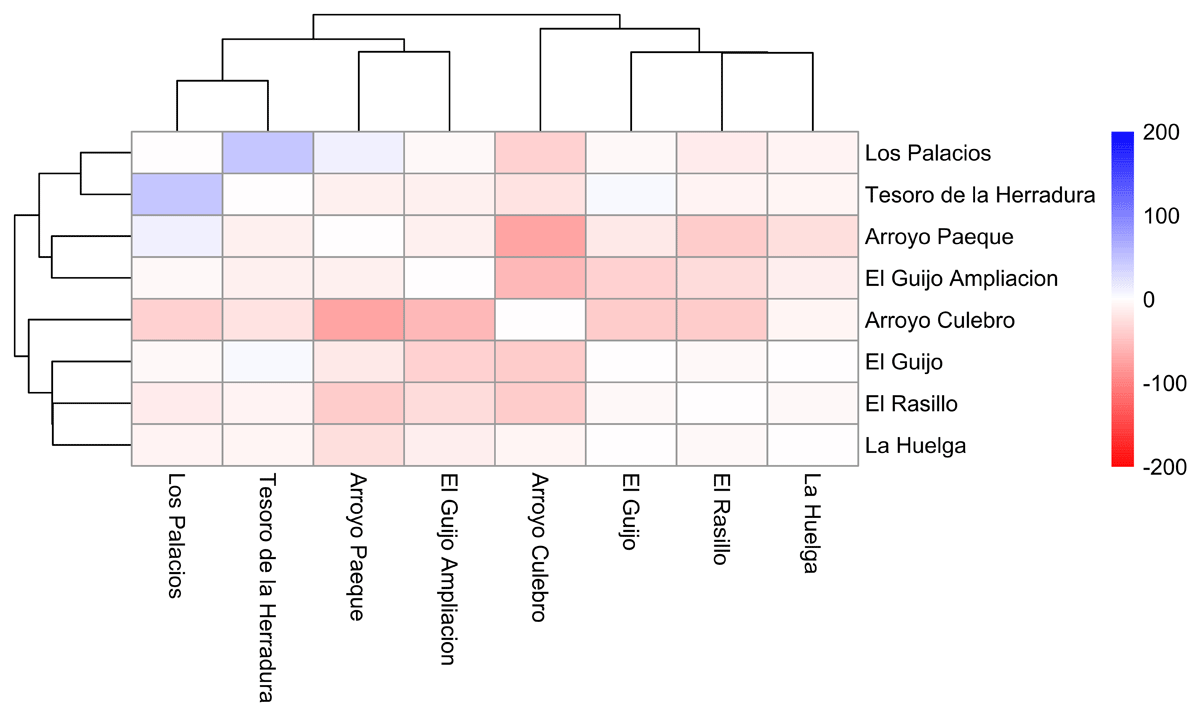
Figure 9
Matrix showing the difference between the Brainerd-Robinson values without the ubiquitous nodes during the 1st c. AD and the B-R values of the bootstrapped sample.
Table 5
Matrix with the Brainerd-Robinson similarity values for the 2nd century AD without the ubiquitous artefact types.
| ARROYO PAEQUE | EL GUIJO AMPLIACIÓN | EL GUIJO | EL RASILLO | EL ZARZALEJO | LA HUELGA | LOS PALACIOS | TESORO DE LA HERRADURA | |
|---|---|---|---|---|---|---|---|---|
| Arroyo Paeque | 200 | 57.257 | 32.164 | 25.000 | 110.526 | 42.105 | 89.912 | 54.306 |
| El Guijo Ampliación | 57.257 | 200 | 29.293 | 42.803 | 74.279 | 51.356 | 66.856 | 65.152 |
| El Guijo | 32.164 | 29.293 | 200 | 59.722 | 36.179 | 64.327 | 51.389 | 62.121 |
| El Rasillo | 25.000 | 42.803 | 59.722 | 200 | 29.878 | 66.886 | 45.833 | 55.682 |
| El Zarzalejo | 110.526 | 74.279 | 36.179 | 29.878 | 200 | 42.234 | 104.980 | 68.404 |
| La Huelga | 42.105 | 51.356 | 64.327 | 66.886 | 42.234 | 200 | 56.579 | 54.306 |
| Los Palacios | 89.912 | 66.856 | 51.389 | 45.833 | 104.980 | 56.579 | 200 | 110.795 |
| Tesoro de la Herradura | 54.306 | 65.152 | 62.121 | 55.682 | 68.404 | 54.306 | 110.795 | 200 |
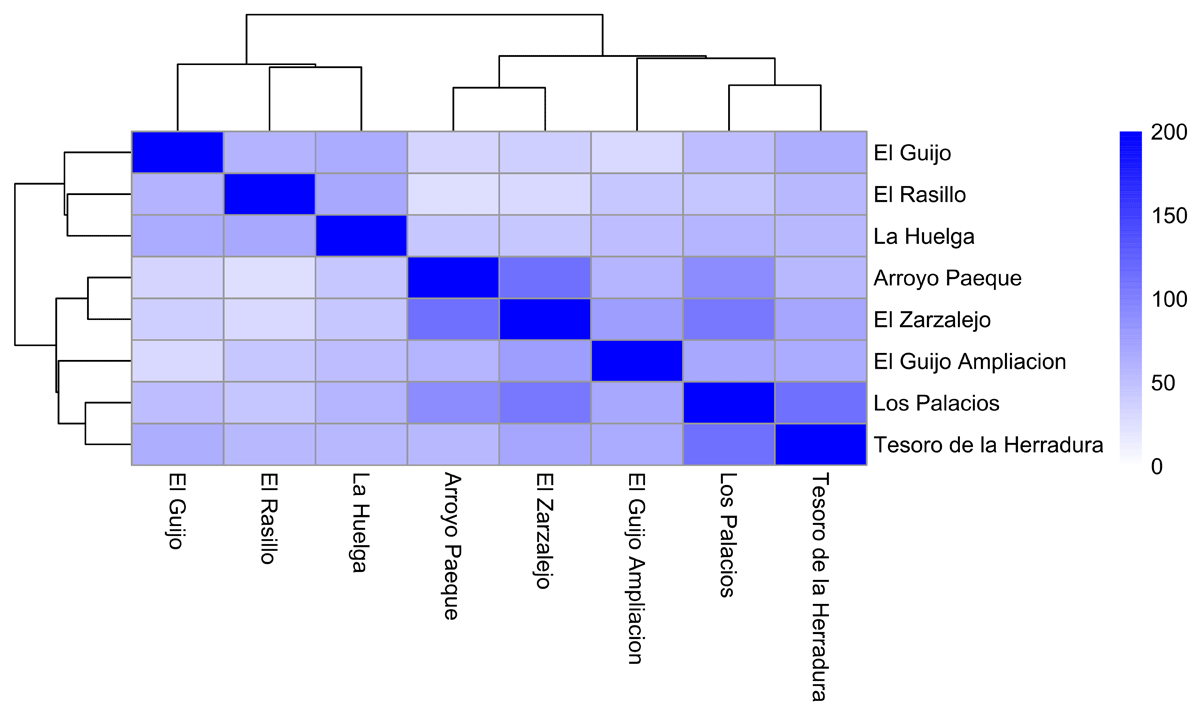
Figure 10
Heatmap of the Brainerd-Robinson similarity values of the archaeological sites without the ubiquitous artefact types during the 2nd century AD.
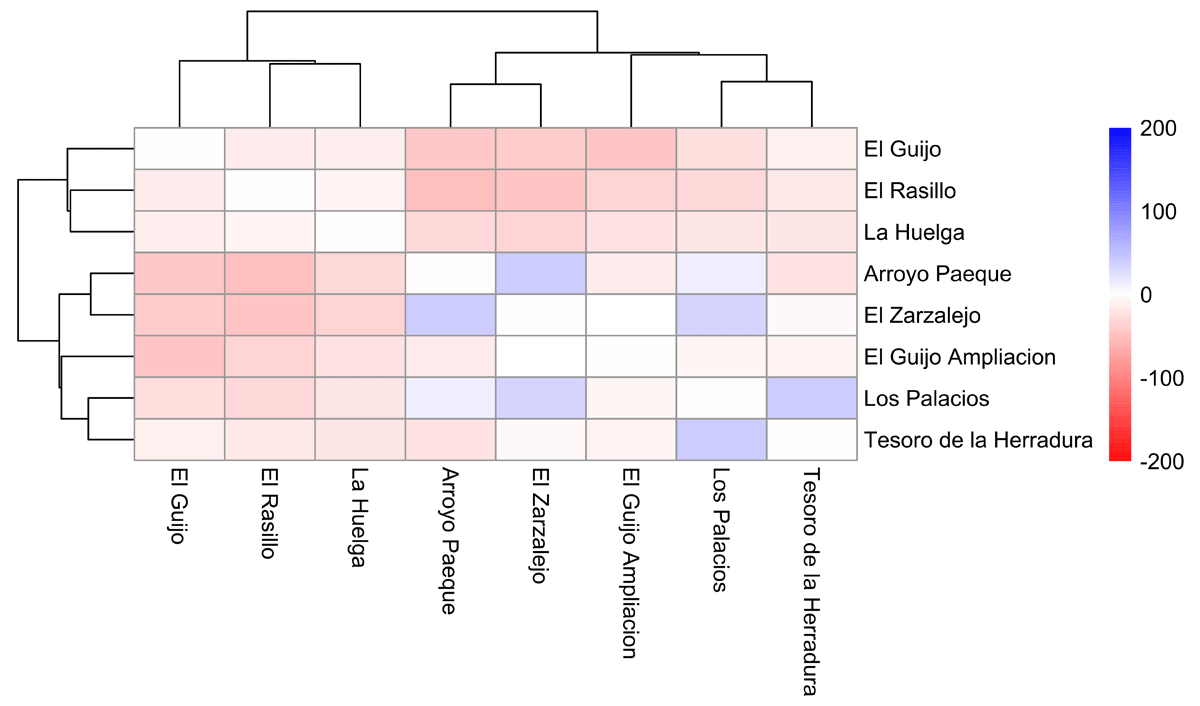
Figure 11
Matrix showing the difference between the Brainerd-Robinson values without the ubiquitous nodes during the 2nd c. AD and the B-R values of the bootstrapped sample.
Table 6
Matrix with the Brainerd-Robinson similarity values for the 3rd century AD without the ubiquitous artefact types.
| ARROYO PAEQUE | EL ZARZALEJO | LA HUELGA | LOS PALACIOS | |
|---|---|---|---|---|
| Arroyo Paeque | 200 | 121.429 | 26.667 | 93.269 |
| El Zarzalejo | 121.429 | 200 | 39.286 | 100 |
| La Huelga | 26.667 | 39.286 | 200 | 46.250 |
| Los Palacios | 93.269 | 100 | 46.250 | 200 |
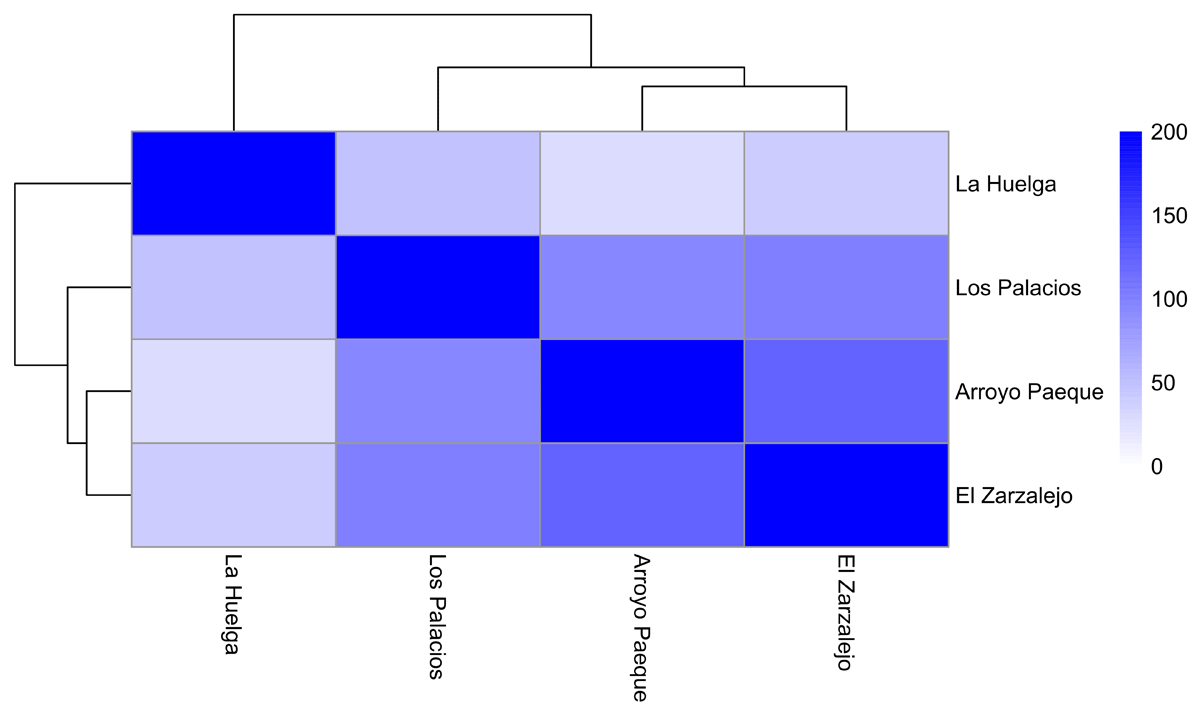
Figure 12
Heatmap of the Brainerd-Robinson similarity values of the archaeological sites without the ubiquitous artefact types during the 3rd century AD.
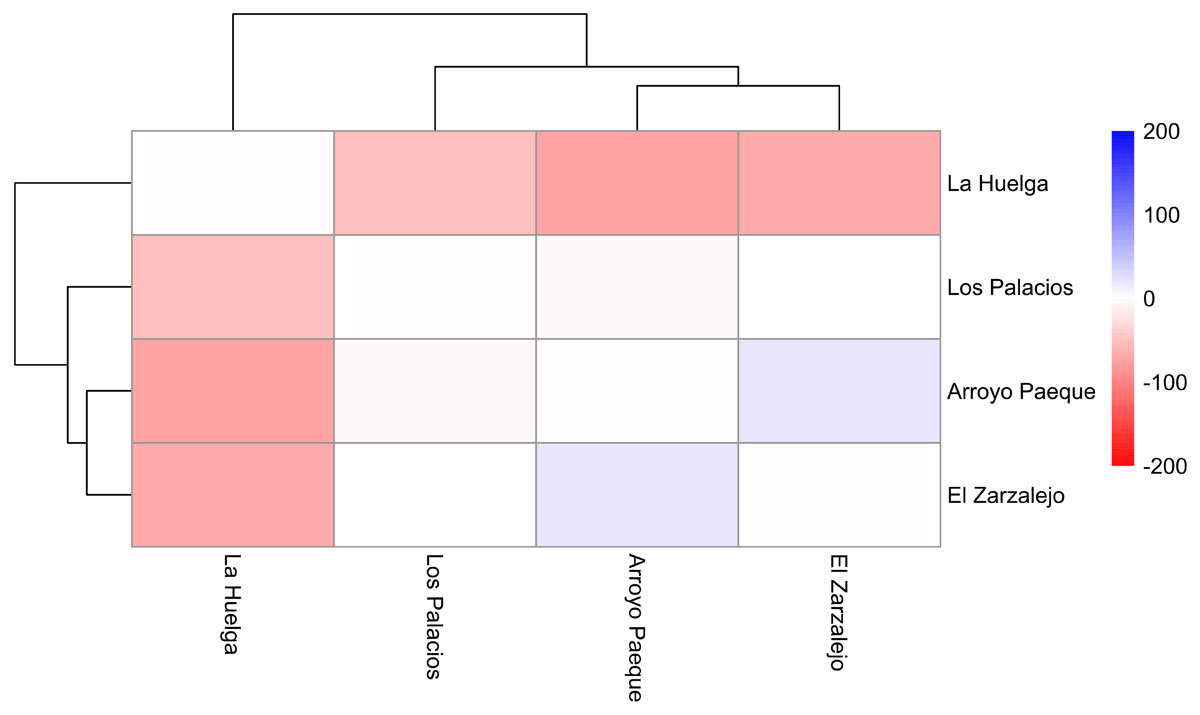
Figure 13
Matrix showing the difference between the Brainerd-Robinson values without the ubiquitous nodes during the 3rd c. AD and the B-R values of the bootstrapped sample.