
1. Introduction
A. L. Schlözer coins the idea of Levantine trade taking place in 14th–15th century Wallachia and Transylvania and publishes it in 1795. The idea is met with much controversy, mainly due to historians believing that Levantine wares arrived in Hungary from the Adriatic port city Zadar rather than the Black Sea, an idea rebutted by Pach, who clarifies that Hungary’s primary source of Levantine goods was Venice, followed by the Dalmatian city Ragusa – known today as Dubrovnik (Pach 2007). At the beginning of the 15th century, Venice’s attempts at controlling the Dalmatian coast spark an armed conflict with the Hungarian king Sigismund of Luxembourg, who aims to destabilize Venice by undermining its dominance over the Levantine trade (Horváth 2017). To achieve this, he seeks an alternative supply in the port cities of the Danube and the Black Sea, where Venice’s economic rivals, the Genoese are already involved in Levantine trade. At the end of the 15th century, the imports documented in Sibiu’s and Brașov’s toll registers amount to 7% of Venice’s imports at the time, and are five times larger in comparison to those of the Adriatic Coast (Pach 2007).
Given the value of Levantine goods and the difficulty in acquiring them, their trade is a high-profile endeavour and lasts for at least two centuries in this region. The objective of this study is to investigate the structure of the trading network, analyse the various network positions and roles assumed by the nodes, and assess the benefits and drawbacks associated with them.
2. Data
The primary sources on Levantine trade in this region encompass toll records, official letters on trade privileges, and documents of official trade routes. They show that trade clearly played a pivotal role in the development of urban centres, occasionally blurring the distinction between a small city and a village with a prosperous weekly market (Rădvan 2010). Here, a city is defined as a location where Levantine goods are traded, evident from the city›s toll records, official documents mentioning the city as part of a recognized trade route, or a place recognized for its commercial activities through official letters to local merchants. Given this definition we can focus on individual cities and their involvement in Levantine trade.
The toll records of 15th century Tulcea show the continuous influx of Levantine wares moving upstream towards Brăila (Hovari 1984). Merchants from Brașov have the benefit of paying lower tolls for foreign wares bought in Brăila or other cities South of the Danube. The tolls are collected in Câmpulung and Slatina (Pascu et al. 1977),1 with Ploiești acting as an additional toll collection point for pepper, saffron and cotton (Ciupercă et al. 2022). The toll registers of Sibiu mention merchants from Râmnicu Vâlcea, Curtea de Argeș, Câmpulung, Târgoviște, Slatina, Piteşti, București and Craiova (Rădvan 2009). In a letter from the early 16th century, the merchants of Târgoviște and Curtea de Argeș offer to bring their wares to Brașov instead of Sibiu and to negotiate a selling price with them (Bogdan 1902).2 Similarly, a letter from Neagoe Basarab notifies the merchants of Brașov of the arrival of a Turkish merchant with wares in București (Bogdan 1902).
The main connections between Moldova and Transylvania pass through Bistrița and Brașov, both cities having toll collection rights (Zsolt 2017). In Moldova, Suceava acts as the main toll collection centre for silk and pepper (Costachescu 1932).3 The deeds granted by Alexander the Good to the merchants of Lviv in 1408 mention Baia, Roman and Bacău as cities belonging to the trading routes.
Trading privileges typically come with the rights and obligations for road maintenance. In Transylvania, the main roads are known as via publica, regia or magna. Those adjectives signify their openness to all subjects of the king and their position in the kingdom’s road hierarchy, guaranteeing accessibility and safety. In addition to local nobles managing the roads (Toda 2013), Sigismund of Luxembourg tasks a council of sworn judges with investigating the state of the roads and reporting illegal activities (Toda 2016). For Hunedoara, Sighișoara and Sebeș, additional guards are provided during fairs (Holban et al. 1970).
Wallachia has roads known as drumul mare – large road or drumul țării – country’s road, which are under the ruler’s administration. With the exception of the stone paved Roman road following the Olt valley, passing through Sibiu, Râmnicu Vâlcea and Slatina, all roads are dirt roads (Rădvan 2007). The route connecting Arad, Timișoara, Lugoj and Caransebeș is mentioned along the route connecting Oradea, Cluj, Alba Iulia, Sibiu and Turnu Măgurele as part of the main arteries in this area (Pascu et al. 1977).
The roads facilitate the movement of wares, even if access to foreign markets is strongly regulated. A letter dating back to 1431, signed by the Wallachian voivode Ioan Dan, informs the merchants of Câmpulung, Curtea de Argeș, Târgoviște, Gherghița, Brăila and Buzau of their right to sell their wares in the market of Brașov. While merchants from Wallachia are prohibited from travelling past Brașov and Sibiu, Transylvanian merchants are free to travel through Wallachia and cross the Danube. A document signed in 1431 by the Wallachian voivode regulates toll collection at Giurgiu and Nikopol for wares brought by Transylvanian merchants from across the Danube (Bogdan 1902). The same merchants would not go past Oradea however, as this territory is reserved for merchants from Kosice (Pach 2007).
The map illustrating the trading routes of 16th century Transylvania, Wallachia and Moldova (Pakucs-Willcocks 2019) serves as a secondary source, confirming the presence of all mentioned cities and the roads connecting them. Additionally, Târgu-Jiu, Câmpina, Făgăraș, Târgu-Mureș and Mediaș appear in Pakucs-Willcocks’ map and are also included in the analysis, given their geographical position, their proximity to the roads, and their likely involvement in Levantine trade. Figure 1 shows a recreation of this map that includes distinct colours to delineate the regions and symbols to denote the entry points and destinations of Levantine goods. In the 15th to 16th centuries, the borders experience fluctuations, such as the Ottoman Empire’s conquest of Brăila in 1538 (Radvan 2009). Here we consider the status quo at the turn of the century.
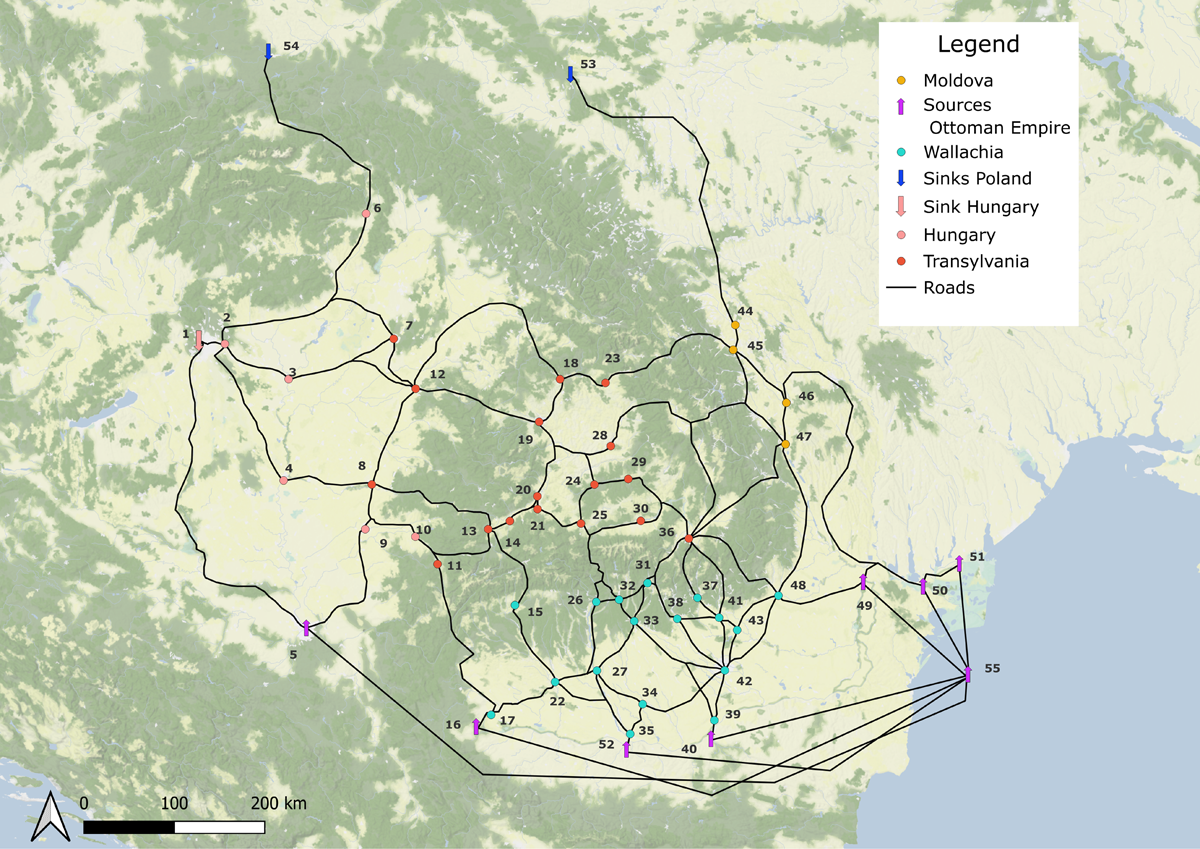
Figure 1
Map depicting the cities of Transylvania, Wallachia and Moldova, the roads connecting them, the sources, and sinks.
3. Methodology
To quantify the potential advantages of city positions in the trading system, we utilize network encoding: cities are represented as nodes, their regions are encoded as nodal attributes, and any road segment connecting two cities is an edge. This complies with de Soto’s approach to analyse the Roman road network of the Iberian Peninsula, where cities are encoded as nodes and roads as edges (de Soto 2019). Here, we encode the specific movement of the Levantine wares from South-East to North-West as the direction of the edges, representing the dispersion of wares—the network flow (Borgatti 2005). The flow starts from sources—the port cities on the Danube and ends in the sinks—the destinations Buda, Cracow and Lviv. The names of the cities and their assigned node ID are presented in Table 1, their geographical position in Figure 1.
Table 1
Cities and their ID.
| CITY | ID | CITY | ID |
|---|---|---|---|
| Buda | 1 | Sighișoara | 29 |
| Pest | 2 | Făgăraș | 30 |
| Szolnok | 3 | Câmpulung | 31 |
| Szeged | 4 | Curtea de Argeș | 32 |
| Belgrade | 5 | Pitești | 33 |
| Kosice | 6 | Roșiorii de Vede | 34 |
| Debrecen | 7 | Nikopol | 35 |
| Arad | 8 | Brașov | 36 |
| Timișoara | 9 | Câmpina | 37 |
| Lugoj | 10 | Târgoviște | 38 |
| Caransebeș | 11 | Giurgiu | 39 |
| Oradea | 12 | Ruse | 40 |
| Hunedoara | 13 | Ploiești | 41 |
| Orăștie | 14 | București | 42 |
| Târgu-Jiu | 15 | Gherghița | 43 |
| Vidin | 16 | Suceava | 44 |
| Calafat | 17 | Baia | 45 |
| Dej | 18 | Roman | 46 |
| Cluj-Napoca | 19 | Bacău | 47 |
| Alba-Iulia | 20 | Buzau | 48 |
| Sebeș | 21 | Brăila | 49 |
| Craiova | 22 | Tulcea | 50 |
| Bistrița | 23 | Chilia | 51 |
| Mediaș | 24 | Turnu Măgurele | 52 |
| Sibiu | 25 | Lviv | 53 |
| Râmnicu Vâlcea | 26 | Cracow | 54 |
| Slatina | 27 | General Source | 55 |
| Târgu-Mureș | 28 |
Once the nodes, edges and their properties are defined, we encode them as an edge list and use UCINET’s (Borgatti, Everett & Freeman 2002)4 Data Language editor to transform them into a matrix representation of the graph. We subsequently analyze the graph, following a multi-scalar top-down approach. Measurements on the network scale reflect the relevance and significance of measures at the micro-scale, while neighbourhood-level measures allow us to capture the immediate context in which individual nodes function. In the following sections, we elaborate on the measures used on each scale and their relevance for this analysis.
3.1 Measures on the macro scale
On a macro scale, Density (Hanneman & Riddle 2014), Transitivity (Holland & Leinhardt 1970) and Degree Centralization (Freeman 1978) give a notion of the system in which the nodes are embedded, hint at potential structural imbalances and indicate which neighbourhood and local measures are relevant (Hanneman & Riddle 2014).
Density is the ratio of existing edges to the total possible connections within the network. It influences the time needed to traverse the network; an aspect captured at node level by the Closeness Centrality. Additionally, low Density implies fewer connections per node, thus low availability of short routes and alternative paths within the system. This phenomenon intensifies in directed networks.
Transitivity represents the probability of any three nodes in the network being connected to each other. In a directed network, only triples of the form A → B → C and A → C count towards this score (Borgatti, Everett & Freeman 2002). A low Transitivity score suggests a higher level of difficulty in bypassing intermediate nodes, emphasizing the significance of the Betweenness Centrality measure and the identification of brokerage roles.
In networks with low Density and Transitivity, the Edge Betweenness (Freeman 1978) identifies the edges that are frequently traversed as part of the shortest paths between any pair of nodes. Under the assumption that merchants typically use the shortest paths, this measure highlights the specific road segments frequently used for transportation. Road segments with high Edge Betweenness are therefore associated with an increased volume of flow (Coronicova & Madaras 2015). The cities located near these roads can become significant trade hubs or otherwise benefit from the flow of goods. Additionally, this measure helps identify potential congestion points or bottlenecks in the trading network.
Centralization indicates the concentration of power or influence within the network. In the context of trade, high Centralization suggests a hierarchical system where a few cities possess significantly more connections than others (Munson & Macri 2009). Such cities may function as major trade hubs, meeting places or distribution centres.
In the context of cross-border trade, the External/Internal (E/I) Index (Krackhardt & Stern 1988) is used to assess the prevalence of intraregional connections over interregional ones. A low score indicates that interregional connections are rare, and therefore potentially advantageous for the nodes involved in them. However, the sizes of the groups and the Density of the network influence this index: the probability of connections between small and large groups increases with the number of connections in the graph. Primarily a network measure, this index can also be applied at node level, indicating individual preference towards outward or inward connections, but the significance test applies only on the level of the entire network.
3.2 Measurements on the meso scale
On the meso scale, we analyse how a node’s position in its neighbourhood affects its independence and opportunities based on its structural Constraint score (Burt 2004).
Constraint measures the extent to which a node’s direct neighbours are connected to each other, potentially excluding ego from the flow of goods. Constraint decreases when the neighbours are not connected to each other. With few alternative trading partners, they must depend on ego for access to the flow of goods. Similarly, if the ego has many connections, the score increases. If a particular neighbour is well connected to all other neighbours on the other hand, it dominates the egonet, increasing the Constraint score (Burt, Kilduff & Tasselli 2013).
3.3 Measurements on the micro scale
On the micro scale, we use Degree, Closeness and Betweenness Centrality (Freeman 1978) to identify nodes with favourable positions within the network. We also analyse the different brokerage roles the nodes take on in this network (Gould & Fernandez 1989).
Degree Centrality allows for the examination of individual connectivity, as it represents the number of connections a node has. In-Degree, the number of incoming ties, indicates the number of suppliers a city has, while Out-Degree indicates the number of destinations available for merchants leaving the city.
Closeness Centrality quantifies the number of edges between the ego and the other nodes in the undirected network and is an indicator of how quickly and conveniently a node can interact with other nodes (Orengo & Livarda 2016). For the directed network, In-Closeness indicates how quickly wares arrive in the target city while Out-Closeness indicates how quickly the transports leaving the city will reach their destination. The strict directionality of the edges has an impact on the In- and Out-Closeness: nodes located closer to the sources exhibit higher Out-Closeness as they have greater accessibility to most cities in the network. Conversely, nodes situated closer to the sinks demonstrate higher In-Closeness Centrality, because they can be reached by almost all nodes. While Levantine wares were shipped from South-East to North-West, European wares were transported in the opposite direction and local wares exchanged hands without consideration of directionality (Pach 2007). Undirected Closeness Centrality is also relevant in this case, as it captures the wider context of trade in the analysed system.
Betweenness Centrality indicates how often a node is part of the shortest path between all pairs of nodes in the network (Freeman 1978). Nodes with high Betweenness can tap into the flow of goods (Pailes 2014), access diverse resources and trade with partners that may not be directly accessible to their neighbours. These nodes occupy a powerful position, which allows them to restrict or redirect the network flow, acting as power brokers (Wang 2010).
When nodes belong to different groups, brokerage can take the form of different roles: In directed networks, a node that regulates the access of external nodes to its own group is known as a Gatekeeper. The Gatekeeper role arises when the flow of interactions occurs from the external group towards the node’s own group. Conversely, when the flow moves in the opposite direction, with the node’s own group reaching out to external nodes, ego is referred to as a Representative. If all three nodes involved belong to distinct groups, ego acts as a Liaison. Finally, a node which mediates the connection between nodes from its own group is called a Coordinator. The normalized scores presented below are calculated as the total number of times a node fulfils a certain role divided by the expected value.
In conclusion, the methodology presented in this section provides a systematic framework for the examination of the trade system’s dynamics and the evaluation of the strategic roles played by different cities within it. The adoption of a network abstraction allows us to transcend the physical real-life context of the system, placing it within the domain of graphs, thereby enabling the analysis of network phenomena across various scales. It is important to note that while this abstraction may temporarily reduce the prominence of geographical features, their significance is reestablished when we interpret the results within the original context. This comprehensive approach equips us with a nuanced understanding of the trade network’s complexities, offering insights into its structural intricacies and the roles that individual cities and routes play within it.
4. Results
The following section presents the findings obtained from the analysis of the trading network structure, along with an overview of the different network positions and roles fulfilled by the nodes.
The directed network contains 55 nodes (see Table 1), out of which 8 nodes are sources and 3 are sinks (see Figures 1 and 2), and 99 edges, with a Centralization of 8.5%, a Density of 3.3%, and a Transitivity of 14.1%.
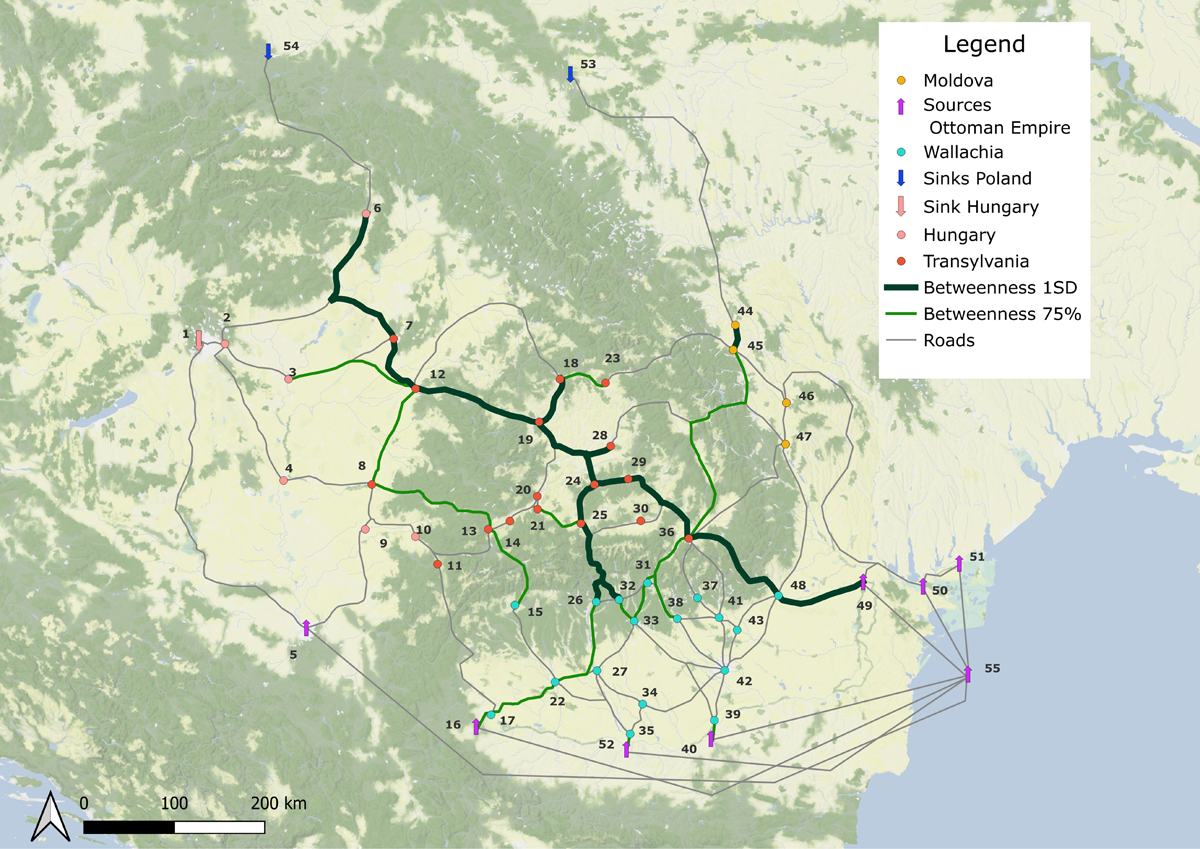
Figure 2
Edges with highest Edge Betweenness. Dark green lines represent edges above the median plus one standard deviation threshold, light green lines represent edges with scores in the upper 75 percentile.
The algorithm for calculating the E/I index forcibly symmetrizes the graph, adding an edge with the opposite direction to every existing directed edge, before running the significance test. In this context, the null hypothesis posits that the actors exhibit no inclination towards in-group or out-group ties. The obtained index, –0.33 indicates a discernible preference for trade within regional borders. This value significantly deviates from the expected value (p < 0.05), so the null hypothesis can be rejected, indicating that cross-border connections are rare and a potential advantage for the nodes involved.
Figure 2 presents the results of the Edge Betweenness measure. Edges that deviate more than one standard deviation above the median, constitute a contiguous core route. The second group encompasses edges scoring between the 75th percentile and the median plus one standard deviation, which forms a peripheral network surrounding the core route.
The table below displays nodes that have surpassed the threshold of the median plus one standard deviation in a minimum of two of the following metrics: In-Degree, Out-Degree, In-Closeness, Out-Closeness, Constraint, and E/I. In the case of the E/I index, both nodes exceeding the upper limit of median plus one standard deviation and nodes falling under the lower limit of median minus one standard deviation are considered. E/I+ indicates a positive index, while E/I– indicates a negative index.
In summary, the results provide a foundation for the interpretation of the network’s dynamics and strategic roles in the subsequent section.
5. Interpretation
Nodes 2, 12, 19, 45 and 47 score high In-Degree and In-Closeness, as shown in Table 2. Those are the characteristics of an ideal meeting place for merchants. The incoming paths with reduced transportation costs and travel time indicate the swift arrival of goods. Simultaneously, the high In-Degree signifies a substantial flow directed towards the city, granting access to a diverse range of goods, and making it an appealing destination for merchants seeking business opportunities and market access. Their role as Coordinators indicates a high level of embedding within their own communities. For nodes 12 and 19, the Betweenness is an additional advantage, as it promotes access to the network flow, despite the latter node’s purely negative E/I index. The proximity of node 12 to sinks 54 and 1, along with its position at a fork in the main trading route (Figure 2) and its role as a Representative suggest that this city might have served as a meeting point for merchants, where wares would change hands, passing from Transylvanian merchants to merchants from Kosice (Pach 2007). Similarly, node 45 enjoys a flexible and unconstrained position, which allows it to leverage its role as a Gatekeeper (Table 2) between Moldova and Transylvania, while node 47 occupies a similar position, boosted by its closeness and international relationships. Despite its positive E/I index, its only outgoing tie leads to a node of the same region. It is thus possible, that the advantages conferred to 47 by its network position, including its role as a Gatekeeper, transfer to 44, which can leverage them on an international level. This interpretation is supported by the letters of Alexander the Good, naming Suceava (44), as the main toll collection point for Moldova (Costachescu 1932).
Table 2
Nodes scoring above the threshold of the median plus one standard deviation in a minimum of two metrics and their respective brokerage roles.
| NODE | MEASURES | ROLE |
|---|---|---|
| 2 | In-Degree, In-Closeness | Coordinator, Gatekeeper |
| 12 | In-Degree, In-Closeness, Betweenness | Coordinator, Representative |
| 19 | In-Degree, In-Closeness, Betweenness, E/I–, Closeness | Coordinator |
| 45 | In-Degree, In-Closeness, Constraint | Coordinator, Gatekeeper |
| 47 | In-Degree, In-Closeness, E/I+, Closeness | Gatekeeper |
| 3 | In-Closeness, E/I+ | Gatekeeper |
| 6 | In-Closeness, E/I+ | Liaison |
| 7 | In-Closeness, E/I+, Out-Degree | Representative |
| 14 | Out-Degree, E/I– | |
| 41 | Out-Degree, E/I– | Coordinator |
| 34 | Out-Closeness, E/I– | Coordinator |
| 39 | Out-Degree, Out-Closeness | Gatekeeper |
| 22 | Out-Degree, Out-Closeness, E/I– | Coordinator |
| 42 | Out-Degree, Out-Closeness, E/I– | Coordinator |
| 8 | In-Degree, E/I+ | Coordinator, Gatekeeper, Representative |
| 27 | In-Degree, E/I– | Coordinator |
| 33 | In-Degree, E/I–, Constraint | Coordinator |
| 26 | In-Degree, Closeness | Representative |
| 48 | In-Degree, Closeness | Liaison, Representative |
| 24 | Betweenness, E/I–, Closeness | Coordinator |
| 29 | Betweenness, E/I– | Coordinator |
| 25 | In-Degree, Betweenness, Closeness | Coordinator, Gatekeeper |
| 36 | In-Degree, Betweenness, Out-Degree, Constraint, E/I+, Closeness | Gatekeeper, Liaison |
High In-Closeness scores associated with positive E/I indices, like in the case of nodes 3, 6, and 7 in Table 2, indicate interregional involvement. Given their positions as Gatekeepers and Liaisons, nodes 3 and 6 must strike a balance between facilitating the flow between Transylvania and Buda and selling their wares at profitable prices. Despite its high Out-Degree, node 7 is limited in its role as a Representative by node 6, which blocks its direct connection to sink. This illustrates how a node can constrain its neighbour, without necessarily occupying a central position. Conversely, the negative E/I indices of nodes 14, 41 and 34, along with their high Out-Degrees and Out-Closeness respectively, indicate relevance at community level. This is underlined by the position of the latter two as Coordinators.
Nodes 39, 22 and 42 exhibit elevated Out-Degree and Out-Closeness scores (Table 2) while maintaining close connections to sources, as seen in Figure 1. This combination signifies their role as distribution centres within the network. With a substantial number of outgoing edges, these nodes can reach a diverse range of customers, while their Out-Closeness contributes to the minimization of transportation costs and time. The reliable deliveries facilitated by these edges consolidate the relationship between them and their clients. Additionally, the short paths between the sources and the centres ensure reliable access to Levantine goods. Because of its direct connection to a source, node 39 can assume the role of a Gatekeeper, in this case facilitating the flow of goods into its own region. With negative E/I indices and fulfilling the roles of Coordinators, nodes 22 and 42 stand out as local distribution centres. The presence of distribution centres enhances the accessibility and availability of Levantine goods throughout the network. Moreover, it serves as a location where merchants can meet, coordinate and exchange information.
As seen in Table 2, nodes 8, 27, 33, 26, and 48 have high In-Degree, indicating reliable access to the network flow. Node 8’s role as a Coordinator may prove particularly advantageous since the central path passes through node 8 without crossing the regional border (Figure 2). As such, the node maintains the flow of goods within its own community for longer. Additionally, it can act as both a Gatekeeper and a Representative for Transylvania and access multiple streams of incoming flow, as indicated by the high E/I index. Nodes 27 and 33 depend on their region to supply them with Levantine wares, as indicated by the negative E/I index, and can only act as Coordinators within their own group. Node 33 has the additional advantage of not being constrained by its group and belonging to a central path (Figure 2), indicating higher independence. For nodes 26 and 48, their respective roles as Representative and Liaison, in combination with high In-Degree and undirected Closeness, as well as their positions along the central path (Figure 2) characterize their roles as significant components of the trading system. While the In-Degree and their positions along the central path (Figure 2) suggests access to Levantine wares specifically, the high Closeness score indicates an overall convenient position for merchants dealing in any kind of wares.
In addition to their other traits, nodes 19, 47, 24, 25 and 36 also exhibit high undirected Closeness (Table 2), making them convenient trading locations, regardless of the type of wares. Without the constraint of directionality, the pool of potential trading partners increases as all nodes can now act as both suppliers and buyers. While this may reduce the possibility of brokerage and control, it may also foster an environment conducive to collaboration and cooperation.
Conversely, a node’s potential influence on the network flow is characterized by its Betweenness Centrality and access to central edges. Particularly in networks with low Density and low Transitivity such as this one, bypassing intermediary nodes is challenging, forcing the flow towards the available shortest-path options.
At the network level, the Edge Betweenness (Figure 2) reveals a prominent trend where routes are consistently oriented from the South-East to North-West. This holds for the undirected network as well; the direction of the individual edges does not change the layout of the central edges. Adjacent nodes occupy favourable network positions, which provides them access to and control over a significant volume of network flow. Nodes 24 and 29 also lie on the core central route, standing out thanks to their high Betweenness score, negative E/I indices and role as Coordinator (Table 2), all indicators of nodes strongly embedded in their group.
Node 25 has high Closeness and high Betweenness, however the mountain range allows it only two connections to Wallachia, limiting its influence as a Gatekeeper, and increasing the significance of its role as a Coordinator. As a city with toll collection and staple rights (Pakucs-Willcocks 2012a), and as a part of the central route which crosses the mountain range, this city positions itself as a competitor to node 36, which controls 6 out of the 8 possible paths across the Carpathians.
While maintaining all the advantages of its neighbourhood position, node 36 also has power on an international level. It’s E/I index is positive and the second largest, indicating a preference for connections outside its own region, high Out-Degree indicates its ability to act as a distributor in the system, while its low constraint indicates independence from its neighbourhood. This strategic position enhances the node’s influence in the international trade of luxury goods and strengthens its position as a key player in the broader network, contributing to its economic growth. The toll collection right and staple right indicate both authority and economic prowess demonstrated through the city’s ability to control the availability and distribution of luxury goods and to purchase them for local consumption.
The combination of these factors solidifies the city’s position as a dominant player in the luxury goods trade, granting it advantageous leverage for negotiations while fulfilling its dual role as a Gatekeeper and intermediary. As a Liaison, node 36 must effectively manage the interests of trading partners from different regions and foster mutually beneficial trade relationships. As a Gatekeeper, it can exercise control and regulate the flow of luxury goods, strategically managing access and exerting influence over the entry, distribution, and availability of such goods.
6. Discussion and Future Perspectives
This work demonstrates that Social Network Analysis (SNA) is a valuable tool for assessing the relevance of settlements based on their connectivity through evidenced roads and paths.
Our main concern is whether we possess sufficient data for drawing meaningful conclusions from SNA, while excluding additional parameters usually considered in archaeological analysis, like transportation cost (capacity, distance, road gradient, accessibility, and risks) and settlement-related factors (size, population density). Our network completion relies on cartographic sources (Pakucs-Willcocks 2019) and the understanding that roads follow river valleys (Rădvan 2007). Nonetheless, the level of abstraction we operate at allows us to evaluate the standalone utility of SNA while also acknowledging that some settlements and pathways may be absent even in our reference case.
We can generally say that the resulting indicators are consistent with the historical evidence. The difference in the value of oriental trade observed in the toll records of Brașov (36) and Sibu (25) (Pakucs-Willcocks 2012b) could be explained by the dissimilarities in their network positions. Additionally, Sibiu’s efforts to gain staple rights might have been supported by its role as a trading centre and as a Gatekeeper. While the Hungarian kings never granted Sibiu the staple right as they did for Brașov, the trading privileges they did grant up until the 15th century fulfilled an equivalent function (Weisz 2018). Via Braylan, a road connecting Brașov to Brăila (49), is often mentioned in various official documents and letters (Hurmuzaki & Iorga 1911). Its significance is reflected in our analysis of the Edge Betweenness scores (see Figure 2).
However, SNA results are not absolute or entirely objective metrics. They indicate relationships and roles of settlements but are influenced by assumptions about completeness and trading principles. They are however less sensitive to uncertainty, given the relativity of SNA metrics.
In our case study of Levantine ware trade in 15th–16th century A.D. Wallachia, Transylvania, and Moldova, we gain insights into the impact of international connections in shaping the region. The distribution of sources and sinks of Levantine wares in the network highlights the strategic positioning of trading centres and influential cities. Future work will quantify stability and further investigate costs associated with travelling along the roads, as well as take factors such as settlement size and population into account.
Reproducibility Statement
This analysis can be reproduced using the edge list, which is found in the appendix.
Appendices
Appendix
| START CITY ID | END CITY ID |
|---|---|
| 2 | 1 |
| 3 | 2 |
| 4 | 2 |
| 5 | 1 |
| 5 | 9 |
| 6 | 2 |
| 6 | 54 |
| 7 | 2 |
| 7 | 3 |
| 7 | 6 |
| 8 | 4 |
| 8 | 12 |
| 9 | 8 |
| 10 | 8 |
| 10 | 9 |
| 11 | 10 |
| 12 | 3 |
| 12 | 7 |
| 13 | 8 |
| 13 | 10 |
| 13 | 11 |
| 14 | 13 |
| 14 | 20 |
| 14 | 21 |
| 15 | 13 |
| 16 | 17 |
| 17 | 11 |
| 17 | 22 |
| 18 | 12 |
| 18 | 23 |
| 19 | 12 |
| 19 | 18 |
| 20 | 19 |
| 21 | 20 |
| 22 | 15 |
| 22 | 26 |
| 22 | 27 |
| 23 | 45 |
| 24 | 19 |
| 24 | 28 |
| 25 | 21 |
| 25 | 24 |
| 26 | 25 |
| 26 | 30 |
| 27 | 26 |
| 27 | 33 |
| 28 | 19 |
| 28 | 47 |
| 29 | 24 |
| 30 | 25 |
| 30 | 29 |
| 31 | 36 |
| 32 | 25 |
| 32 | 26 |
| 33 | 31 |
| 33 | 32 |
| 34 | 27 |
| 34 | 42 |
| 36 | 29 |
| 36 | 30 |
| 36 | 45 |
| 36 | 47 |
| 37 | 36 |
| 38 | 31 |
| 38 | 36 |
| 39 | 33 |
| 39 | 34 |
| 39 | 42 |
| 40 | 39 |
| 41 | 37 |
| 41 | 38 |
| 42 | 33 |
| 42 | 38 |
| 42 | 41 |
| 42 | 43 |
| 42 | 48 |
| 43 | 41 |
| 43 | 48 |
| 44 | 53 |
| 45 | 44 |
| 46 | 45 |
| 47 | 46 |
| 48 | 36 |
| 48 | 47 |
| 49 | 48 |
| 50 | 46 |
| 50 | 49 |
| 51 | 50 |
| 52 | 22 |
| 52 | 27 |
| 52 | 34 |
| 52 | 35 |
| 55 | 5 |
| 55 | 16 |
| 55 | 35 |
| 55 | 40 |
| 55 | 49 |
| 55 | 50 |
| 55 | 51 |
Notes
Competing Interests
The authors have no competing interests to declare.