

Figure 1
A 36‑year‑old female with active Crohn’s disease. (A) Coronal T2 TRUFI image shows ulcerations in the inflamed terminal ileum as focal intraluminal surface defects (arrows). (B) Perimural inflammation with adjacent free fluid is seen (arrow). (C) Fat‑suppressed T2‑sequence demonstrates high mural T2‑signal in the terminal ileum (arrow). (D) The inflamed segment also shows restricted diffusion.
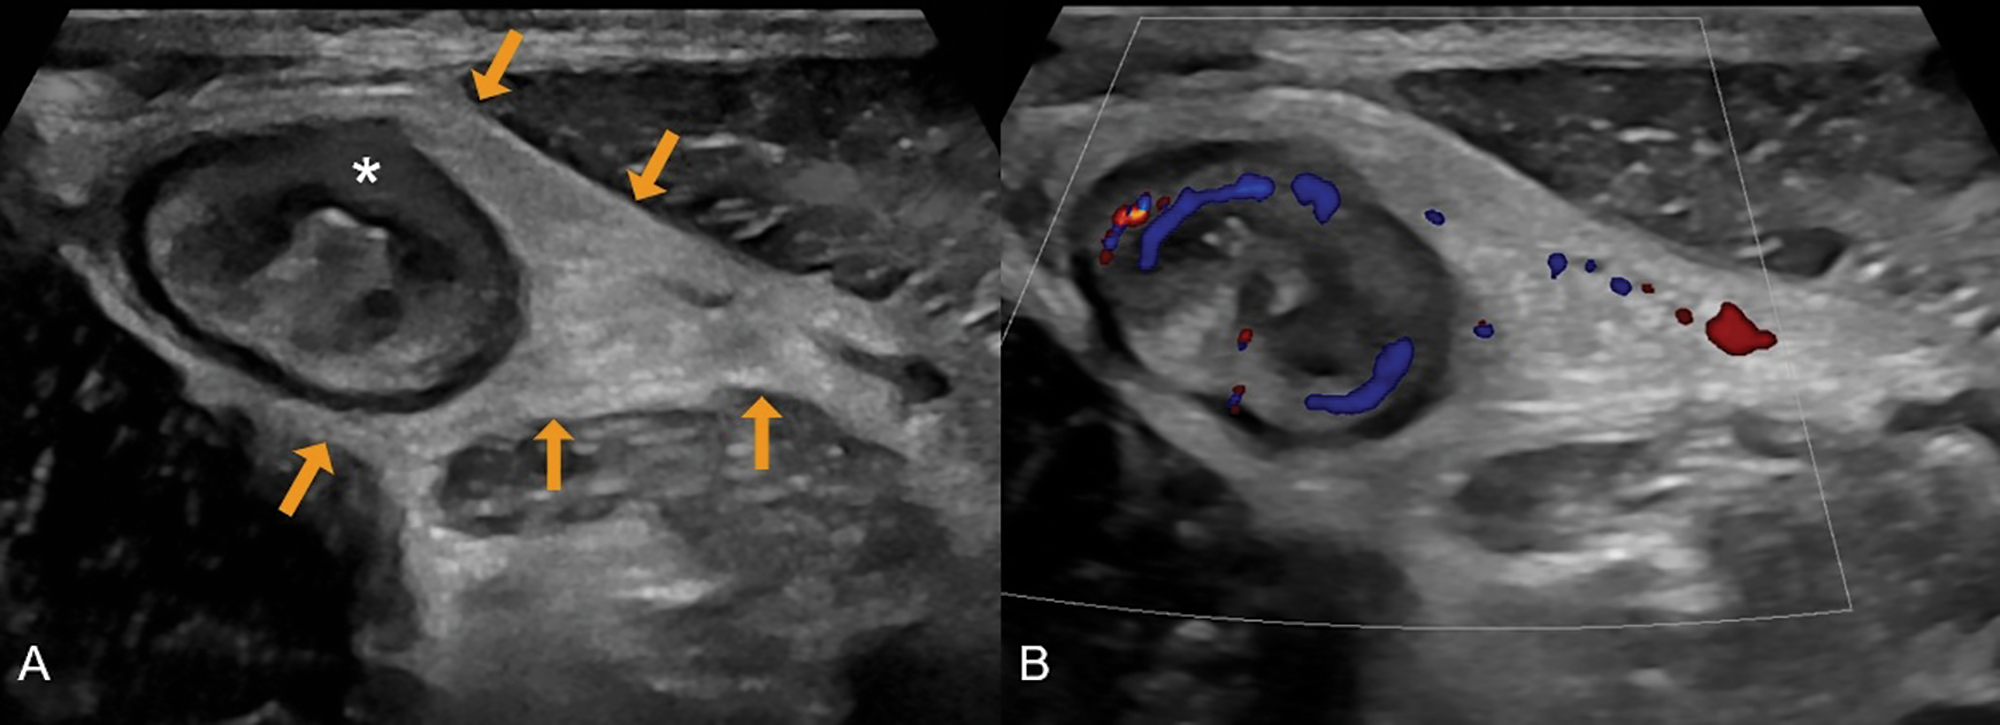
Figure 2
A 31‑year‑old male with newly diagnosed Crohn’s disease. (A) Greyscale ultrasound shows a thickened terminal ileum with extensive loss of mural stratification (asterisk) and hyperechoic fat wrapping (arrows). (B) Colour Doppler demonstrates increased vascularity in the ileal wall and adjacent inflamed fat.

Figure 3
A 44‑year‑old male with Crohn’s disease in the terminal ileum. (A) Coronal T2 TRUFI image shows prestenotic dilatation of 20 mm, below the threshold for a definite stricture (≥30 mm). (B) A single frame from a CINE sequence demonstrates maximal distension of 30 mm, confirming stricturing Crohn’s disease.