
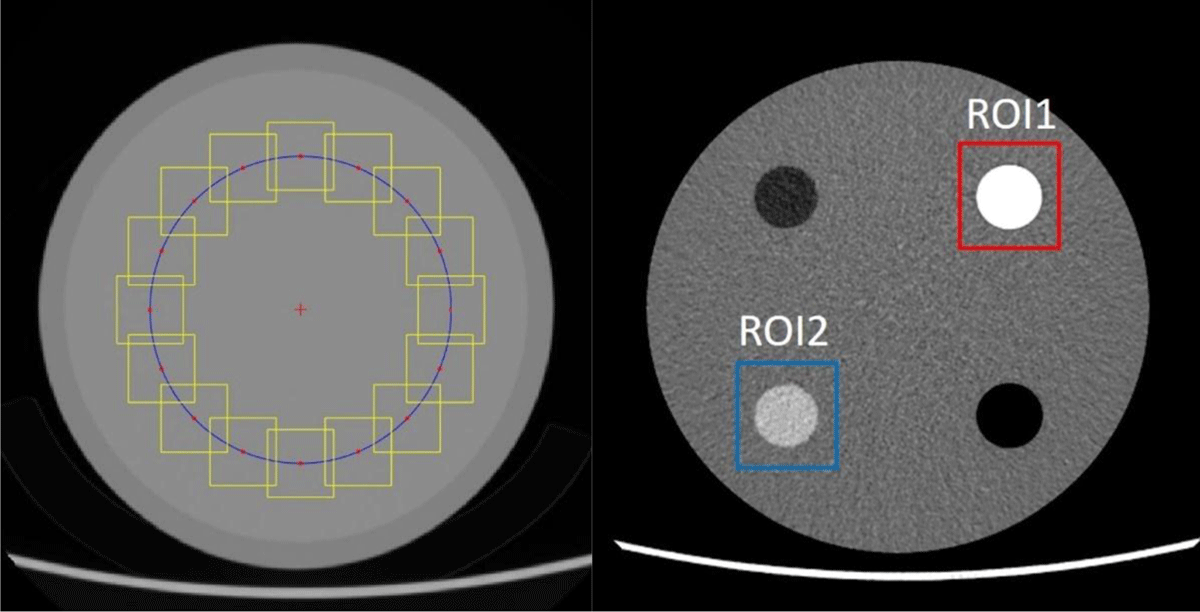
Figure 1
This figure shows (a) noise power spectrum (NPS) and (b) task-based transfer function (TTF) measurement. (a) The red cross represents the center of the phantom section, and the blue circle represents the same distance from the center (red cross). The yellow square represents a voxel of interest (25.78 × 25.78 × 12.50 mm) measuring NPS. (b) TTF was measured in the region of interest (ROI)1 (bone, 955 HU) and ROI 2 (acrylic, 120 HU) cylinder robs.
Table 1
Baseline Characteristics of study population.
| Demographics | |
| Age (years) | 54.4 ± 20.6 |
| Body mass index | 23.1 ± 3.6 |
| Radiation dose | |
| CTDIvol (mGy) | 5.06 ± 1.85 |
| DLP (mGycm) | 281.29 ± 92.69 |
[i] Data are presented as mean±standard deviation.
CTDIvol, volume CT dose index; DLP, dose-length product.

Figure 2
CT images for quantitative analysis of liver (a) AV 30 (b) AV 50 (c) DLIR-L (d) DLIR-M (e) DLIR-H. The body mass index of this patient is 34.3.
FBP, filtered back projection; AV, adaptive statistical iterative reconstruction; DLIR, deep learning-based image reconstruction; DLIR-L, DLIR images with low levels; DLIR-M, DLIR with medium levels.
Table 2
Peaks, average spatial frequencies, area under NPS curve in all reconstructions and doses.
| NPS PEAK (HU2MM2) | |||||||
|---|---|---|---|---|---|---|---|
| CTDIVOL(mGy) | FBP | AV30 | AV50 | AV100 | DLIR-L | DLIR-M | DLIR-H |
| 2.1 | 1.31 | 0.88 | 0.73 | 0.45 | 0.68 | 0.48 | 0.32 |
| 4.2 | 0.75 | 0.54 | 0.45 | 0.29 | 0.37 | 0.27 | 0.2 |
| 6.3 | 0.48 | 0.36 | 0.30 | 0.21 | 0.24 | 0.19 | 0.14 |
| 8.4 | 0.35 | 0.28 | 0.24 | 0.16 | 0.18 | 0.14 | 0.10 |
| 10.5 | 0.31 | 0.25 | 0.22 | 0.16 | 0.17 | 0.14 | 0.11 |
| NPS AVERAGE SPATIAL FREQUENCY (MM–1) | |||||||
| CTDIVOL(mGy) | FBP | AV30 | AV50 | AV100 | DLIR-L | DLIR-M | DLIR-H |
| 2.1 | 0.38 | 0.31 | 0.27 | 0.18 | 0.34 | 0.33 | 0.31 |
| 4.2 | 0.36 | 0.32 | 0.29 | 0.19 | 0.35 | 0.34 | 0.33 |
| 6.3 | 0.37 | 0.33 | 0.29 | 0.19 | 0.35 | 0.34 | 0.32 |
| 8.4 | 0.36 | 0.32 | 0.29 | 0.19 | 0.35 | 0.34 | 0.33 |
| 10.5 | 0.36 | 0.34 | 0.31 | 0.20 | 0.37 | 0.36 | 0.34 |
| NPS AUC | |||||||
| CTDIVOL(mGy) | FBP | AV30 | AV50 | AV100 | DLIR-L | DLIR-M | DLIR-H |
| 2.1 | 178.9 | 114.8 | 80.5 | 27.2 | 91.8 | 66 | 42.7 |
| 4.2 | 99.5 | 64.8 | 46.2 | 17.7 | 49.2 | 35.9 | 24 |
| 6.3 | 66.7 | 43.2 | 31 | 12.4 | 33.1 | 24.5 | 16.6 |
| 8.4 | 49.6 | 32.5 | 23.4 | 9.4 | 24.1 | 17.6 | 11.7 |
| 10.5 | 42 | 27.9 | 20.4 | 8.9 | 21.6 | 16.2 | 11.2 |
[i] FBP, filtered back projection; AV30, and AV50 = ASIR-V with a blending factor of 30% and 50%, respectively; DLIR-L, DLIR-M, and DLIR-H, a deep learning-based image reconstruction with low, medium, or high levels, respectively; NPS, noise power spectrum; AUC, area under the curve.
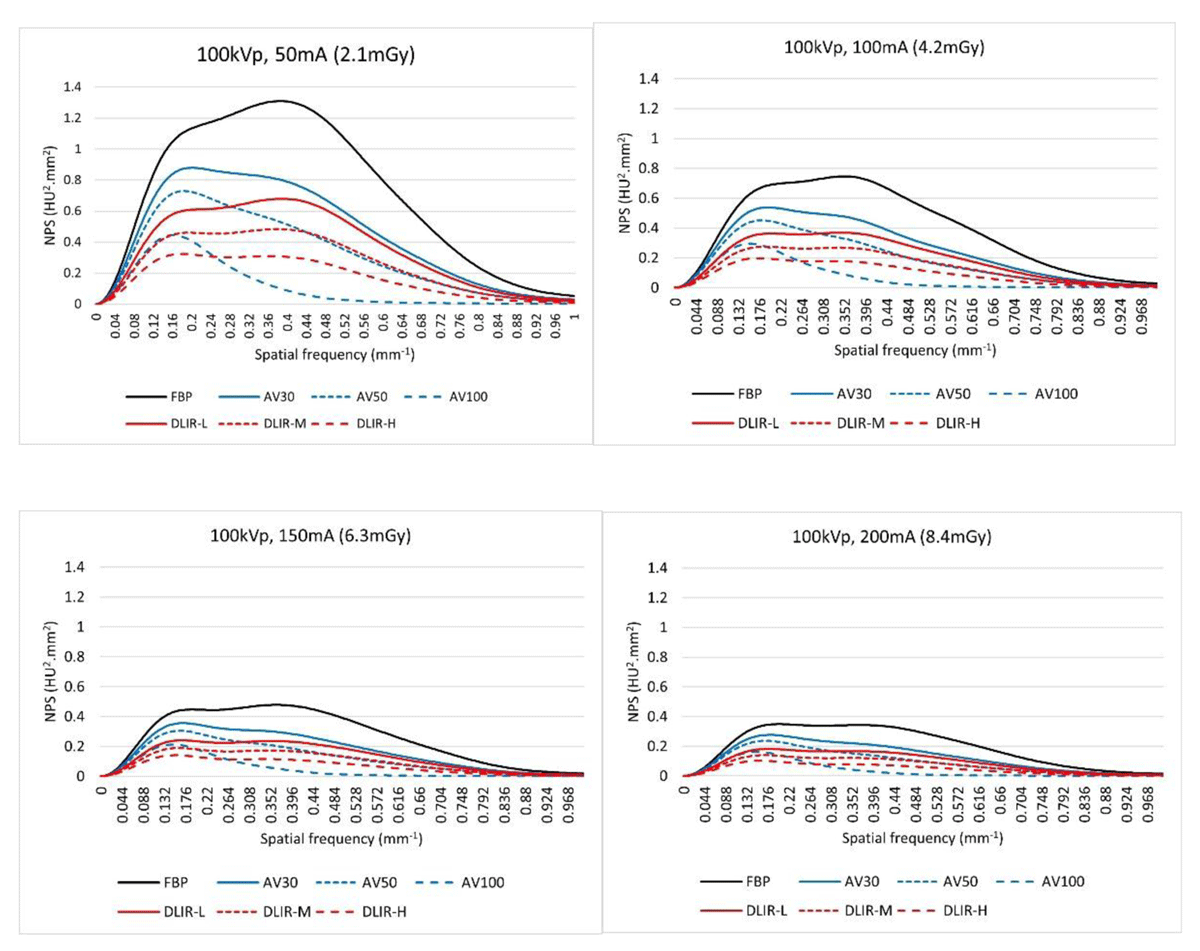
Figure 3
NPS results at different doses and image reconstruction methods: peak kilovoltage (kVp), 100; tube current modulation range 50 mAs (a), 100 mAs (b), 150 mAs (c), and 200mAs (d).
FBP, filtered back projection; AV30, and AV50 = ASIR-V with a blending factor of 30% and 50%, respectively; DLIR-L, DLIR-M, and DLIR-H, a deep learning-based image reconstruction with low, medium, or high levels, respectively; NPS, noise power spectrum.
Table 3
TTF-50s (mm-1) of the 25% ACR phantom CT according to different discs (bone; 955 HU, acrylic; 120 HU) and reconstructions.
| CTDIVOL | TTF50 (MM–1) of ROI1 (BONE) | TTF50 (MM–1) of ROI2 (ACRYLIC) | ||||||||||||
|---|---|---|---|---|---|---|---|---|---|---|---|---|---|---|
| (mGy) | FBP | AV30 | AV50 | AV100 | DLIR-L | DLIR-M | DLIR-H | FBP | AV30 | AV50 | AV100 | DLIR-L | DLIR-M | DLIR-H |
| 2.1 | 0.45 | 0.35 | 0.45 | 0.44 | 0.45 | 0.44 | 0.44 | 0.36 | 0.35 | 0.35 | 0.28 | 0.40 | 0.40 | 0.40 |
| 4.2 | 0.44 | 0.44 | 0.44 | 0.45 | 0.44 | 0.44 | 0.44 | 0.42 | 0.41 | 0.41 | 0.39 | 0.44 | 0.43 | 0.44 |
| 6.3 | 0.44 | 0.44 | 0.44 | 0.45 | 0.44 | 0.44 | 0.44 | 0.36 | 0.35 | 0.35 | 0.36 | 0.37 | 0.38 | 0.41 |
| 8.4 | 0.44 | 0.44 | 0.44 | 0.45 | 0.44 | 0.44 | 0.44 | 0.40 | 0.39 | 0.42 | 0.39 | 0.44 | 0.42 | 0.43 |
| 10.5 | 0.45 | 0.45 | 0.45 | 0.45 | 0.45 | 0.44 | 0.44 | 0.41 | 0.42 | 0.41 | 0.38 | 0.44 | 0.44 | 0.42 |
[i] TTF, task-based transfer function; ACR, American College of Radiology; FBP, filtered back projection; AV30, and AV50 = ASIR-V with blending factors of 30%, and 50%, respectively; DLIR-L, DLIR-M, and DLIR-H, a deep learning-based image reconstruction with low, medium, or high levels, respectively.
Table 4
Mean image noise (HU) according to the image reconstruction method.
| RECONSTRUCTION | FBP | AV30 | AV50 | DLIR-L | DLIR-M | DLIR-H | P-VALUE |
|---|---|---|---|---|---|---|---|
| Liver | |||||||
| HU | 130.46 ± 22.91 | 130.46 ± 22.91 | 130.47 ± 22.91 | 130.63 ± 22.85 | 130.74 ± 22.86 | 130.76 ± 22.86 | 1.000 |
| SD | 25.65 ± 1.81 | 20.03 ± 1.51 | 16.36 ± 1.34 | 18.43 ± 1.56 | 14.40 ± 1.26 | 10.05 ± 1.00 a | <.001 |
| Aorta | |||||||
| HU | 206.21 ± 50.56 | 206.47 ± 50.08 | 206.43 ± 50.07 | 208.01 ± 50.11 | 208.11 ± 50.07 | 206.47 ± 50.08 | 1.000 |
| SD | 27.01 ± 2.51 | 20.72 ± 2.10 | 16.69 ± 1.91 | 19.41 ± 1.97 | 15.13 ± 1.52 | 10.50 ± 1.30 | <.001 |
| Fat | |||||||
| HU | 107.59 ± 17.71 | 107.51 ± 17.73 | 107.49 ± 17.71 | 106.06 ± 19.58 | 106.79 ± 17.55 | 106.58 ± 17.52 | 1.000 |
| SD | 22.56 ± 2.10 | 17.88 ± 1.77 | 14.88 ± 1.64 | 14.82 ± 1.54 | 11.31 ± 1.32 | 7.56 ± 1.18 | <.001 |
[i] Data are presented as mean ± standard deviation. The subscripts represent the same group of post hoc analysis (alphabetical order indicates the order, starting from the lowest mean value). P-values were calculated using repeated-measures ANOVA among the six groups.
FBP, filtered back projection; AV30, ASIR-V with a blending factor of 30%; AV50, ASIR-V with a blending factor of 50%; DLIR-L, DLIR-M, and DLIR-H, deep learning-based image reconstruction images with low, medium, or high strength levels, respectively; HU, Hounsfield unit; SD, standard deviation.
Table 5
Image quality assessment ranking of the image reconstruction methods.
| RECONSTRUCTION | AV30 | AV50 | DLIR-L | DLIR-M | DLIR-H |
|---|---|---|---|---|---|
| Overall image quality | 1.93 ± 1.1 | 1.63 ± 0.78 | 4.04 ± 0.76 | 4.51 ± 0.75 | 2.89 ± 0.84 |
| Noise | 1.18 ± 0.39 | 1.83 ± 0.40 | 2.99 ± 0.09 | 4.00 ± 0.00 | 5.00 ± 0.00 |
| Spatial resolution | 2.18 ± 0.67 | 1.27 ± 0.72 | 4.67 ± 0.57 | 4.19 ± 0.60 | 2.69 ± 0.63± |
[i] Data are mean ranking score ± standard deviation.
FBP, filtered back projection; AV30, ASIR-V with a blending factor of 30%; AV50, ASIR-V with a blending factor of 50%; DLIR-L, DLIR-M, and DLIR-H, a deep learning-based image reconstruction image with low, medium, or high strength levels.