
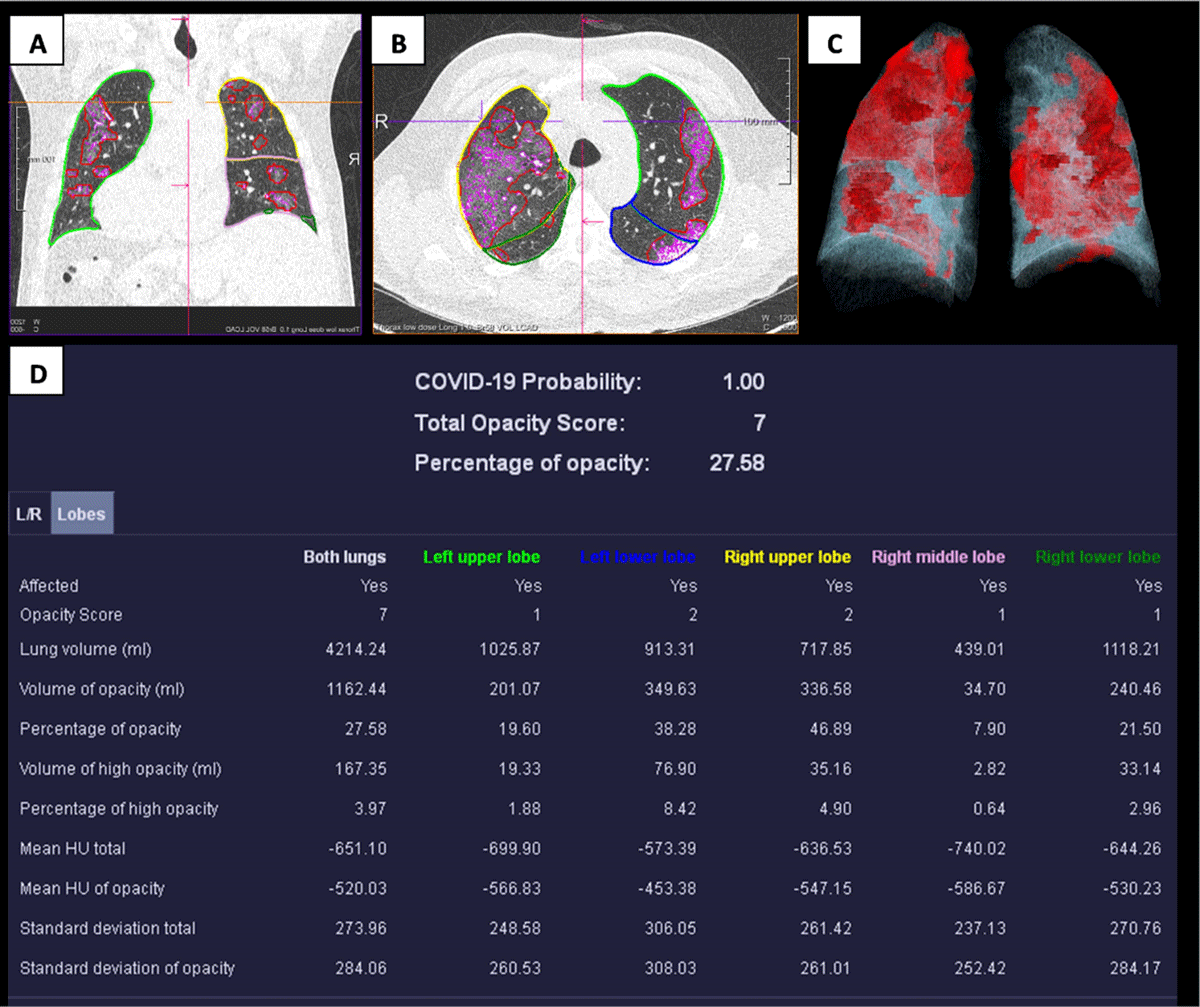
Figure 1
Coronal (A) and axial (B) lung reconstructed CT images with delineation of the lung lobes, fissures, and the opacities performed by software analysis. (C) A 3D view of the lung opacities (in red colour). (D) An overview of the absolute and relative lung involvement per lung or lung lobe, the lung volume as well as a probability index for COVID-19.
Table 1
Summary of Patient Characteristics (n = 182).
| PARAMETER | VALUE; N(%) |
|---|---|
| Sex | |
| Men | 110 (60.4) |
| Women | 72 (39.6) |
| Age (y) | |
| Mean | 65 |
| Standard deviation | 16.22 |
| Range | 22–91 |
| Body mass index (kg/m2) | |
| Mean | 27.4 |
| Standard deviation | 0.47 |
| Range | 10.8–47.1 |
Table 2
Lung involvement severity index.
| LEFT UPPER LOBE N(%) | LEFT LOWER LOBE N(%) | RIGHT UPPER LOBE N(%) | RIGHT MIDDLE LOBE N(%) | RIGHT LOWER LOBE N(%) | TOTAL LUNG VOLUME (ML) | VOLUME OPACITIES (ML) | OPACITY (%) | HIGH OPACITY (%) | |
|---|---|---|---|---|---|---|---|---|---|
| Pneumonia Analysis software: | |||||||||
| Mean | 10.19 | 17.80 | 13.04 | 9.49 | 19.57 | 4142.08 | 492.82 | 13.37 | 3.10 |
| SDD | 15.60 | 20.08 | 20.42 | 16.52 | 22.07 | 1256.66 | 502.83 | 15.08 | 4.60 |
| Range | 0–74.32 | 0–84.95 | 0–100 | 0–84 | 0–94.08 | 1691.97–8179.75 | 0.05–2820.67 | 0–82.23 | 0–29.61 |
| Visual scoring: | |||||||||
| 0: 0% | 22(12.1) | 6(3.3) | 22(12.1) | 35(19.2) | 9(4.9) | ||||
| 1: 0–5% | 77(42.3) | 58(31.9) | 80(44.0) | 80(44.0) | 53(29.1) | ||||
| 2: 5–25% | 49(26.9) | 62(34.1) | 41(22.5) | 40(22.0) | 60(33.0) | ||||
| 3: 25–50% | 26(14.3) | 41(22.5) | 24(13.2) | 21(11.5) | 42(23.1) | ||||
| 4: 50–75% | 8(4.4) | 11(6.0) | 11(6.0) | 4(2.2) | 12(6.6) | ||||
| 5: 75–100% | 0(0.0) | 4(2.2) | 4(2.2) | 2(1.1) | 6(3.3) | ||||
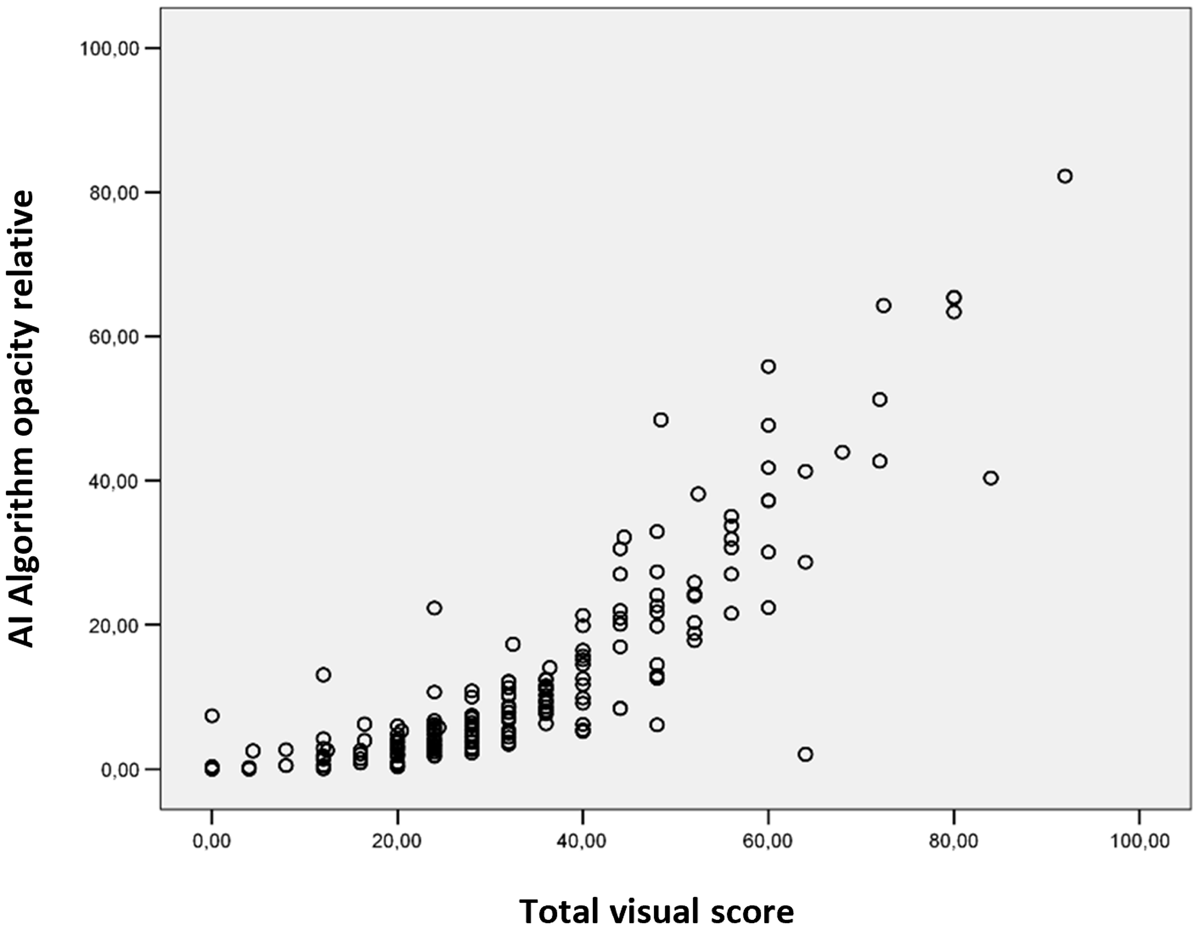
Figure 2
Relative volume of total lung opacity as a function of the visual scoring assessment, illustrating a significant monotonic increasing relation between the qualitative and quantitative scores of lung opacities.
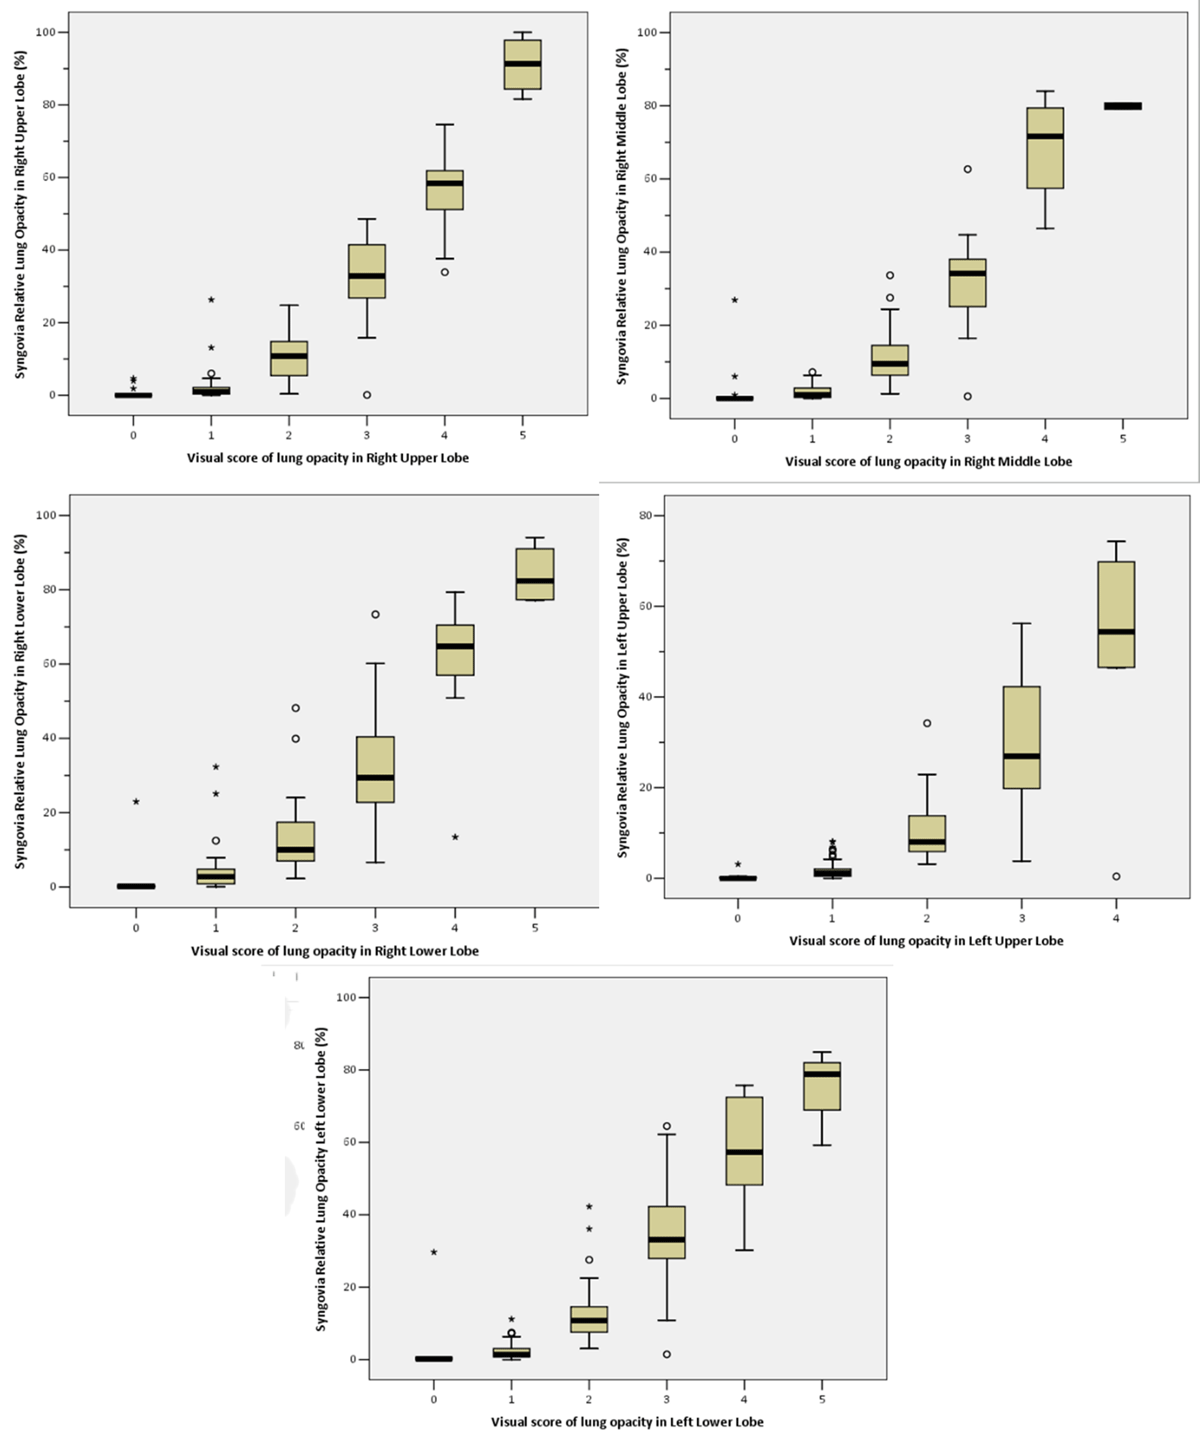
Figure 3
Relative volume of total lung opacity as a function of the visual score for the lung opacity, illustrating a monotonic increasing relation between the qualitative and quantitative scores of lung opacities for each lung lobe separately.