
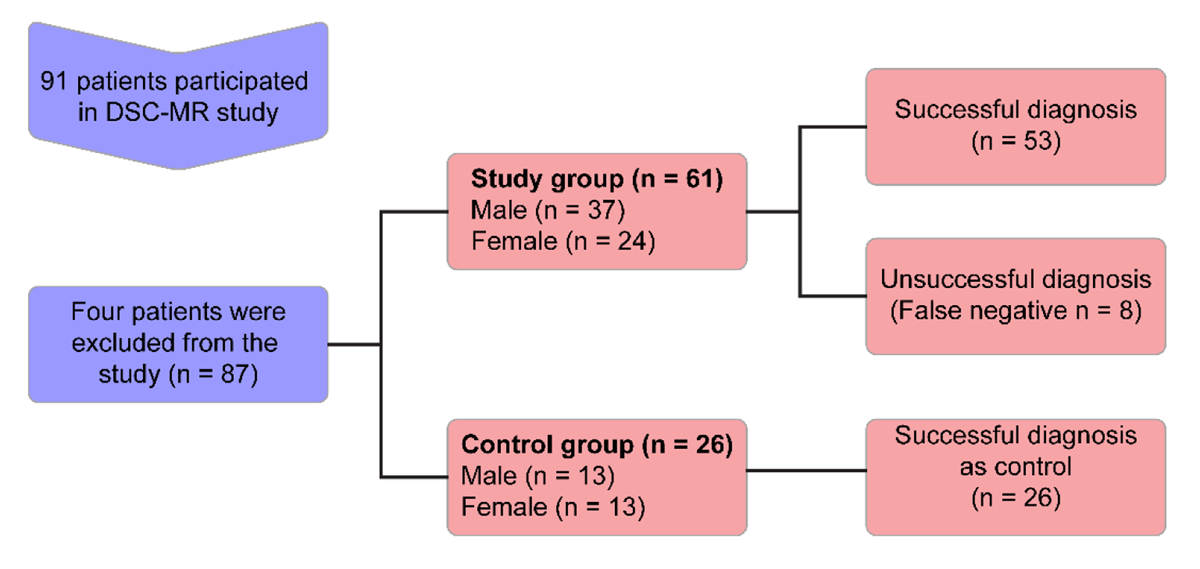
Figure 1
Flow chart of the study.
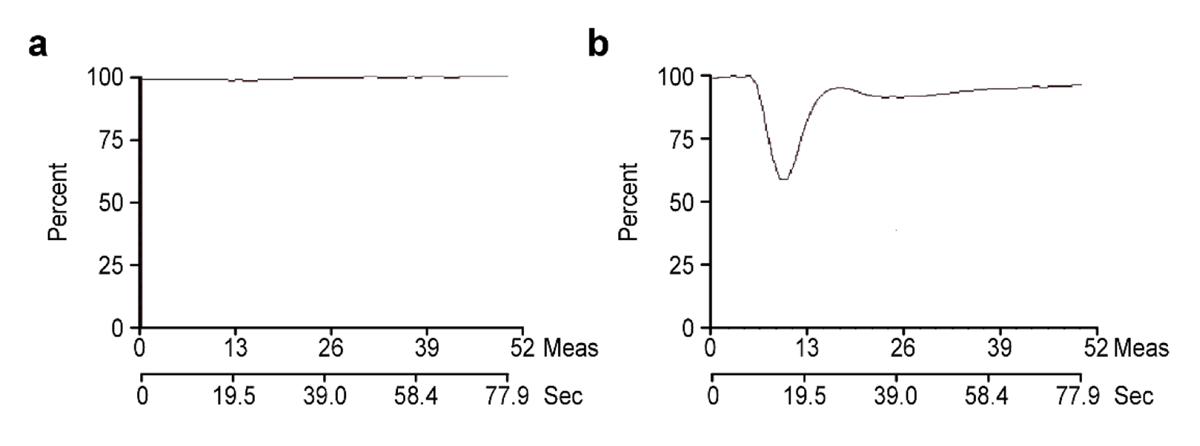
Figure 2
a. The graphic of signal intensity-time course absence of signal loss revealed a linear line and accepted as representing brain death. b. The graphic of signal intensity-time course, 25–30% depression on the signal intensity-time curve reveals normal cerebral perfusion.
Table 1
Brain injury characteristics in the study population on computed tomography (CT) or magnetic resonance (MR) imaging.
| CT or MR Findings | STUDY GROUP | CONTROL GROUP |
|---|---|---|
| Subarachnoid haemorrhage (SAH) | 10 | 6 |
| Parenchymal haemorrhage (PH) +SAH | 14 | 3 |
| Intraventricular haemorrhage (IVH)+PH | 12 | 10 |
| Brain tumor | 1 | 1 |
| Ischemic infarct | 8 | 6 |
| Ischmic haemorrhage | 7 | - |
| PH + Epidural haemorrhage + Cerebral contusion | 4 | – |
| Diffuse Axonal Injury + PH | 5 | – |
| Total | 61 | 26 |
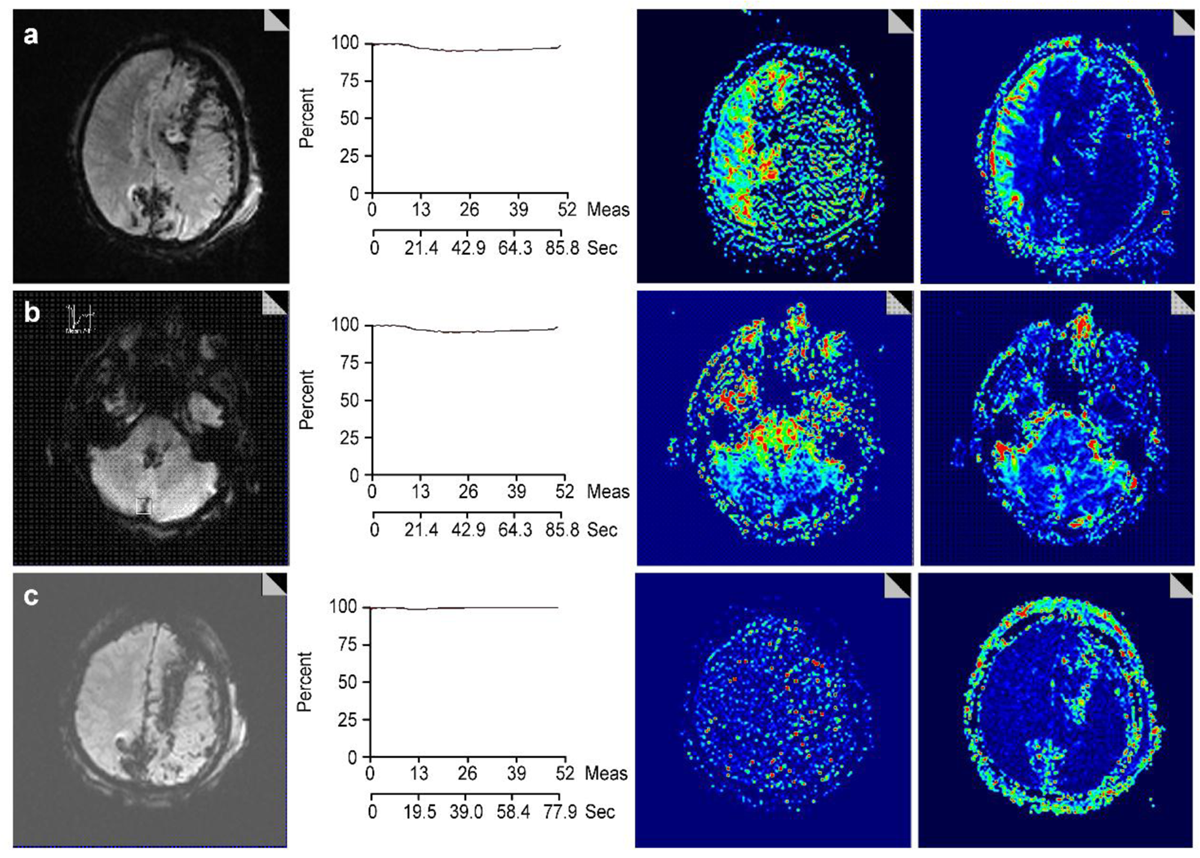
Figure 3
A 28-year-old man was admitted to the intensive care unit after a firearm wound to his left cranium. His Glasgow coma score was 3. a) Axial images magnetic resonance images at the level of the centrum semiovale. From left to right panels: The gradient echo MR image shows the hypointense tractus of the bullet in the left cerebral parenchyma and a midline shift to the right. The perfusion signal-time course shows the presence of diminished perfusion. The mean transit time (MTT) and cerebral blood flow (CBF) maps show perfusion in the right cerebral hemisphere and absence of perfusion in the left hemisphere. b) Axial images were acquired at the level of the pons in the same order as in a): Both the MTT and CBF maps show the presence of perfusion in the cerebellum and the pons. c) A second cerebral MR perfusion examination was performed one day later. Axial images at the level of the centrum semiovale in the same order as in a): The tractus of the bullet in the left cerebral parenchyma remain visible, but the midline shift is less pronounced. The perfusion signal-time course graphic has flattened and both MTT and CBF maps show absence of perfusion in both cerebral hemispheres.
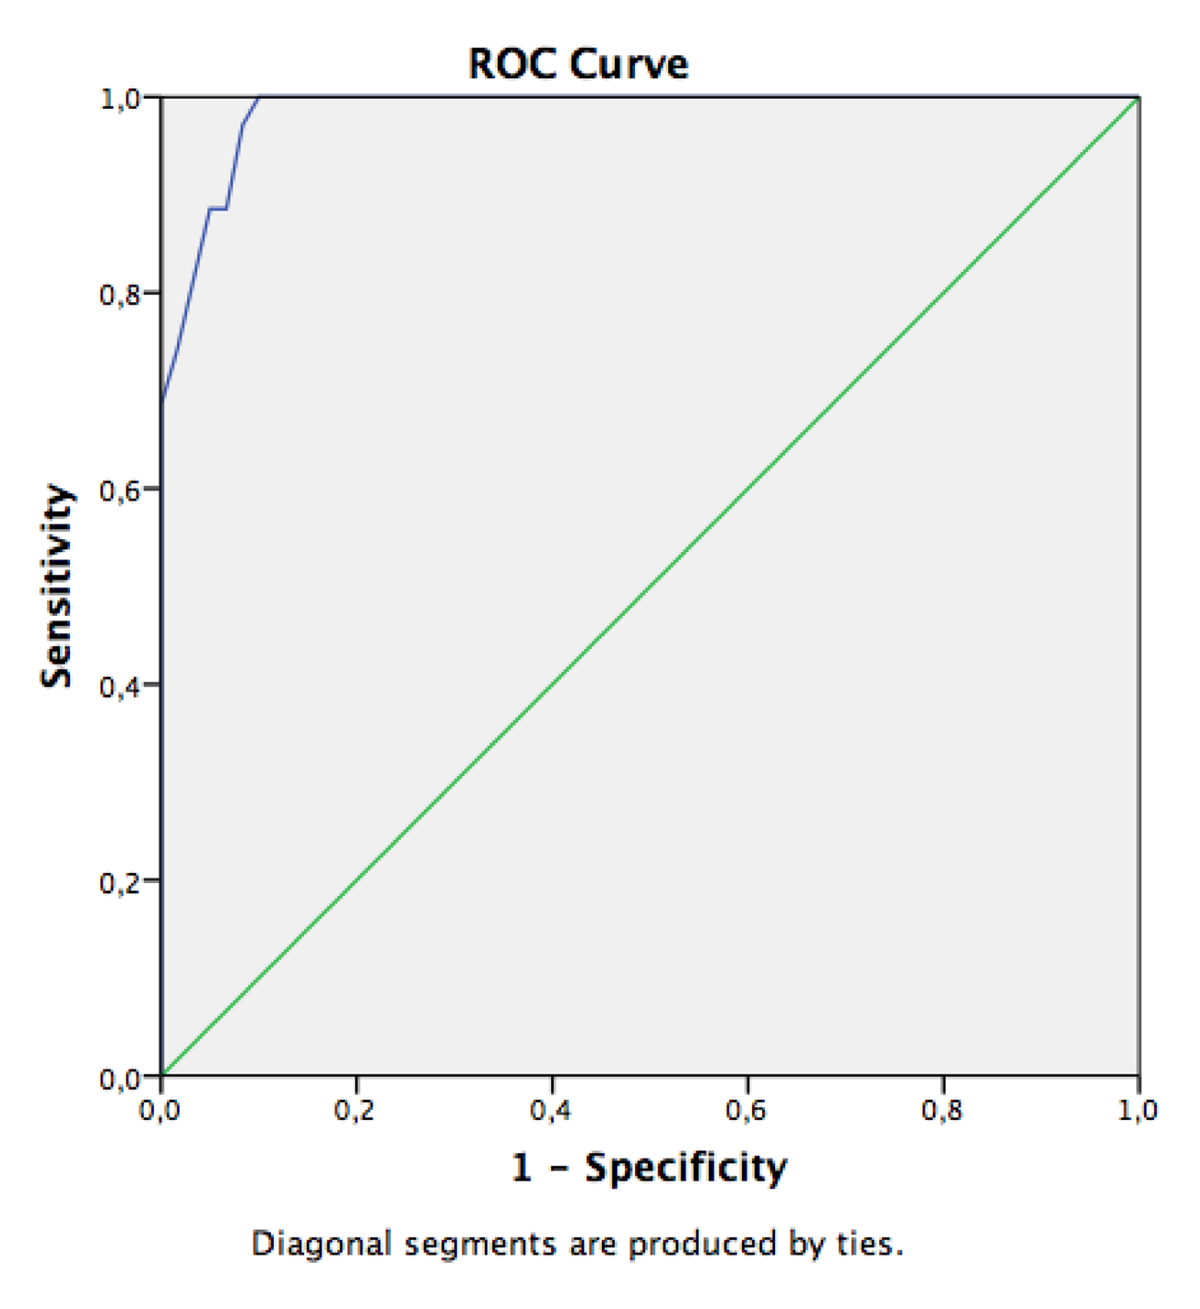
Figure 4
Receiver Operator Characteristics (ROC) of MR perfusion imaging for the diagnosis of brain death. The area under the ROC curve Az is 0.934.