
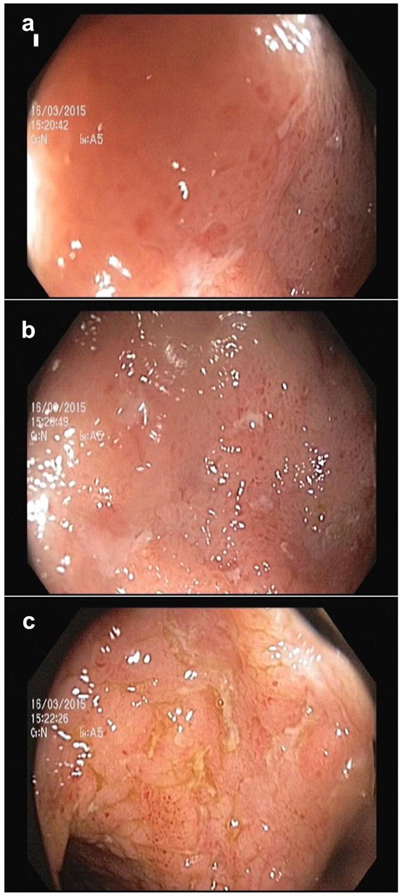
Figure 1
Endoscopic appearances of terminal ileitis with aphthous lesions (a, b) and linear ulcers (c).
Table 1
MR enterography protocol.
| Sequence | TR/TE (msec) | ST/gap (mm) | Matrix | SENSE factor | FOV (cm) | NEX | FA |
|---|---|---|---|---|---|---|---|
| SSFSE (T2W) | 710–800/130 | 6/0 | 320 × 224 | 2 | 47 | 1 | NA |
| 2D FIESTA (fat-sat) | 4/2 | 6/0 | 288 × 256 | 2 | 42 | 1 | 75° |
| DWI (b:0, 800 sec/mm2) | 6000/70 | 6/1 | 160 × 224 | NA | 46 | 4 | 90° |
| LAVA (fat-sat T1W)* | 6.1–6.4/1.9 | 4/1 | 320 × 192 | NA | 40 | 1 | 12° |
[i] Abbreviations: MR, magnetic resonance; ST, slice thickness; SENSE, sensitivity encoding; TR/TE, repetition time/echo time; FOV, field of view; NEX, number of excitations; FA, flip angle; SSFSE, single shot fast spin echo; T2W, T2-weighted; fat-sat, fat saturated; 2D FIESTA, two-dimensional fast imaging employing steady-state acquisition; DWI, diffusion-weighted imaging; LAVA, liver acquisition with volume acquisition, NA, not applicable.
* before and after gadolinium contrast administration.
Total scan duration: 25 minutes; frequency encoding direction: right to left; acquisition planes are coronal and axial in all sequences; all sequences were performed with respiratory triggering except for the T1W imaging which was obtained breath-held.
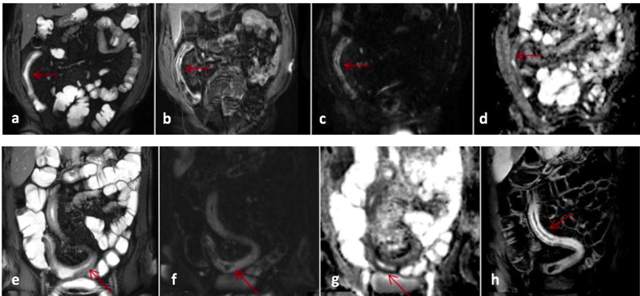
Figure 2
MR images of a patient with Crohn’s disease involving distal ileum (a–e) and another patient with involvement of a long segment of distal ileum and ileocecal junction (e–h). The images of the first patient show wall thickening and mural T2 hyperintensity on coronal FIESTA image (a), contrast enhancement along thickened ileal wall (b), mural diffusion restriction as suggested by DWI hyperintensity (c) with corresponding signal decrease along thickened ileal wall on ADC mapping (d). The images of the second patient show diffuse mural T2 signal increase with ileal wall thickening on coronal FIESTA image (e), mural DWI hyperintensity along involved ileal segment (f) with corresponding mural hypointensity on ADC mapping consistent with restricted diffusion (g) and mural contrast enhancement after intravenous gadolinium (h).
Table 2
Demographic and clinical characteristics of the study patients.
| Characteristic | n = 54 |
|---|---|
| Female gender | 29 (53.7%) |
| Age, years (mean ± SD) | 39.9 ± 14.2 |
| Length of involved segments, cm (mean ± SD) | 14.7 ± 11.2 |
| Duration of the disease, years (mean ± SD) | 4.6 ± 4.9 |
| Time between MRE and colonoscopy, days (mean ± SD) | 18.0 ± 19.7 |
| Location of Crohn’s disease | |
| Ileum | 12 (22.2%) |
| Colon | 10 (18.5%) |
| Ileum and colon | 32 (59.3%) |
| Behavior of Crohn’s disease | |
| Non-stricturing, non-penetrating | 26 (48.1%) |
| Stricturing | 4 (7.4%) |
| Penetrating | 24 (44.4%) |
| CDAI, (mean ± SD) | 224.4 ± 122.1 (18–548) |
| Receiving any medication for CD* | 36 (66.6%) |
| CRP, mg/dl (mean ± SD) | 2.31 ± 2.89 |
[i] Unless otherwise stated, data presented as number (percentage).
* Receiving one of the following medications or a combination: azathioprine, 5-aminosalicylic acid, biological therapy, or steroids.
The normal limit of CRP in our laboratory was <5 mg/L.
CDAI, Crohn’s Disease Activity Index; CRP, C-reactive protein; CD, Crohn’s disease; SD, standard deviation; MRE, magnetic resonance enterography.
Table 3
Comparison of patients with inactive/mild versus moderate/severe disease based on SES-CD in terms of conventional MRE and DWI parameters.
| SES-CD < 7 (Inactive/mild CD) n = 28 | SES-CD > 7 (Moderate/severe CD) n = 26 | p | |
|---|---|---|---|
| Conventional MRE parameters | |||
| Wall thickness | |||
| Mild (0–4 mm) | 6 (21.4%) | 8 (30.8%) | 0.545 |
| Moderate (5–7 mm) | 9 (32.2%) | 10 (38.4%) | |
| Marked (>7 mm) | 13 (46.4%) | 8 (30.8%) | |
| Mean mural T2 hyperintensity (score) | 1.68 ± 0.77 (1–3) | 2.19 ± 0.69 (1–3) | 0.013 |
| Mild (dark grey) | 14 (50.0%) | 4 (15.4%) | |
| Moderate (light grey) | 9 (32.1%) | 13 (50.0%) | |
| Marked (grey-white) | 5 (17.9%) | 9 (34.6%) | |
| Contrast enhancement | |||
| Mild (mucosal) | 1 (3.6%) | 1 (3.8%) | 0.789 |
| Moderate (transmural) | 13 (46.4%) | 10 (38.5%) | |
| Marked (transmural and serosal) | 14 (50.0%) | 15 (57.7%) | |
| Mean DWI score | 2.42 ± 0.58 (1–3) | 2.04 ± 0.69 (1–3) | 0.037 |
| Mild | 6 (21.4%) | 1 (3.8%) | |
| Moderate | 15 (53.6%) | 13 (50.0%) | |
| Marked | 7 (25.0%) | 12 (46.2%) | |
| DWI plus T2 score > 3 | 13 (46.4%) | 13 (88.5%) | 0.001 |
| DWI plus T2 score > 4 | 6 (21.4%) | 14 (53.8%) | 0.014 |
| ADC | 1.5 ± 0.4 (0.9–2.5) | 1.2 ± 0.3 (0.6–1.8) | 0.003 |
[i] SES-CD, Simple Endoscopic Score for Crohn’s Disease; MRE, magnetic resonance enterography, DWI, diffusion-weighted imaging; ADC, apparent diffusion coefficient.
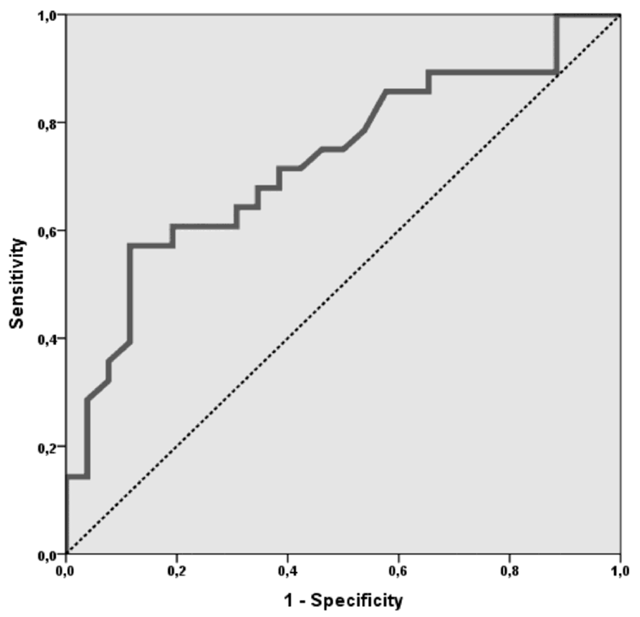
Figure 3
ROC curve of ADC for diagnosing SES-CD-based moderate to severe CD activity.
Table 4
Diagnostic performance parameters for MRE and DWI in predicting SES-CD based moderate to severe disease.
| Sensitivity (%) | Specificity (%) | PPV (%) | NPV (%) | Diagnostic Accuracy (%) | |
|---|---|---|---|---|---|
| ADC < 1.47 × 10⁻³ mm2/sec | 88.5 (23/26) | 57.1 (16/28) | 65.7 (23/35) | 84.2 (16/19) | 72.22 (39/54) |
| T2 hyperintensity score > 1 | 84.62 (22/26) | 50.00 (14/28) | 61.11 (22/36) | 77.78 (14/18) | 66.67 (26/54) |
| T2 hyperintensity score > 2 | 34.62 (9/26) | 82.14 (23/28) | 64.29 (9/14) | 57.50 (23/40) | 59.26 (32/54) |
| DWI score > 1 | 96.15 (25/26) | 21.43 (6/28) | 53.19 (25/47) | 85.71 (6/7) | 57.41 (31/54) |
| DWI score > 2 | 46.15 (12/26) | 75.00 (21/28) | 63.16 (12/19) | 60.00 (21/35) | 61.11 (33/54) |
| DWI plus T2 score > 3 | 88.46 (23/26) | 53.57 (15/28) | 63.89 (13/36) | 83.33 (15/18) | 70.37 (38/54) |
| DWI plus T2 score > 4 | 53.85 (14/26) | 78.57 (22/28) | 70.00 (14/20) | 64.71 (22/34) | 66.67 (36/54) |
[i] SES-CD, Simple Endoscopic Score for Crohn’s Disease; MRE, magnetic resonance enterography, DWI, diffusion-weighted imaging; ADC, apparent diffusion coefficient; PPV, positive predictive value; NPV, negative predictive value.