
Table 1
Descriptive data and model-implied correlations between focal variables calculated on the overall sample.
| M | SD | (1) | (2) | (3) | (4) | (5) | (6) | (7) | (8) | (9) | ||
|---|---|---|---|---|---|---|---|---|---|---|---|---|
| (1) | National narcissism | – | – | – | ||||||||
| (2) | National narcissism – item 1 | 4.18 | 3.22 | .85 | - | |||||||
| (3) | National narcissism – item 2 | 4.81 | 3.01 | .81 | .69 | – | ||||||
| (4) | National narcissism – item 3 | 4.14 | 3.21 | .89 | .76 | .72 | – | |||||
| (5) | Political orientation | 4.80 | 2.28 | .36 | .31 | .29 | .33 | – | ||||
| (6) | National identification | 7.44 | 2.64 | .49 | .41 | .39 | .44 | .30 | – | |||
| (7) | Sex | 1.51 | 0.50 | –.01 | –.01 | –.01 | –.01 | –.05 | .05 | – | ||
| (8) | Age | 46.66 | 15.92 | .04 | .04 | .03 | .04 | <–.01 | .13 | –.07 | – | |
| (9) | Socioeconomic status (SES) | 5.48 | 1.85 | .10 | .08 | .08 | .09 | –.05 | .01 | .07 | –.03 | – |
[i] Note. Due to the extremely large sample (N = 15,882), conventional significance thresholds are not marked as even meaningless correlations (e.g., r = .02) emerge statistically significant. Since NN is a latent variable, its M and SD are not presented.
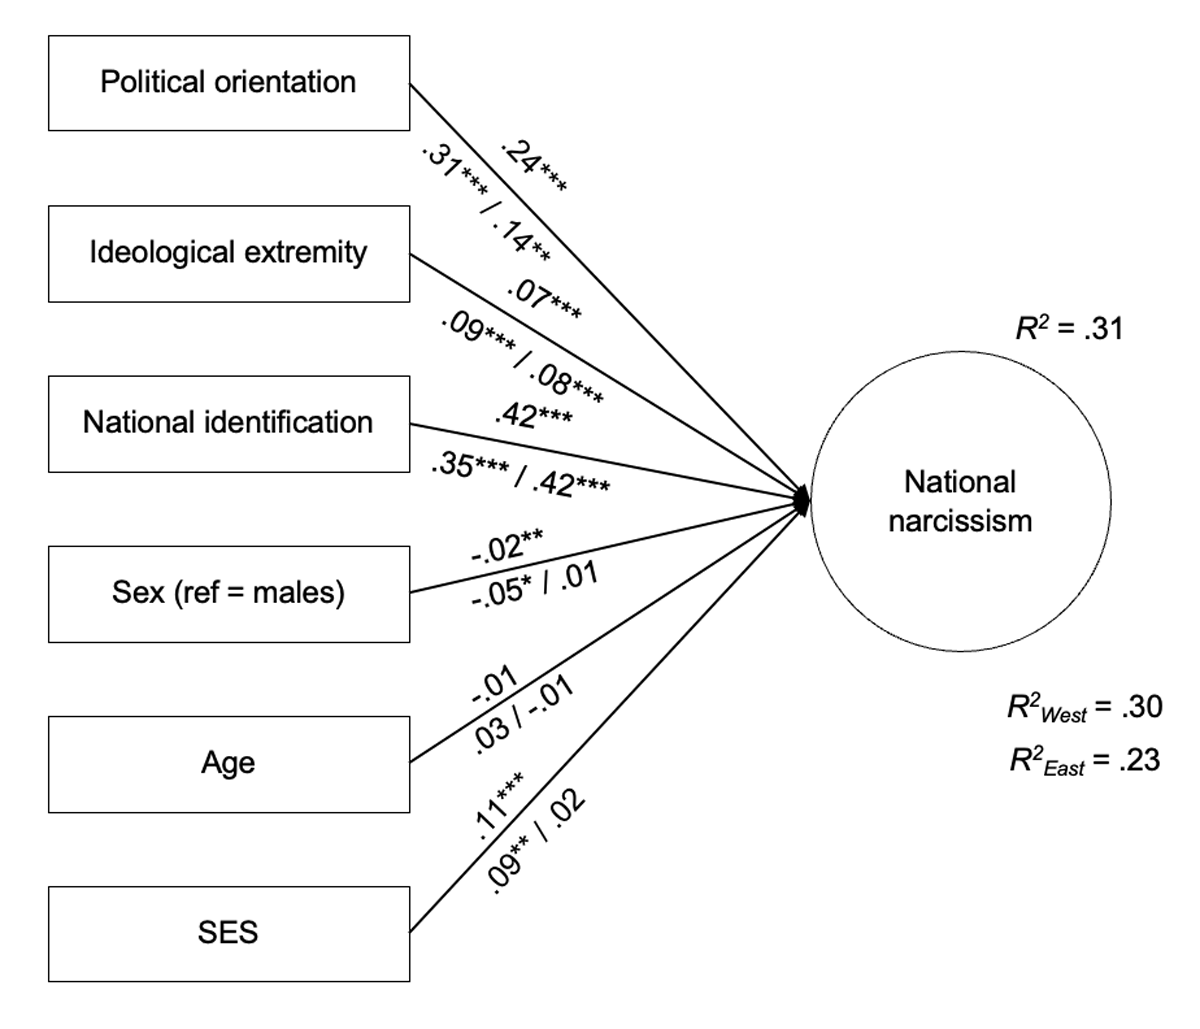
Figure 1
Political orientation and extremity as predictors of national narcissism.
Note. Estimates obtained on the overall sample are presented above the paths, while estimates exhibited below the paths were obtained on the samples from Western (n = 9,924) and Eastern European (n = 5,958) countries, respectively. ***p < .001, **p < .01, *p < .05.
Table 2
Results of invariance testing of the model predicting national narcissism across Western and Eastern European countries.
| Δχ2 | df | p | CFI | robust RMSEA | SRMR | |
|---|---|---|---|---|---|---|
| Configural invariance | – | – | – | .993 | .030 | .008 |
| Weak invariance | 4.43 | 2 | .109 | .993 | .030 | .009 |
| Strong invariance | 0.78 | 2 | .679 | .992 | .024 | .011 |
| Invariance of regression slopes | 25.53 | 6 | <.001 | .986 | .031 | .020 |
[i] Note. Invariance was tested using a robust maximum likelihood estimator (MLR, Brosseau-Liard & Savalei, 2014; Brosseau-Liard, Savalei, & Li, 2012).

Figure 2
Quadratic relationship between political orientation and national narcissism (based on the constrained gam model on data comprising imputed missing values) in Eastern European countries (n = 5,996, left side of the figure) and Western European countries (n = 10,101, right side of the figure).