
Table 1
Variables and coding.
| VARIABLE | LABEL | CODING |
|---|---|---|
| Year | Year | 2002, 2007, 2012, 2017 |
| Gender | Gender | 0 = Man, 1 = Woman |
| Ethnic, Racial, or Immigrant (ERI) Minority Status | ERI | 0 = Non-Minority, 1 = Minority |
| Election Success | Won | 0 = Lost, 1 = Won |
| Prior Election Success | pWon | 0 = Lost, 1 = Won |
| Margin of Win or Loss | Margin_WinLoss | –100 to 100 (continuous) |
| Prior Margin of Win or Loss | pMargin_WinLoss | –100 to 100 (continuous) |
| Same Candidate as Prior Election | SameCand | 0 = Different, 1 = Same |
| PARTY CODE (N TOTAL) | INCLUDED PARTY LISTS | |
| COM (2062) | Parti Communiste Français (PCF) n = 1506; Front de Gauche (FDG) n = 556 | |
| DIV (4341) | Liste Divers, candidates identifying as neither left or right leaning and not officially associated with a party. (Independent) | |
| DVD (2832) | Divers Droite, candidates identifying as right leaning but not officially associated with a party. (Independent Right) | |
| DVG (1454) | Divers Gauche, candidates identifying as left leaning but not officially associated with a party. (Independent Left) | |
| ECO (4418) | Parti Écologiste (PE ou PÉ), Europe Écologie Les Verts (EELV) | |
| EXD (1321) | Extrême Droite | |
| EXG (4922) | Extrême Gauche n = 4365; France Insoumise (FI) n = 557 | |
| FN_RN (2265) | Front National n = 571; Rassemblement National n = 1694 | |
| MODEM (1143) | Le Mouvement démocrate (MoDEM or MDM) n = 925; Union pour la démocratie française (UDF) n = 218 | |
| NC_UDI (436) | Union des Démocrates et Indépendants (UDI) n = 146; Les Centristes – Le Nouveau Centre (LC or NC) n = 105; Parti Radical Valoisien (PRV) n = 100; Parti Social Libéral Européen (PSLE) n = 85 | |
| PRG (34) | Party Radical de Gauche (PRG) n = 278; Radical de Gauche (RDG) n = 62 | |
| REG (147) | Régionalistes or Autonomistes (only in 2017) | |
| REM (533) | République en Marche n = 468; Le Mouvement Démocrate (MoDEM) n = 65, (only in 2017) | |
| SOC (1786) | Parti Socialiste (PS or SOC) | |
| UMP_LR (2461) | Union pour un Mouvement Populaire (UMP) n = 1588; Les Républicains (LR) n = 481; Debout la France (DLF) n = 392 | |

Figure 1
Proportion of women (left) and ERI minority candidates (right) running versus winning over time for all parties combined (a), and for the three main political parties (b).
Note. All parties (a), n = 30,461. Major parties REM, SOC, UMP_LR (b), n = 4,780. Includes overseas circumscriptions.

Figure 2
Proposed SEM Mediation Models for Gender (a) and ERI Status (b) With Winnability Modeled as a Latent Factor.
Note. a = glass cliff – being a woman or ERI minority predicts seat winnability, b = seat winnability predicts election success, c = effect of being a woman or ERI minority on election outcomes not accounting for lower seat winnability, and c’ = while accounting for lower seat winnability.

Figure 3
Standardized Path Coefficients by Party for the Effect of Being a Woman on Election Success Mediated by Seat Winnability for Each Election Year.
n.s = non-significant, p-values: * = < 0.05; ** = < 0.01.
Note. a = glass cliff – gender predicts seat winnability, b = seat winnability predicts election success, c = gender predicts election chances not accounting for seat winnability, and c’ = while accounting for seat winnability. The dotted line (red) = significant difference between parties; Solid line (green) = non-significant difference between parties. Includes overseas.

Figure 4
Percentage of Women Elected by Party and Year.

Figure 5
Standardized Path Coefficients by Party for the Effect of ERI Minority Status on Election Success Mediated by Seat Winnability for Each Election Year.
n.s = non-significant, p-values: * = < 0.05; ** = < 0.01.
Note. a = glass cliff effect –minority status predicts seat winnability, b = seat winnability predicts election success, c = minority status predicts election chances not accounting for seat winnability, and c’ = while accounting for seat winnability. Dotted line (red) = significant difference between parties; Solid line (green) = non-significant difference between parties. † = significant indirect effect of winnability on election success for ERI minority candidates with no significant direct (c) or total (c’) effects. Overseas circumscriptions excluded.
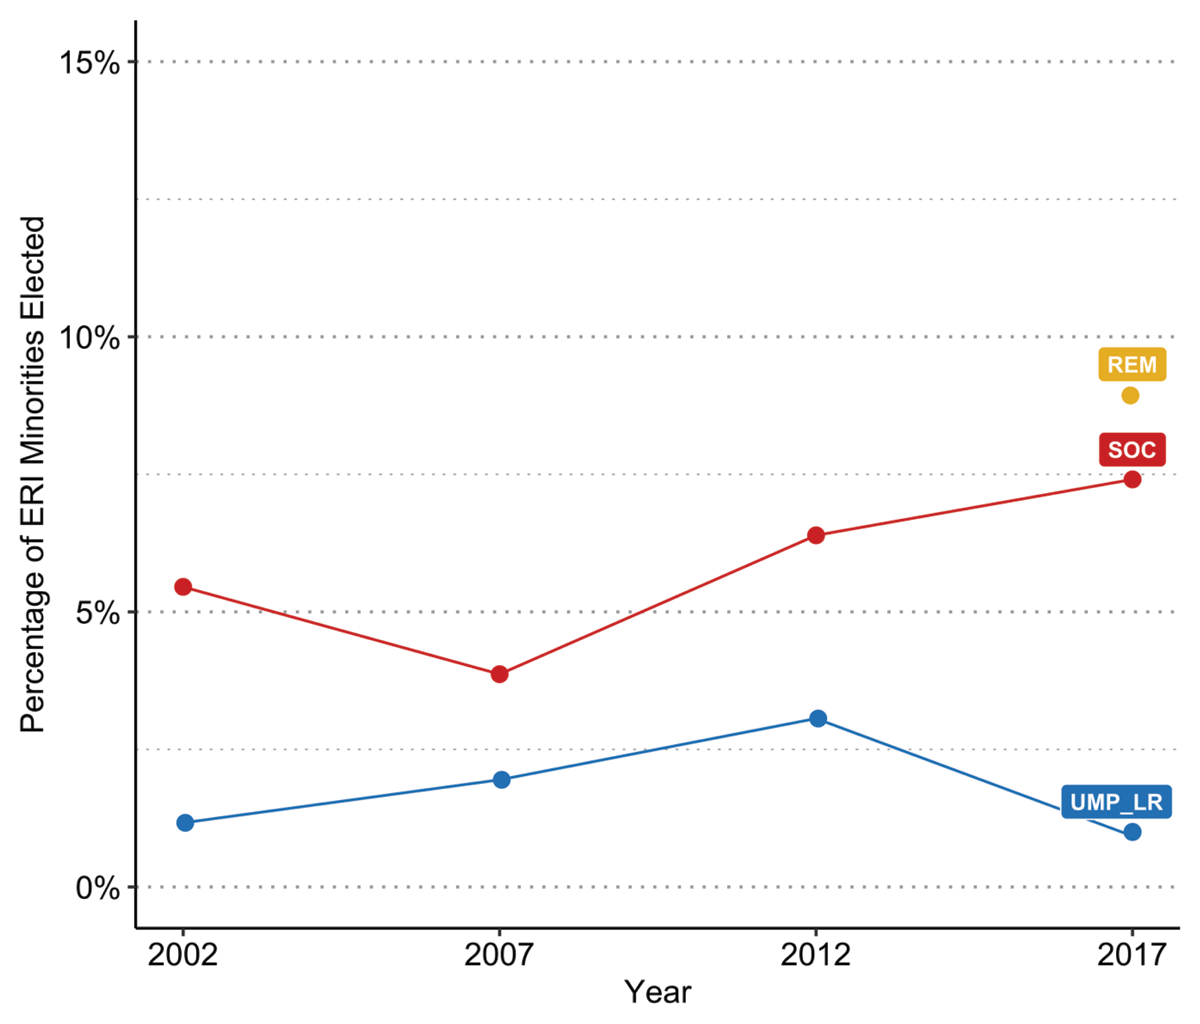
Figure 6
Percentage of ERI Minorities Elected by Party and Year.
Note. Overseas circumscriptions excluded.
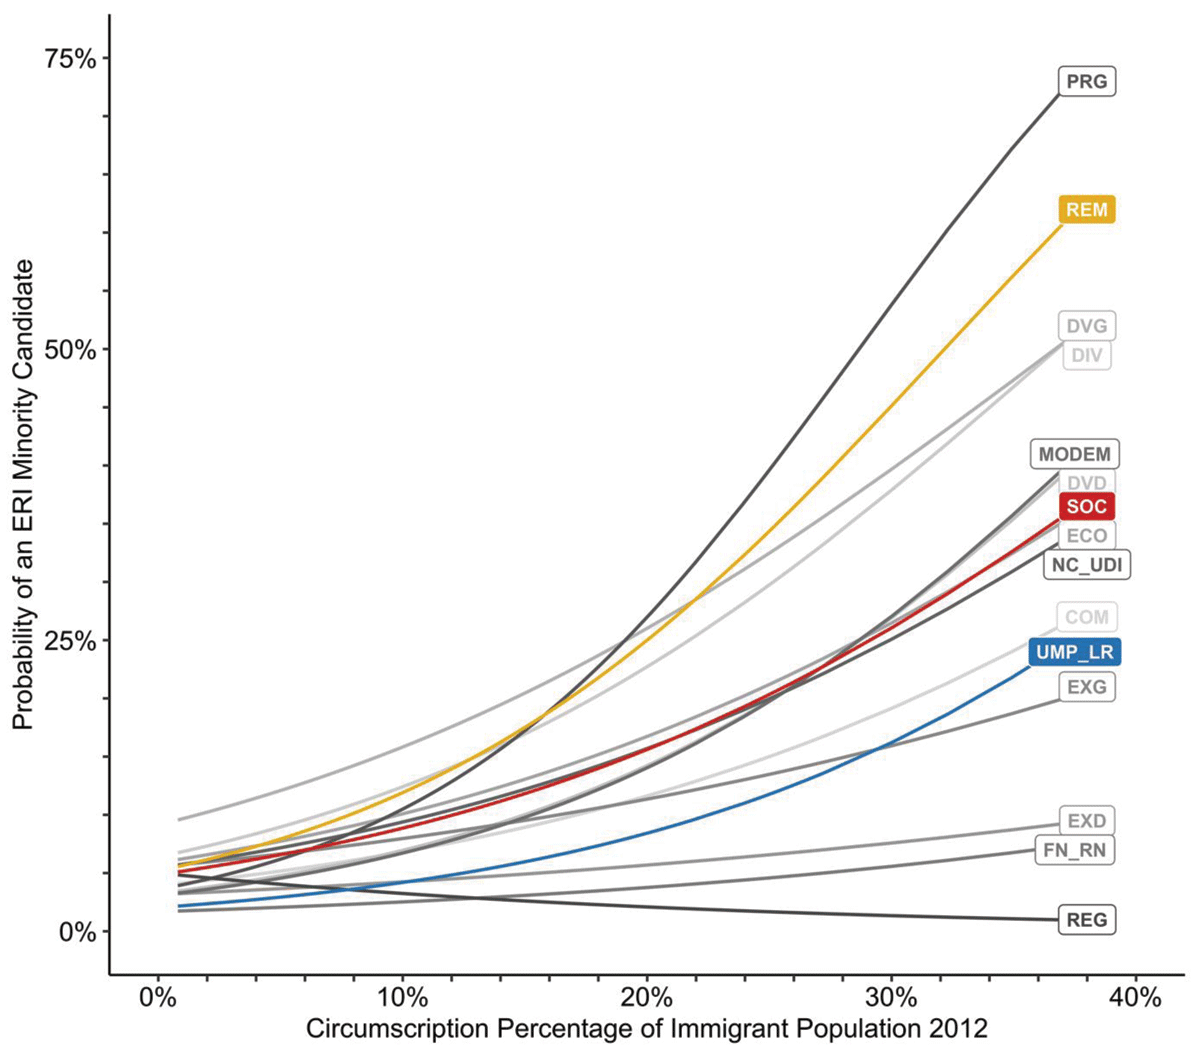
Figure 7
Party differences in the predicted probability of an ERI minority candidate given the percentage of immigrants in the circumscription population in 2012.
Note. Overseas circumscriptions excluded.