
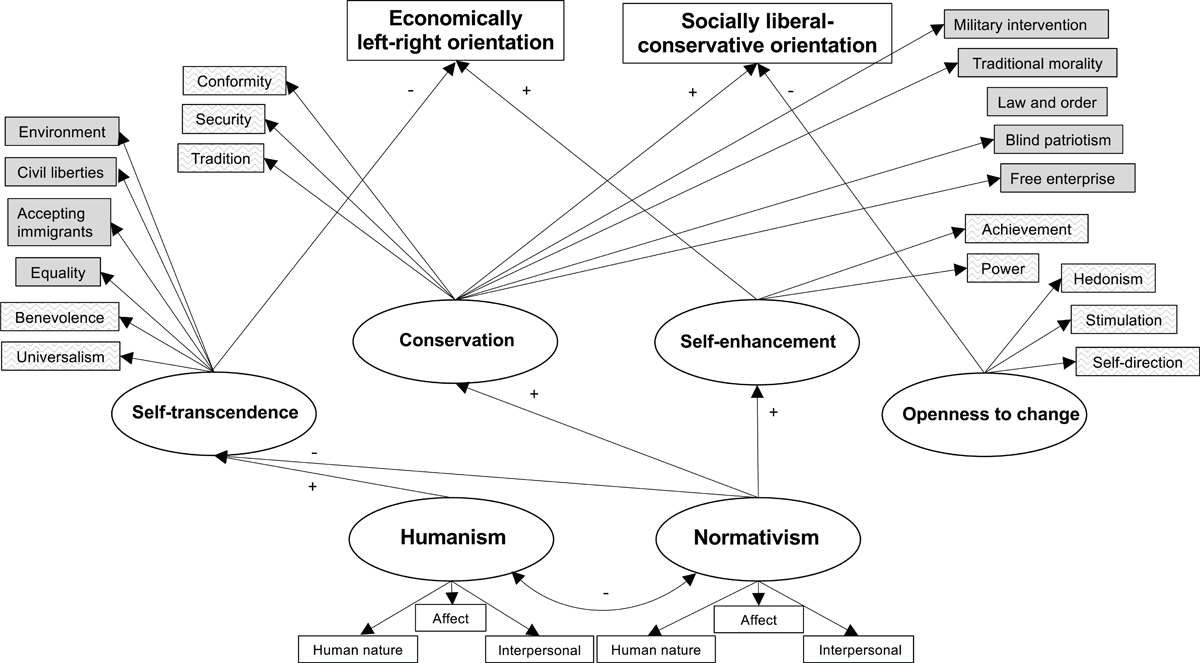
Figure 1
The base model for connections between worldviews, basic personal values (lighter gray boxes) and core political values (darker gray boxes). Political values are linked to value orientations in line with data from Schwartz et al. (2014).
Table 1
Standardized regression coefficients in predictions of humanistic and normativistic worldviews from specific indicators. Means and SDs of ratings of items in the indicators in the two rightmost columns.
| WORLDVIEW | INDICATOR | REGRESSION COEFFICIENT | Ma | SD |
|---|---|---|---|---|
| Humanism | Human nature | 0.68 | 5.63 | 1.11 |
| Humanism | Interpersonal attitude | 0.88 | 5.95 | 1.02 |
| Humanism | Attitude to affect | 0.45 | 5.30 | 1.04 |
| Normativism | Human nature | 0.66 | 2.94 | 1.38 |
| Normativism | Interpersonal attitude | 0.84 | 2.68 | 1.45 |
| Normativism | Attitude to affect | 0.34 | 4.73 | 1.21 |
[i] aThe means are on 1–7 scale from 1 = Completely disagree to 7 = Completely agree.
Table 2
Standardized regression coefficients in predictions of values (rows) from value orientation factors (columns). In italics: core political values. Bold faced numbers: links expected from base model. All coefficients are statistically significant (p < 0.05). Means and SDs of the value ratings in the two rightmost columns.
| VALUE | SELF-TRAN-SCENDENCE | CONSER-VATION | SELF-ENHANCE-MENT | OPENNESS TO CHANGE | Ma | SD |
|---|---|---|---|---|---|---|
| Personal values | ||||||
| Universalism | 0.76 | 0.28 | 4.67 | 0.80 | ||
| Benevolence | 0.48 | 0.39 | 4.84 | 0.83 | ||
| Conformity | 0.33 | 0.41 | 0.45 | –0.19 | 3.76 | 1.05 |
| Security | 0.32 | 0.47 | 4.21 | 1.03 | ||
| Tradition | 0.34 | 0.54 | 3.83 | 0.99 | ||
| Power | 0.88 | 0.38 | 2.89 | 0.94 | ||
| Achievement | 0.52 | 0.21 | 2.95 | 1.14 | ||
| Self-direction | 0.56 | 4.40 | 0.90 | |||
| Stimulation | 0.64 | 3.30 | 1.15 | |||
| Hedonism | 0.60 | 3.94 | 1.03 | |||
| Political values | ||||||
| Accept immigrants | 0.45 | –0.41 | 3.39 | 1.16 | ||
| Equality | 0.57 | 3.63 | 0.99 | |||
| Civil liberties | 0.34 | 4.12 | 0.81 | |||
| Environment | 0.46 | 4.41 | 0.84 | |||
| Traditional morality | 0.82 | 2.37 | 1.00 | |||
| Law and order | 0.73 | 2.35 | 0.98 | |||
| Blind patriotism | 0.59 | 1.91 | 1.04 | |||
| Free enterprise | –0.22 | 0.29 | 0.33 | 2.08 | 0.99 | |
| Military intervention | 0.19 | 2.33 | 1.06 |
[i] aThe means for personal values were computed by reversing the scale responses, after reversal going from 1 = Not like me at all to 6 = Very much like me. The ratings of core political values scale went from 1 = Completely disagree to 5 = Completely agree.
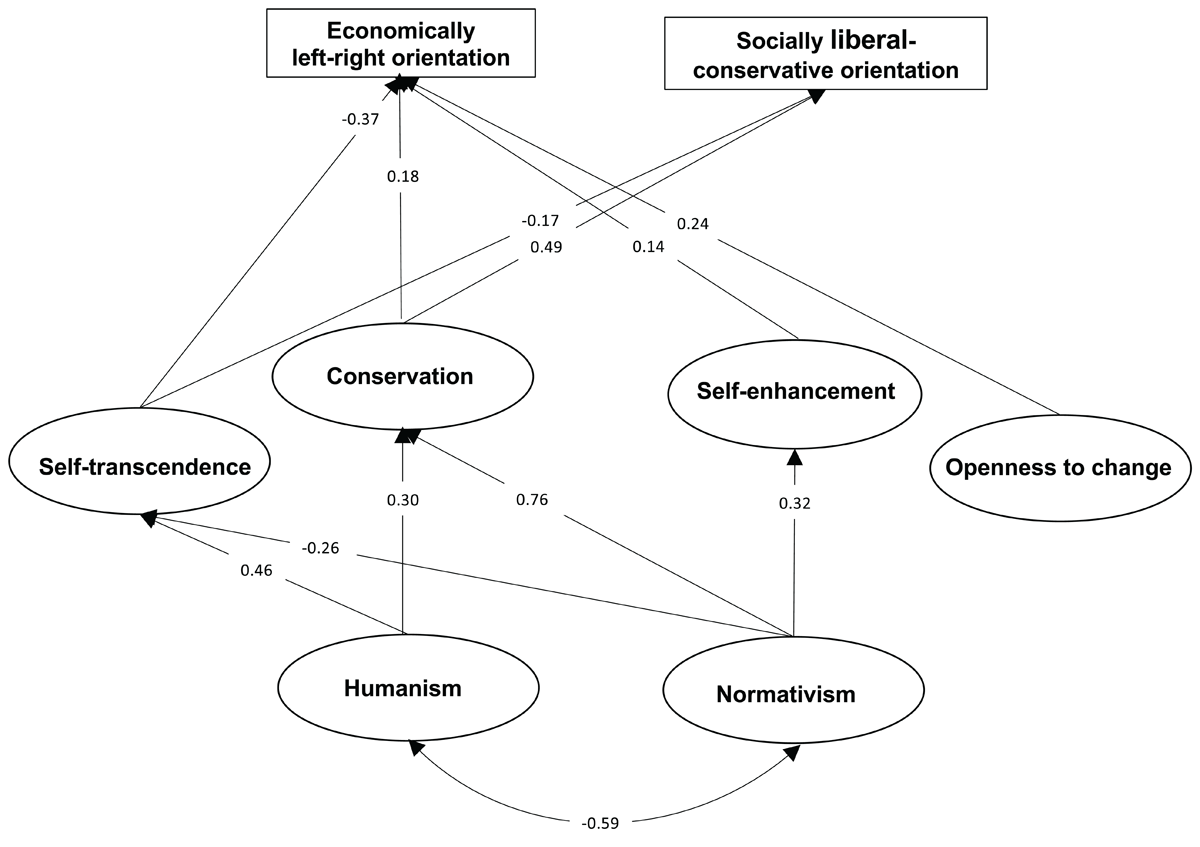
Figure 2
Structural weights in the fitted model as well as weight for links between value orientation factors and political orientations. All coefficients are statistically significant (p < 0.05).