
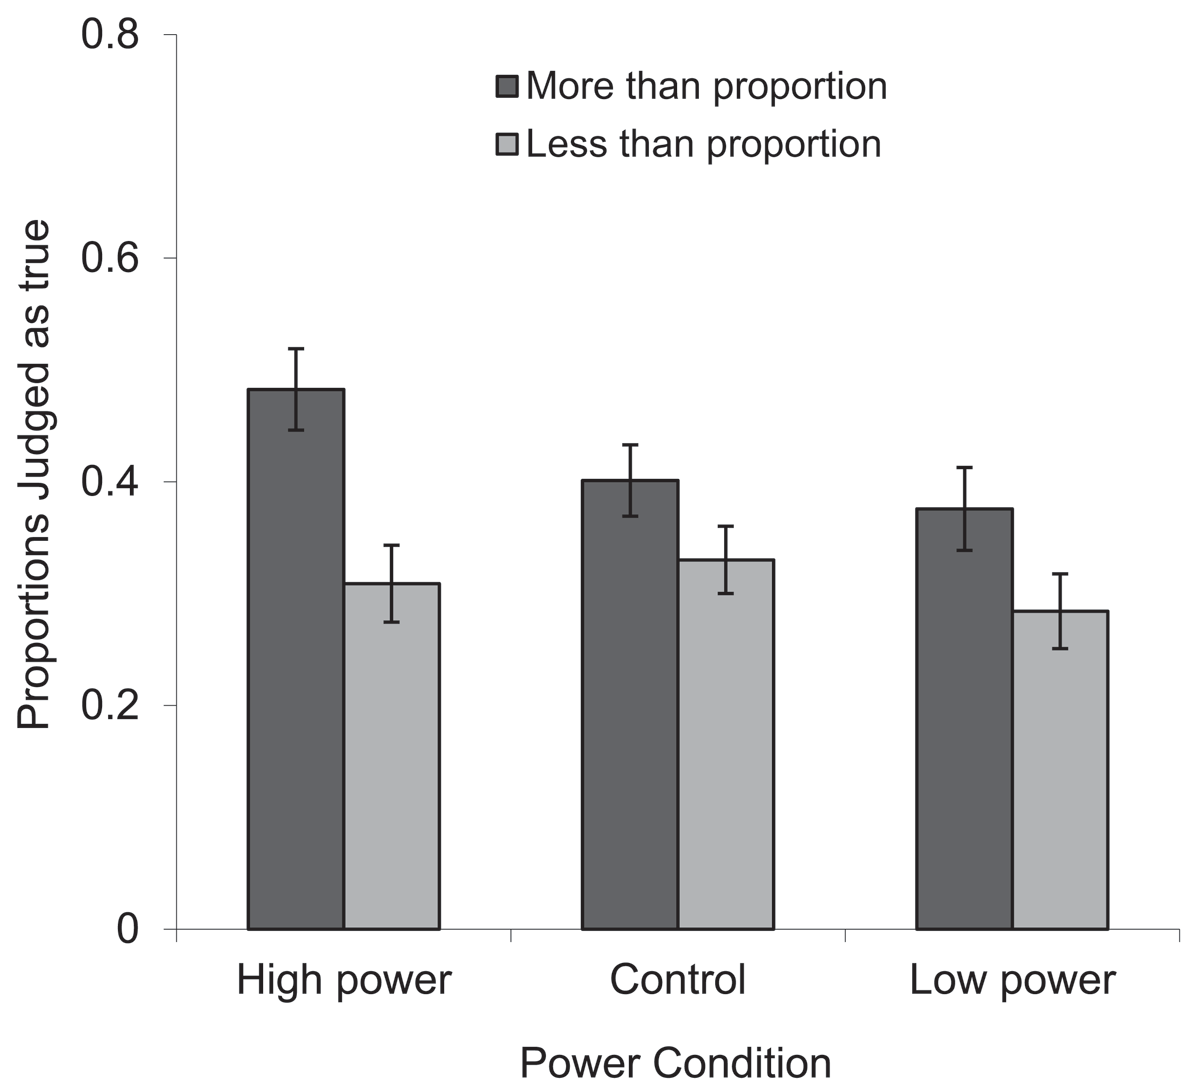
Figure 1
Proportions of ‘more than’ versus ‘less than’ statements about gender differences participants believed to be true as a function of condition (Study 1). Error bars represent standard errors. Scale range 0 to 1.
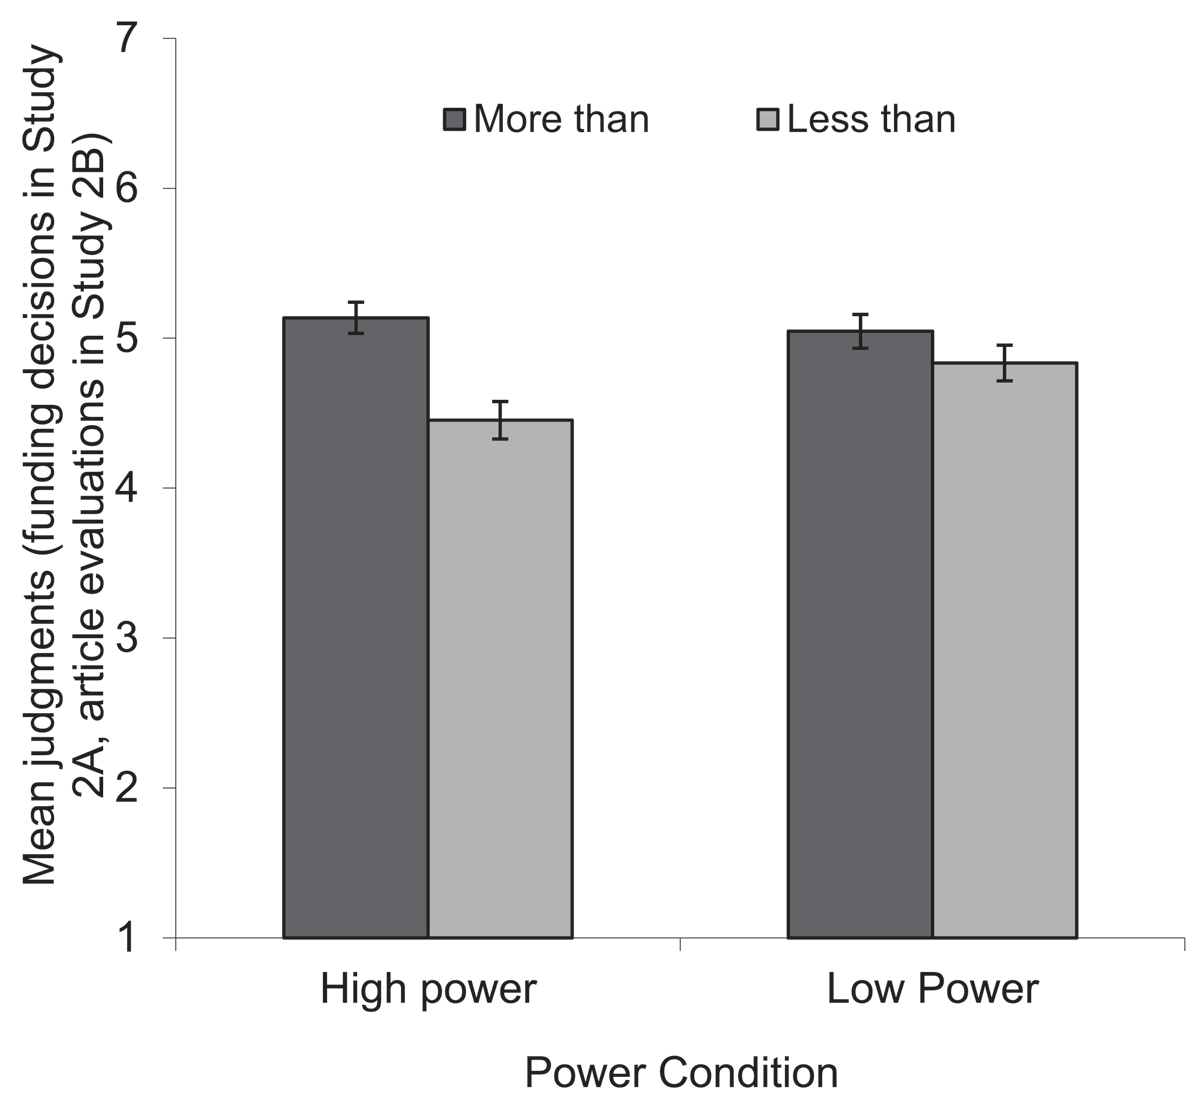
Figure 2
Particiapnts’ average judgments (concerning funding of the different art forms in Study 2A and the evaluation of different articles about medicines in Study 2B) as a function of comparative framing and power. Error bars represent standard errors. Scale range 1 to 7.