
Table 1
Pearson correlation coefficients between the variables (Cronbach’s alphas are displayed in the diagonal when applicable).
| VARIABLE | 1 | 2 | 3 | 4 | 5 | 6 | 7 | 8 | 9 | 10 | 11 | 12 | 13 | 14 | 15 | 16 | 17 | 18 | 19 | 20 | 21 | 22 | 23 | 24 | 25 |
|---|---|---|---|---|---|---|---|---|---|---|---|---|---|---|---|---|---|---|---|---|---|---|---|---|---|
| 1. NonYVs | – | ||||||||||||||||||||||||
| 2. YVsSympathizers | – | – | |||||||||||||||||||||||
| 3. YVsMembers | – | – | – | ||||||||||||||||||||||
| 4. Gender | –.07** | .07** | –.00 | – | |||||||||||||||||||||
| 5. Age | .08** | –.00 | –.10** | –.18** | – | ||||||||||||||||||||
| 6. Education | .19** | –.04 | –.18** | –.01 | –.14** | – | |||||||||||||||||||
| 7. Income | .16** | –.03 | –.16** | –.17** | .28** | .30** | – | ||||||||||||||||||
| 8. Unemployment | –.07** | .03 | .05* | .06** | –.12** | –.07** | –.22** | – | |||||||||||||||||
| 9. PoliticalOrientation | –.05 | –.03 | .10** | –.00 | .11** | –.19** | .01 | .01 | – | ||||||||||||||||
| 10. ImportanceDemocracy | .11** | –.02 | –.12** | –.06* | .19** | .20** | .21** | –.05 | –.14** | – | |||||||||||||||
| 11. CarDependence | –.12** | –.01 | .17** | –.02 | –.03 | .01 | .10** | –.04 | .09** | –.00 | – | ||||||||||||||
| 12. NoHolidays | –.12** | .05* | .08** | .05* | –.04 | –.31** | –.38** | .12** | .13** | –.13** | .05* | – | |||||||||||||
| 13. DifficultEndsOfMonth | –.27** | .11** | .19** | .10** | –.09** | –.25** | –.43** | .17** | .12** | –.13** | .04 | .42** | – | ||||||||||||
| 14. ParentsWorse | .26** | –.10** | –.19** | –.04 | .16** | .07** | .28** | –.12** | –.09** | .09** | –.08** | –.18** | –.39** | – | |||||||||||
| 15. SuccessInLife | .15** | –.07** | –.10** | –.03 | .15** | .13** | .36** | –.22** | –.01 | .15** | .03 | –.31** | –.41** | .26** | – | ||||||||||
| 16. ChildrenWorse | –.24** | .14** | .12** | .08** | .02 | –.05* | –.03 | .04 | .10** | –.03 | .07** | .13** | .19** | –.25** | –.15** | – | |||||||||
| 17. CTs | –.33** | .12** | .26** | .10** | –.20** | –.27** | –.31** | .07** | .17** | –.29** | .06* | .17** | .27** | –.23** | –.18** | .18** | .91 | ||||||||
| 18. CMQ | –.38** | .20** | .21** | .08** | –.08** | –.14** | –.14** | .04 | .10** | –.03 | .08** | .08** | .19** | –.20** | –.10** | .26** | .53** | .84 | |||||||
| 19. Distrust | –.27** | .09** | .23** | .05* | –.14** | –.10** | –.19** | .09** | .08** | –.23** | .04 | .16** | .24** | –.18** | –.27** | .26** | .32** | .31** | .73 | ||||||
| 20. ParanormalBeliefs | –.15** | .10** | .05* | .14** | –.20** | –.11** | –.22** | .07** | .07* | –.15** | –.01 | .12** | .17** | –.15** | –.07** | .03 | .38** | .20** | .04 | .84 | |||||
| 21. InfoNewspapers | .07** | –.04 | –.04 | –.08** | .04 | .05 | .07** | –.04 | –.03 | .02 | –.04 | –.10** | –.09** | .06** | .05* | –.08** | –.09** | –.11** | –.03 | –.03 | – | ||||
| 22. InfoGoogle | .01 | .02 | –.04 | –.07** | –.01 | .01 | –.01 | –.01 | –.01 | .01 | –.00 | .02 | .01 | –.02 | –.04 | .02 | .00 | .05* | .03 | –.00 | –.06** | – | |||
| 23. InfoMediasWebsites | .04 | .03 | –.09** | –.01 | –.00 | .11** | .08** | –.03 | –.03 | .09** | –.06* | –.06** | –.05* | .01 | –.01 | –.02 | –.10** | –.05* | –.06* | –.06* | –.02 | –.24** | – | ||
| 24. InfoTV | –.07** | .05* | .02 | .06* | .10** | –.15** | –.03 | .06* | .14** | –.00 | .05* | .09** | .05* | –.02 | –.04 | .08** | .03 | .04 | –.08** | –.01 | –.26** | –.02 | –.04 | – | |
| 25. InfoSocialMedia | –.10** | –.02 | .15** | .13** | –.28** | –.06* | –.18** | .11** | .00 | –.09** | .02 | .05 | .10** | –.12** | –.04 | .08** | .19** | .15** | .13** | .08** | –.13** | –.24** | –.29** | –.06* | – |
| 26. InfoYoutube | –.07** | .01 | .08** | –.04 | –.06** | –.11** | –.04 | .00 | –.01 | –.07** | –.01 | .04 | .04 | –.04 | –.07** | –.02 | .10** | .05 | .04 | .07** | –.02 | –.07** | –.09** | –.03 | –.09** |
[i] Note: * Indicates p < 0.05. ** Indicates p < 0.01 (two–tailed tests). Gender was coded 1 = Men, 2 = Women, (CTs = Conspiracy Theories; CMQ = Conspiracy Mentality Questionnaire; YVs Members, YVs Sympathizers, and Non YVs were dummy coded).
Table 2
Pattern Matrix of the Principal Component Analysis (Promax rotation with Kaiser normalization, saturation < 0.40 were removed from the table).
| FACTORS VARIABLES | ECONOMIC CAPITAL | ANOMIE | IRRATIONAL BELIEFS | AUTHORITARIANISM |
|---|---|---|---|---|
| Income | .71 | |||
| DifficultEndsofMonth | –.71 | |||
| SuccessInLife | .71 | |||
| NoHolidays | –.71 | |||
| ParentsWorse | .45 | –.42 | ||
| ChildrenWorse | .83 | |||
| Distrust | .62 | |||
| CMQ | .54 | .51 | ||
| ParanormalBeliefs | .85 | |||
| CTs | .64 | |||
| PoliticalOrientation | .84 | |||
| ImportanceDemocracy | –.56 | |||
| Eigenvalues | 2.72 | 2.31 | 2.19 | 1.37 |
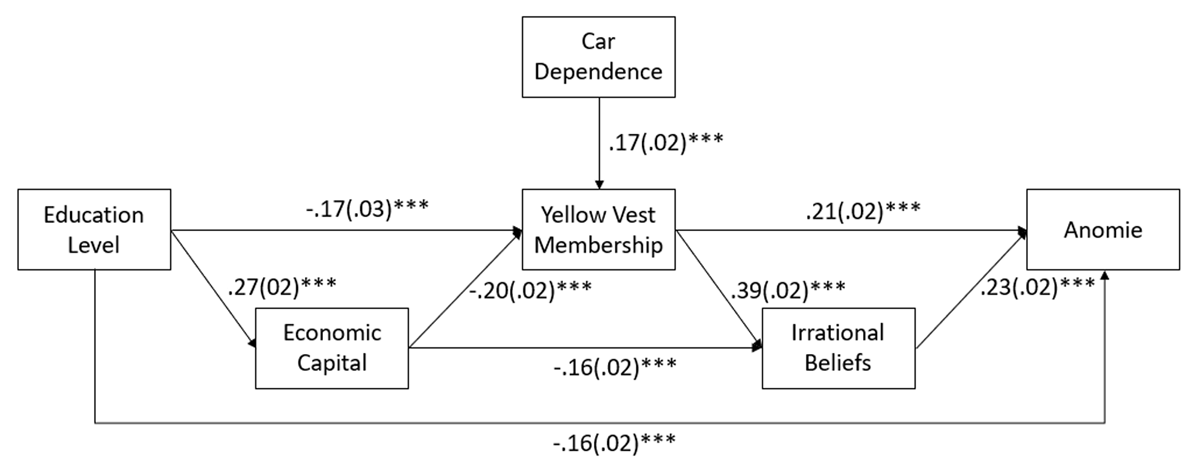
Figure 1
Structural Equation Model of the links between Car Dependence, Education, Yellow Vest Membership, Economic Capital, Anomie, and Irrational Beliefs (N = 1543).
Note: Numbers represent standardized beta coefficients, numbers between brackets represent SE. ** p < 0.01, *** p < 0.001.
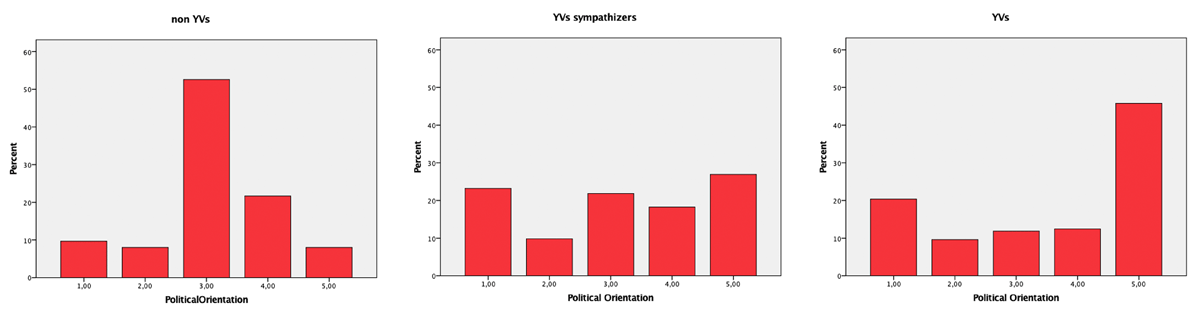
Figure 2
Bar charts indicating percentage of political orientation categories (1 = Left, 5 = Right) among YVs categories (Non VYs, VYs Sympathizers and VYs Members).
Table 3
Significant regression coefficients from hierarchical binary logistic regression analyses (Backward method, based on Likelihood Ratio) with YVs groups as criteria and the psychological and sociological variables as predictors (empty cells indicate non-significant effects).
| PREDICTORS CRITERIA | NON YVS VS. YVS MEMBERS | NON YVS VS. YVS SYMPATHIZERS | YVS SYMPATHIZERS VS. YVS MEMBERS | ||||||
|---|---|---|---|---|---|---|---|---|---|
| B | SE | ODD RATIO | B | SE | ODD RATIO | B | SE | ODD RATIO | |
| Age | |||||||||
| Gender | |||||||||
| Income | |||||||||
| Education | –.25 | .07 | .78 | –.09 | .04 | .92 | –.12 | .05 | .89 |
| CarDependence | .70 | .18 | 2.02 | .55 | .12 | 1.73 | |||
| Unemployment | |||||||||
| CTs | .36 | .21 | 1.44 | .44 | .13 | 1.55 | |||
| CMQ | .68 | .22 | 1.98 | .76 | .11 | 2.14 | |||
| Distrust | 1.16 | .22 | 3.18 | .35 | .13 | 1.41 | .66 | .14 | 1.94 |
| DifficultEndsofMonth | .50 | .18 | 1.65 | .37 | .10 | 1.45 | |||
| ParentsWorse | –.41 | .15 | .66 | –.19 | .08 | .83 | –.27 | .10 | .76 |
| ChildrenWorse | .44 | .17 | 1.55 | .40 | .10 | 1.50 | |||
| SuccessInLife | |||||||||
| NoHolidays | |||||||||
| ParanormalBeliefs | |||||||||
| ImportanceDemocracy | |||||||||
| PoliticalOrientation | |||||||||
| PoliticalExtremes | .94 | .32 | 2.55 | .93 | .19 | 2.53 | |||
| Constant | –10.08 | 1.73 | .00 | –4.63 | .81 | .01 | –4.60 | .80 | .01 |
| Goodness of fit: Nagelkerke | R2 = .69 | R2 = .40 | R2 = .23 | ||||||