
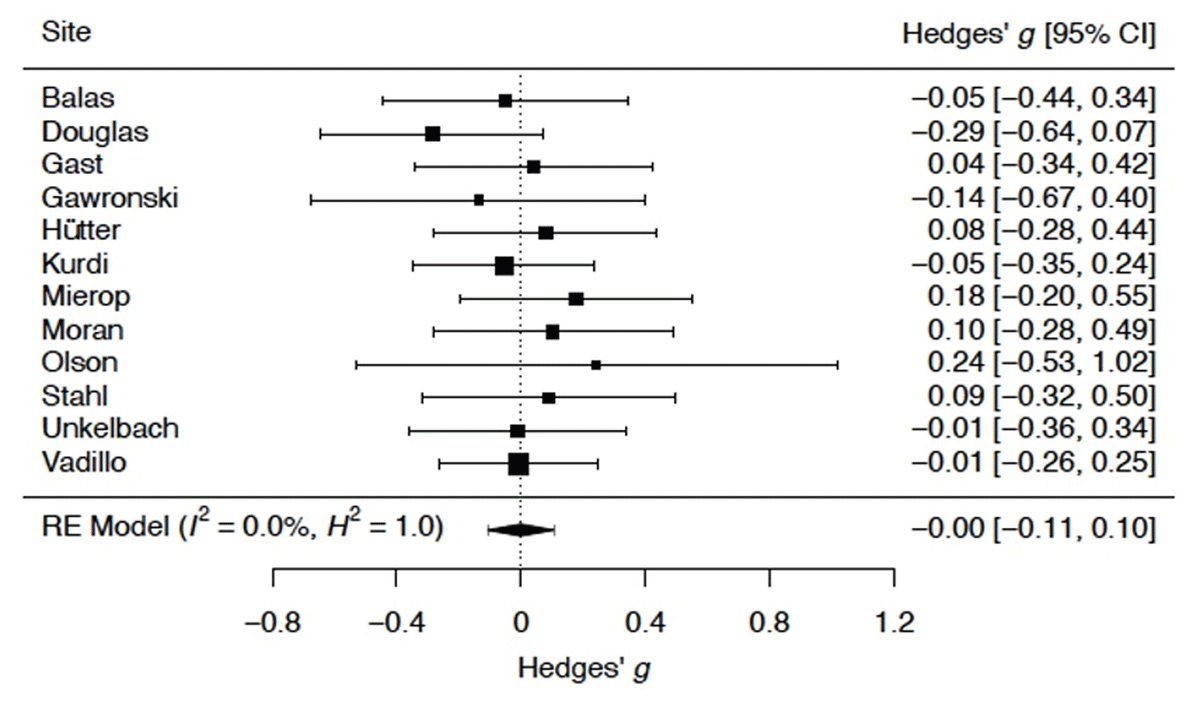
Figure 1
Forest plot of the meta-analytic results as a function of data collection site.
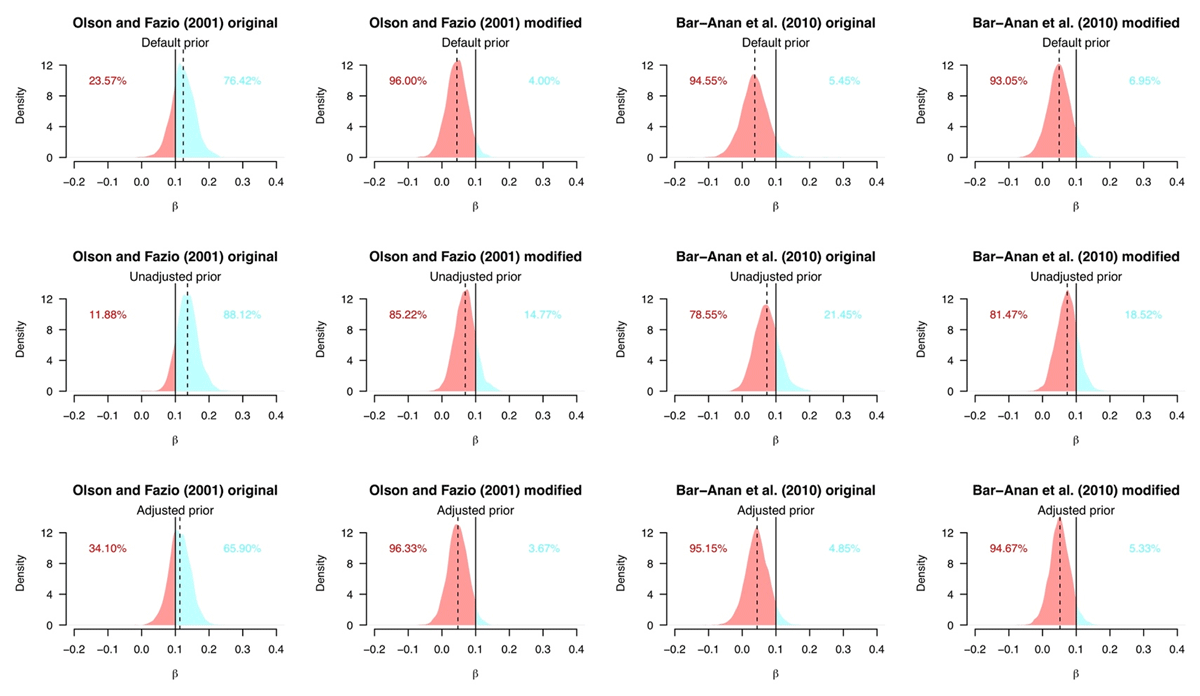
Figure 2
Posterior distribution of the unaware EC effect under different priors and exclusion criteria. Positive scores correspond to the theoretically expected preference for CSpos over CSneg. The dashed vertical line shows the posterior mean, and the solid vertical line shows the smallest effect size of interest (β = 0.1). Areas displayed in red are consistent with the null hypothesis H0: B < 0.1 and areas displayed in light blue are consistent with the directional alternative hypothesis H1: B ≥ 0.1. Percentages denote the proportion of the posterior distribution consistent with H0 and H1, respectively.
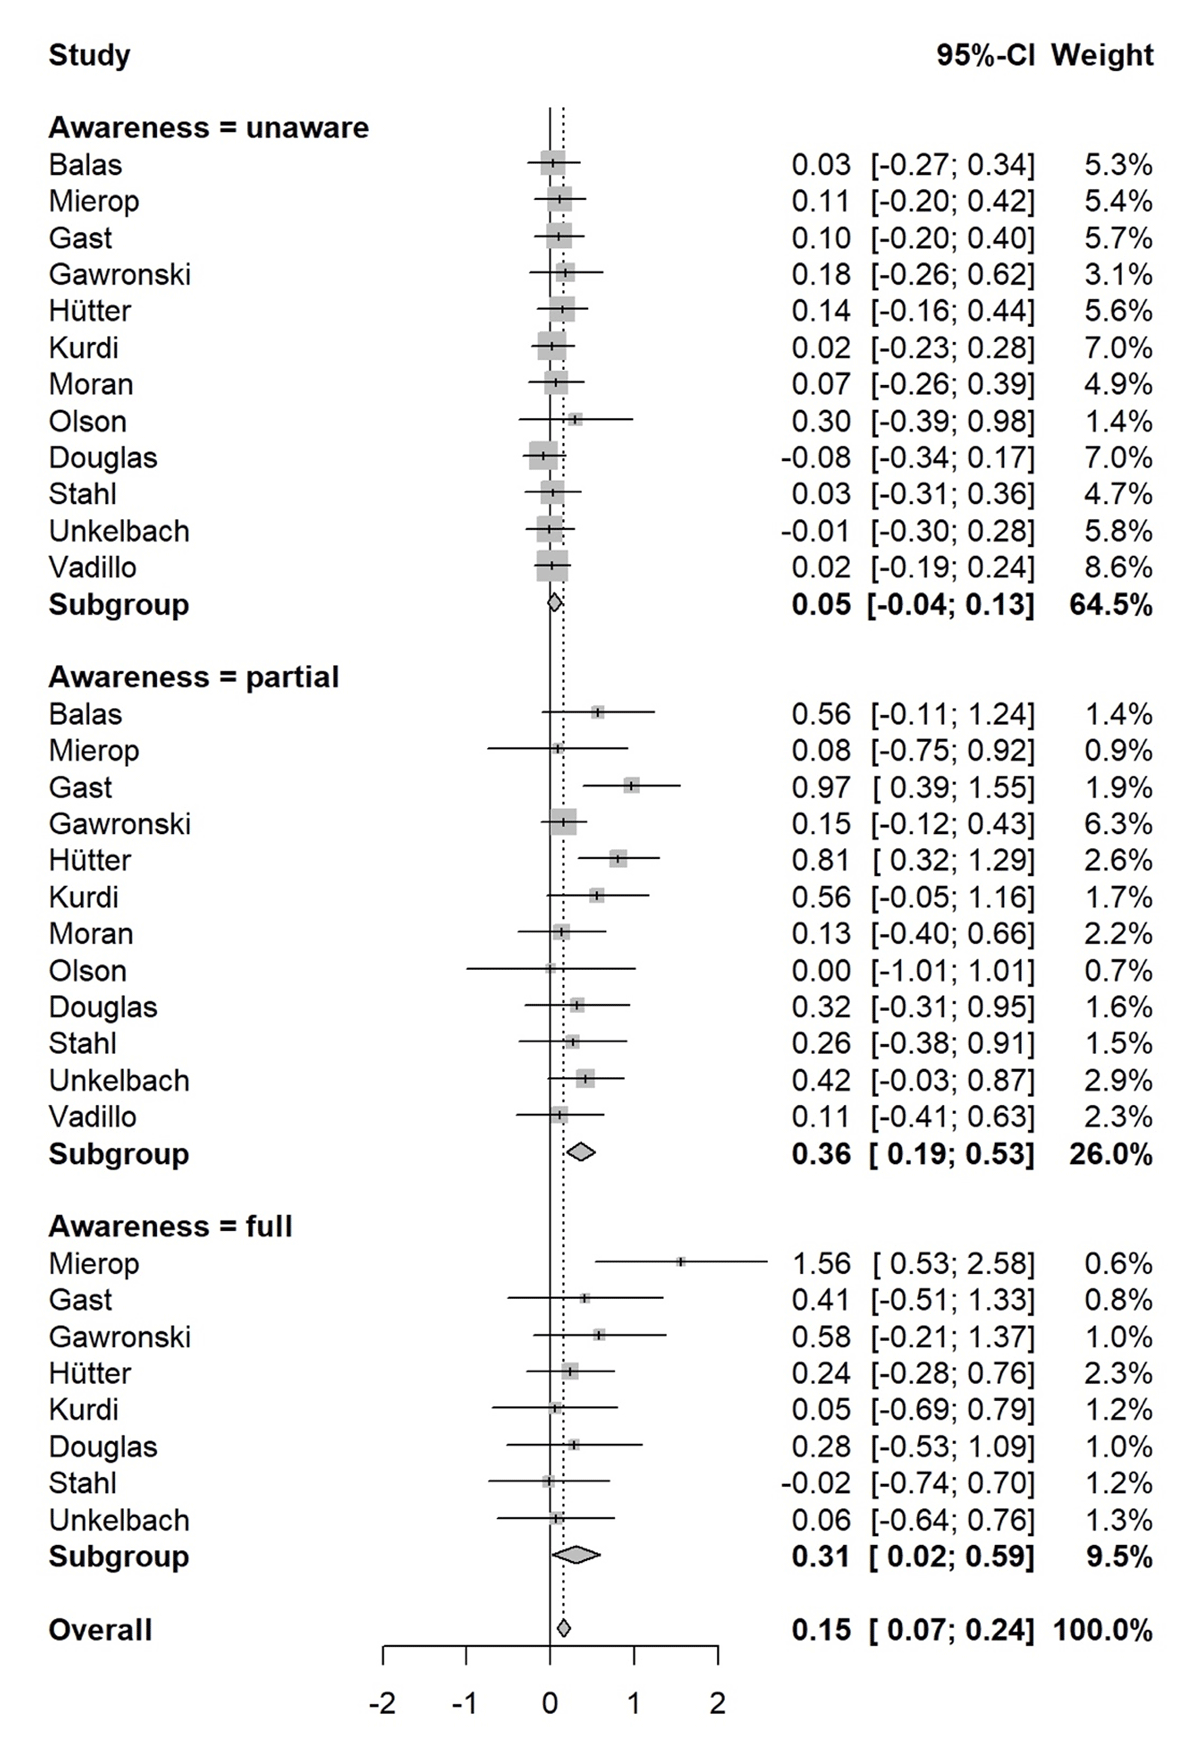
Figure 3
Meta-analytic results as a function of the awareness sub-type criterion. There were four sites with only two fully aware participants for which the corresponding effect sizes could not be calculated.