
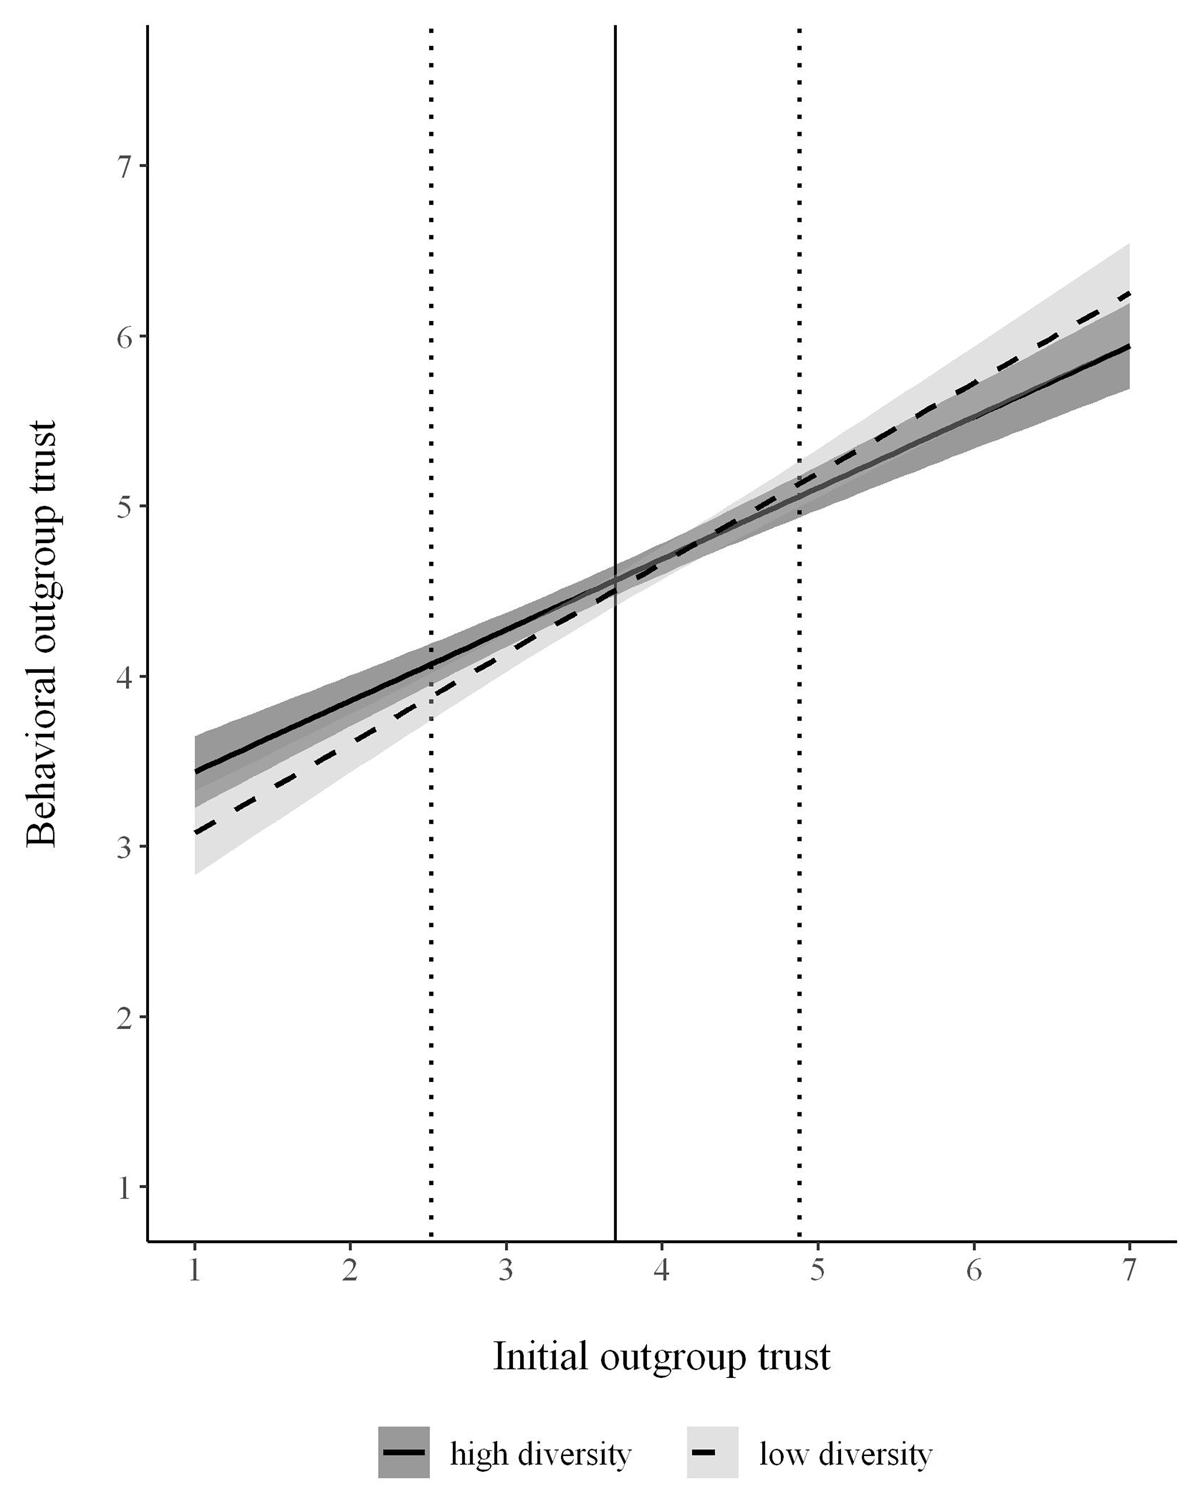
Figure 1
Behavioral outgroup trust as a function of manipulated ingroup diversity (high vs. low) and measured initial outgroup trust. Shaded areas represent the +/– 1 standard error margin. The solid vertical line represents the sample mean of initial outgroup trust; the dotted vertical lines mark one standard deviation below and above the mean, respectively (Study 4; N = 197).

Figure 2
Correlation coefficients r and 95% CIs from Meta-Analyses across Studies 1 to 4. Results refer to (a) the interaction of ingroup diversity and default trust, (b) simple comparisons in the low diversity condition, and (c) simple comparisons in the high diversity condition.