
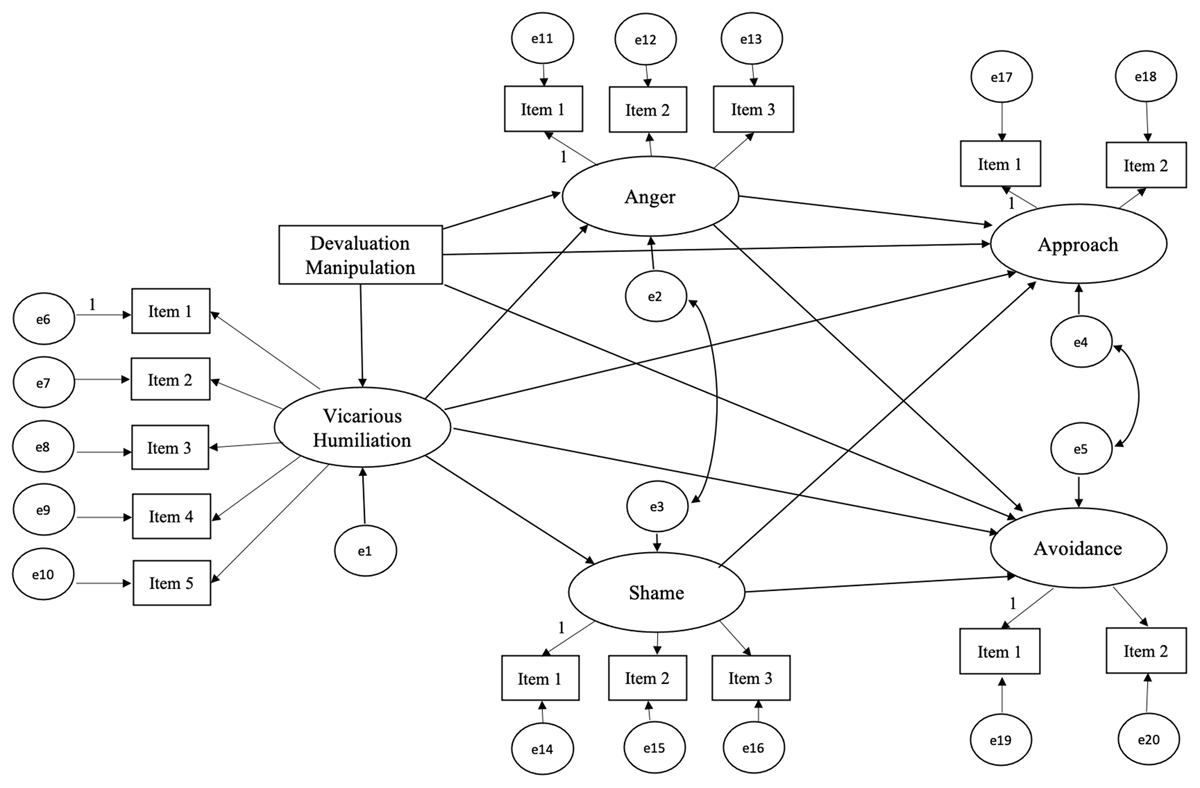
Figure 1
Structural and measurement model, Experiments 1–3.
Table 1
Means, standard deviations, and inter-correlations of principal variables, Experiments 1–3.
| 1 | 2 | 3 | 4 | 5 | ||
|---|---|---|---|---|---|---|
| Experiment 1 | Mean | 2.74 | 2.37 | 2.00 | 2.54 | 3.00 |
| SD | 1.25 | 1.14 | 1.03 | 1.09 | 1.03 | |
| n | 291 | 291 | 291 | 291 | 291 | |
| Experiment 2 | Mean | 3.00 | 2.30 | 1.74 | 2.35 | 3.21 |
| SD | 1.44 | 1.25 | 1.00 | 1.10 | 1.14 | |
| n | 429 | 429 | 429 | 429 | 429 | |
| Experiment 3 | Mean | 2.09 | 1.96 | 1.73 | 2.45 | 2.72 |
| SD | 1.13 | 1.07 | 1.00 | 1.06 | 1.11 | |
| n | 353 | 353 | 353 | 353 | 353 | |
| 1 Vicarious humiliation | – | 0.568*** | 0.509*** | 0.254*** | 0.201** | |
| 2 Anger | 0.648***/0.576*** | – | 0.662*** | 0.224*** | 0.286*** | |
| 3 Shame | 0.468***/0.515*** | 0.653***/0.664*** | – | 0.314*** | 0.225*** | |
| 4 Avoidance | 0.089/0.127* | 0.110*/0.088 | 0.230***/0.149** | – | –0.059 | |
| 5 Approach | 0.324**/0.121* | 0.427**/0.219*** | 0.221***/0.198*** | 0.016/0.089 | – |
[i] Note: *** p < 0.001, ** p < 0.01, * p < 0.05 (two-tailed); correlation coefficients of Experiment 1 are reported in the upper right part of the table and of Experiment 2 (first coefficient) and Experiment 3 (second coefficient) in the lower left part of the table.
Table 2
Model Comparisons, Experiments 1–3.
| Model 1 Totally Unconstrained Model | Model 2 Structural weights unconstrained | Model 3 Limited Structural weights unconstrained (Experiment 2) | Model 4 Customized | Model 5 Totally constrained model | |
|---|---|---|---|---|---|
| Number of parameter estimates | 123 | 67 | 54 | 44 | 41 |
| Chi-Square | (285) = 655.7*** | (341) = 787.9*** | (354) = 795.1*** | (364) = 821.4*** | (367) = 932.4*** |
| Chi-Square/DF | 2.30 | 2.31 | 2.25 | 2.26 | 2.54 |
| NFI | 0.939 | 0.926 | 0.926 | 0.923 | 0.913 |
| (parsimony adjusted) | (0.743) | (0.877) | (0.910) | (0.933) | (0.930) |
| CFI | 0.964 | 0.957 | 0.957 | 0.956 | 0.945 |
| (parsimony adjusted) | (0.763) | (0.906) | (0.941) | (0.966) | (0.964) |
| RMSEA | 0.035 | 0.035 | 0.034 | 0.034 | 0.038 |
| Model Comparison ΔChi-Square | |||||
| Model 2 | (56) = 132.3*** | ||||
| Model 3 | (69) = 139.5*** | (13) = 7.2 | |||
| Model 4 | (79) = 165.7*** | (23) = 33.5 | (10) = 26.3** | ||
| Model 5 | (82) = 276.7*** | (26) = 144.5*** | (13) = 137.2*** | (3) = 111.0*** |
[i] Note: All models allowed item intercepts to differ across groups. Apart from that, Model 1 allowed between-group differences in structural covariances, measurement weights, structural weights, correlations between structural residuals, and variance of measurement residuals (totally unconstrained model). Model 2 only allowed between-group differences in structural weights while all other parameters were constrained to be equal between all studies. Model 3 only allowed for differences between the female group (Experiment 2) and the other two groups in structural weights. Model 4 only allowed for differences between the female group (Experiment 2) and the other two groups on the structural weights of the effects of the devaluing event on vicarious humiliation, approach, and avoidance. Model 5 did not allow for between-group differences in any of the model parameters. *** p < 0.001, ** p < 0.01, * p < 0.001.
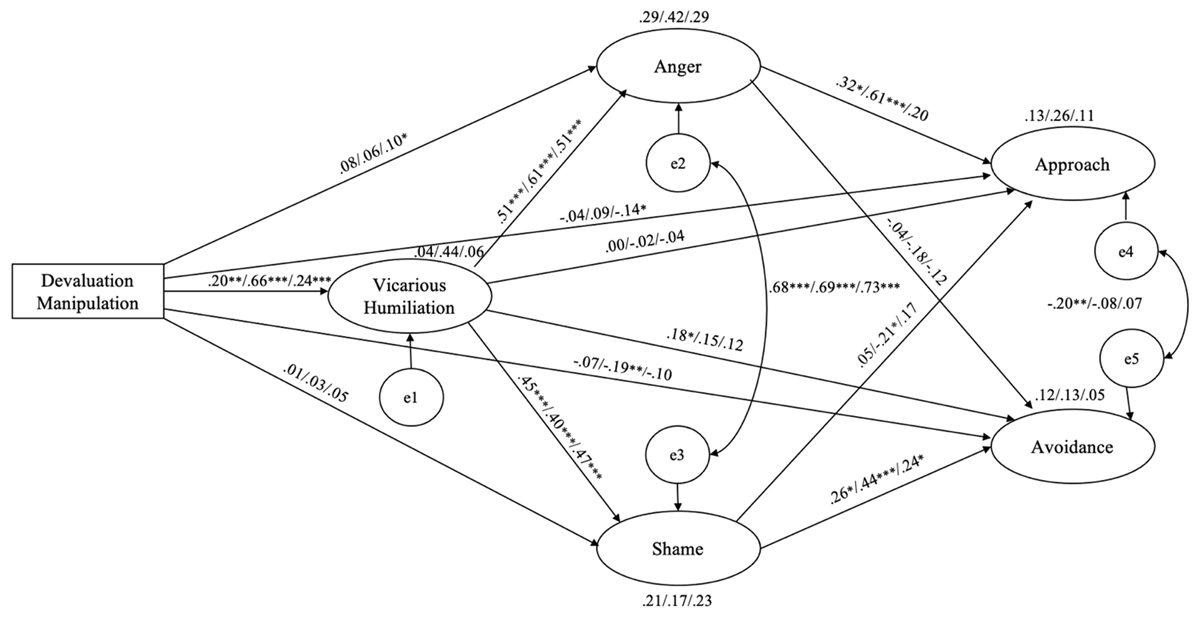
Figure 2
Standardized direct effects estimated in Model 2, Experiment 1/2/3.
Note: *** p < 0.001, ** p < 0.01, * p < 0.05.
Table 3
Indirect effects of devaluation manipulation on feelings (i.e., vicarious humiliation, anger, and shame) and motivational tendencies (i.e., approach and avoidance) estimated in Model 4, Experiments 1–3.
| Experiment 1: Nationality and Experiment 3: Males | Estimate | SE | LB | UB | p |
|---|---|---|---|---|---|
| Effects on anger | |||||
| Devaluation * vicarious humiliation | 0.27 | 0.05 | 0.17 | 0.38 | <0.001 |
| Effects on shame | |||||
| Devaluation * vicarious humiliation | 0.19 | 0.04 | 0.12 | 0.27 | <0.001 |
| Effects on approach | |||||
| Devaluation * vicarious humiliation | –0.00 | 0.02 | –0.05 | 0.04 | 0.84 |
| Devaluation * anger | 0.07 | 0.03 | 0.02 | 0.14 | <0.001 |
| Devaluation * shame | 0.00 | 0.00 | –0.01 | 0.01 | 0.89 |
| Vicarious humiliation * anger | 0.22 | 0.04 | 0.15 | 0.30 | <0.001 |
| Vicarious humiliation * shame | –0.02 | 0.03 | –0.07 | 0.04 | 0.60 |
| Devaluation * vicarious humiliation * anger | 0.10 | 0.03 | 0.05 | 0.16 | <0.001 |
| Devaluation * vicarious humiliation * shame | –0.01 | 0.01 | –0.04 | 0.02 | 0.51 |
| Effects on avoidance | |||||
| Devaluation * vicarious humiliation | 0.06 | 0.03 | 0.02 | 0.12 | 0.01 |
| Devaluation * anger | –0.02 | 0.02 | –0.06 | 0.01 | 0.15 |
| Devaluation * shame | 0.01 | 0.02 | –0.03 | 0.05 | 0.69 |
| Vicarious humiliation * anger | –0.06 | 0.04 | –0.14 | 0.02 | 0.15 |
| Vicarious humiliation * shame | 0.13 | 0.06 | 0.07 | 0.18 | <0.001 |
| Devaluation * vicarious humiliation * anger | –0.03 | 0.02 | –0.07 | 0.01 | 0.13 |
| Devaluation * vicarious humiliation * shame | 0.06 | 0.02 | 0.03 | 0.10 | 0.02 |
| Experiment 2: Females | |||||
| Effects on anger | |||||
| Devaluation * vicarious humiliation | 1.04 | 0.08 | 0.88 | 1.20 | <0.001 |
| Effects on shame | |||||
| Devaluation * vicarious humiliation | 0.74 | 0.07 | 0.61 | 0.88 | <0.001 |
| Effects on approach | |||||
| Devaluation * vicarious humiliation | –0.02 | 0.08 | –0.17 | 0.14 | 0.85 |
| Devaluation * anger | 0.07 | 0.03 | 0.02 | 0.14 | <0.001 |
| Devaluation * shame | 0.00 | 0.00 | –0.01 | 0.01 | 0.89 |
| Vicarious humiliation * anger | 0.22 | 0.04 | 0.15 | 0.30 | <0.001 |
| Vicarious humiliation * shame | –0.02 | 0.03 | –0.07 | 0.04 | 0.60 |
| Devaluation * vicarious humiliation * anger | 0.38 | 0.07 | 0.26 | 0.53 | <0.001 |
| Devaluation * vicarious humiliation * shame | –0.03 | 0.05 | –0.14 | 0.06 | 0.54 |
| Effects on avoidance | |||||
| Devaluation * vicarious humiliation | 0.24 | 0.09 | 0.06 | 0.41 | 0.01 |
| Devaluation * anger | –0.02 | 0.02 | –0.06 | 0.01 | 0.15 |
| Devaluation * shame | 0.01 | 0.02 | –0.03 | 0.05 | 0.69 |
| Vicarious humiliation * anger | –0.06 | 0.04 | –0.14 | 0.02 | 0.15 |
| Vicarious humiliation * shame | 0.13 | 0.06 | 0.07 | 0.18 | <0.001 |
| Devaluation * vicarious humiliation * anger | –0.10 | 0.07 | –0.24 | 0.04 | 0.16 |
| Devaluation * vicarious humiliation * shame | 0.23 | 0.06 | 0.12 | 0.34 | <0.001 |
[i] Note: Unstandardized regression weights with standard errors and percentile 95% confidence intervals estimated with 2000 bootstrap samples.