

Figure 1
Decision tree for search for articles leading to the confirmatory and extended analysis; * including effects that did not fit inclusion criteria, explicit inference, and effects from five preliminarily coded articles; all e = 127 coded effects can be found in the data matrix online.
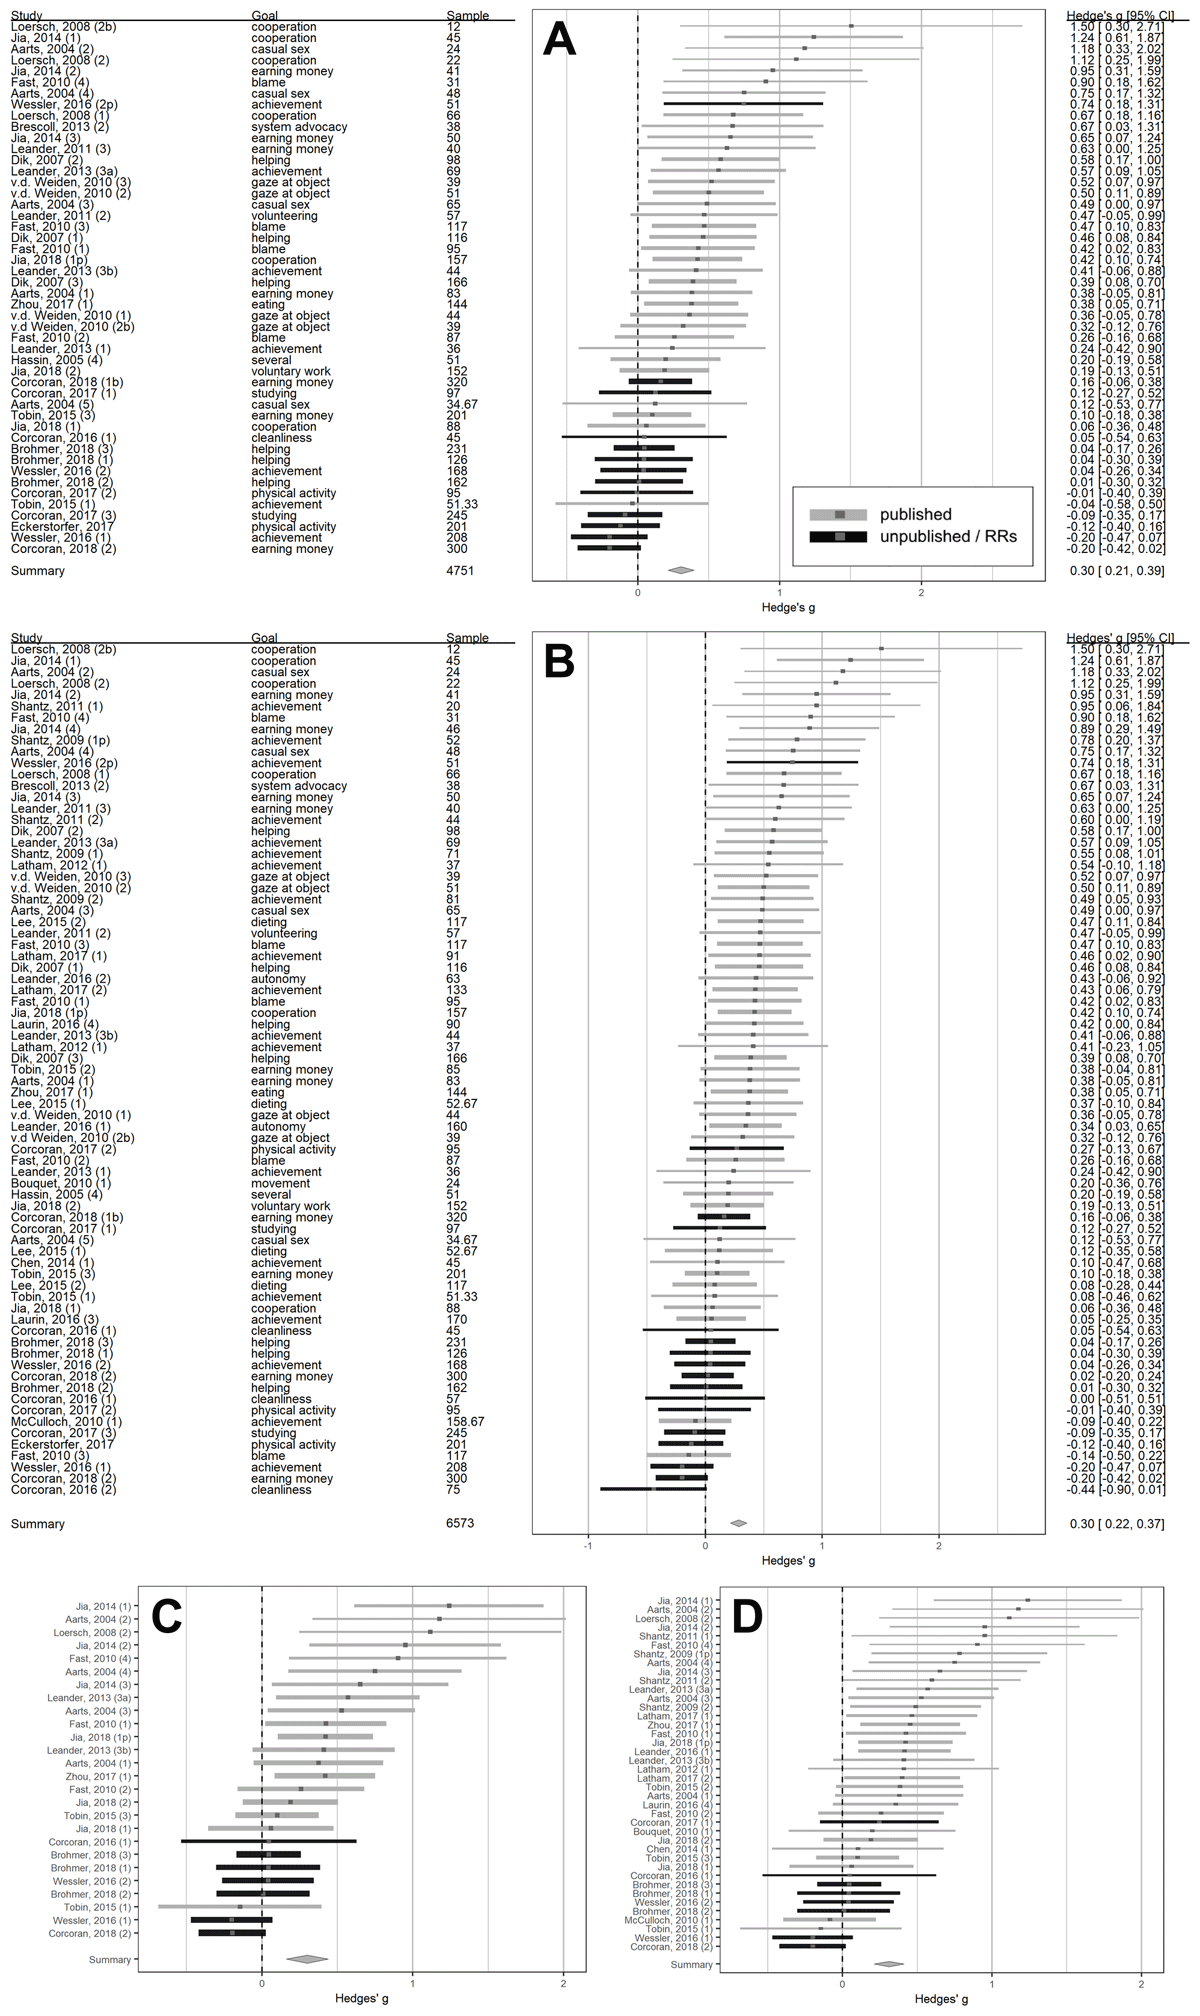
Figure 2
Forest plots for the confirmatory analysis (A), extended analysis (B), behavior only in the confirmatory data (C), and extended data (D). Note that sample sizes sometimes include decimals as insufficient information on subsamples were provided in the original articles and we assumed equal-sized cells; thickness of CIs indicates higher precision.
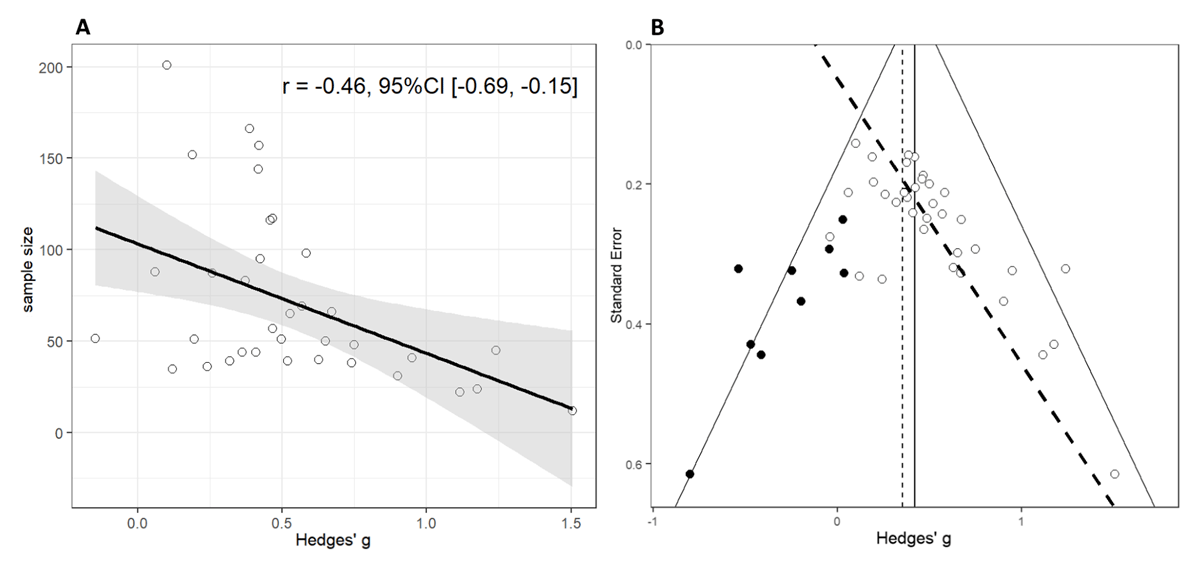
Figure 3
Publication bias methods. (A) association between effect size (Hedges’ g) and sample size; shades are the 95% CI; (B) association between effect size and standard error in a funnel plot; vertical full line is the raw summary effect; black full dots are imputed effects for trim-and-fill; vertical dashed line is the trim-and-fill corrected effect; the diagonal dashed line is Egger’s regression.
Table 1
Different effect size correction methods and Hedges’ g with 95% CI. See supplementary document for details.
| Correction Approach | Description | Source | Confirmatory Model(e = 48) | Pursuit Confirm(e = 26) | Extended Model(e = 71) | Pursuit Extend(e = 40) |
|---|---|---|---|---|---|---|
| Trim & Fill | Liberal correction based on mirrored studies | Duval & Tweedie, 2000 | 0.33 [0.22; 0.43] | 0.16 [–0.003; 0.33] | 0.19 [0.11; 0.26] | 0.19 [0.08; 0.30] |
| PET method | Conservative correction based on the intercept of Egger’s regression (PEESE with asterisk) | Stanley, 2008 | –0.12 [–0.35; 0.11] | –0.11* [–0.24; 0.02] | –0.03* [–0.11; 0.06] | –0.05* [–0.17; 0.06] |
| Selection model | Assigns different weights to significant and nonsignificant effects | Vevea & Hedges, 1995 | 0.15 [–0.02; 0.32] | 0.13 [–0.07; 0.34] | 0.06 [0.01; 0.11] | 0.04 [–0.002; 0.08] |
| P-uniform | Assumes a uniform distribution of p-values (p < .05) conditioned on the true underlying effect size. | van Assen et al., 2015 | 0.21 [–0.05; 0.41] | 0.27 [–0.07; 0.54] | 0.13 [–0.10; 0.32] | 0.16 [–0.14; 0.39] |
| P-uniform* | Also contains information from nonsignificant effects (p ≥ .05) | van Aert et al., 2016; van Aert & van Assen, 2019 | 0.17 [0.05; 0.29] | 0.20 [0.03; 0.38] | 0.16 [0.07; 0.25] | 0.15 [0.03; 0.28] |
| Hybrid method | Assumes a bias in published effects, but not in unpublished effects | van Aert & van Assen, 2018 | 0.11 [0.001; 0.23] | 0.10 [–0.04; 0.29] | 0.07 [–0.03; 0.18] | 0.07 [–0.07; 0.22] |

Figure 4
Meta-regression to identify moderators. Bubble size indicates sample size of the study; estimates in the panels are zero-order and for the black lines; continuous moderators are based on a pre-study and are centered on the scale-midpoint; rectangles contain potentially interesting effects (details, see supplementary document); additional estimates: (A): gray line: b = –0.01, 95%CI [–0.30, 0.28], dashed line: b = –0.09, 95%CI [–0.25, 0.06]; (B): gray line: b = 0.04, 95%CI [–0.23, 0.30], dashed line: b = 0.06, 95%CI [–0.11, 0.22]; (C): gray line: b = 0.21, 95%CI [–0.18, 0.59], dashed line: b = 0.04, 95%CI [–0.15, 0.22]; (D): gray line: b = –0.09, 95%CI [–0.18, 0.01], dashed line: b = –0.02, 95%CI [–0.09, 0.05]; (E): gray line: b = 0.08, 95%CI [0.02, 0.14], dashed line: b = 0.03, 95%CI [–0.01, 0.07].