
Table 1
Means and standard deviations as function of Contrast 1 and measures.
| Measures | Teacher’s treatment of the student with disability | ||||
|---|---|---|---|---|---|
| Inclusion | Exclusion (two conditions merged) | ||||
| Mean | SD | Mean | SD | ||
| Attribution to discrimination | 2.19 | 0.92 | 5.75 | 1.23 | |
| Symbolic distanciation | Hostile emotions | 1.46 | 0.75 | 3.34 | 1.51 |
| De-identification | 3.55 | 1.39 | 6.00 | 1.10 | |
| Pragmatic distanciation | Warmth attribution | 5.50 | 0.79 | 4.38 | 0.96 |
| Backlash | 2.39 | 1.05 | 4.56 | 1.13 | |
| Competence | 5.64 | 0.82 | 4.11 | 1.01 | |
Table 2
Means and standard deviations as function of Contrast 2 and measures.
| Measures | Justification for the exclusion | ||||
|---|---|---|---|---|---|
| Exclusion with hostile justification | Exclusion with benevolent justification | ||||
| Mean | SD | Mean | SD | ||
| Attribution to discrimination | 6.25 | 1.04 | 5.22 | 1.19 | |
| Symbolic distanciation | Hostile emotions | 3.66 | 1.38 | 3.04 | 1.59 |
| De-identification | 6.34 | 1.09 | 5.67 | 1.02 | |
| Pragmatic distanciation | Warmth attribution | 4.13 | 1.07 | 4.61 | 0.78 |
| Backlash | 4.81 | 1.11 | 4.33 | 1.12 | |
| Competence | 4.12 | 1.11 | 4.11 | 0.91 | |
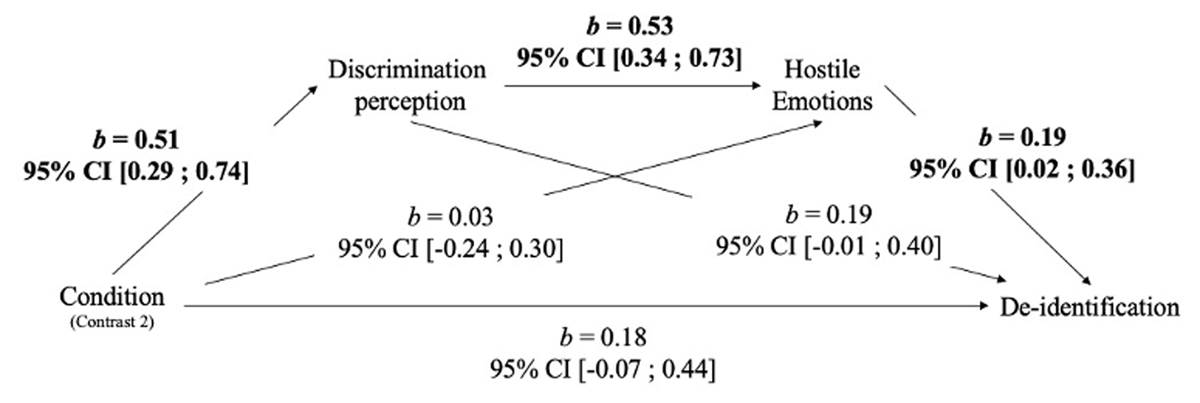
Figure 1
Symbolic distancing mediation analysis.
Note: b = unstandardized coefficients; CI = confidence interval. Paths in bold are the significant ones.
C1 was added in the mediation analysis as a covariate.
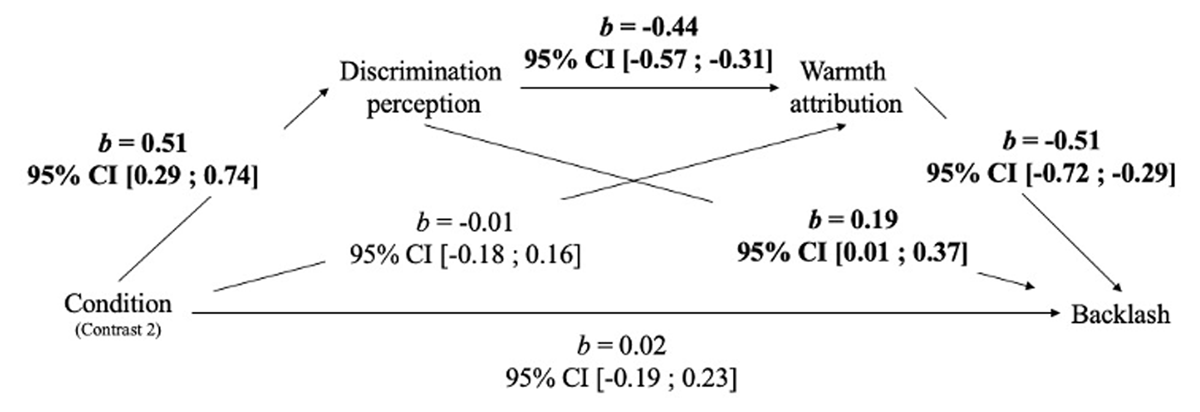
Figure 2
Pragmatic distancing mediation analysis.
Note: b = unstandardized coefficients; CI = confidence interval. Paths in bold are the significant ones.
C1 was added in the mediation analysis as a covariate.