
Table 1
Economic Indexes of France, Greece, Italy, and Portugal.
| Index | France | Greece | Italy | Portugal |
|---|---|---|---|---|
| GDP | ||||
| 2008 | 35.12k | 30.86k | 35.15k | 26.63k |
| 2012 | 37.48k | 25.28k | 35.75k | 26.45k |
| 2015 | 41.03k | 26.29k | 37.22k | 29.72k |
| Unemployment rate | ||||
| 2008 | 7.06 | 7.76 | 6.72 | 7.55 |
| 2012 | 9.40 | 24.44 | 10.65 | 15.53 |
| 2015 | 10.36 | 24.9 | 11.89 | 12.44 |
| Public Debt | ||||
| 2008 | 81.5 | 117.5 | 113.0 | 82.8 |
| 2012 | 110.4 | 164.5 | 136.2 | 137.1 |
| 2015 | 121.0 | 181.2 | 157.6 | 149.6 |
| Human Development* | 0.886 | 0.865 | 0.872 | 0.827 |
| GINI (inequality) | 33.1 | 36.7 | 35.2 | 36.0 |
[i] Note. Source: OECD (www.oecd.rg) except *United Nations (UNDP 2015). Data for the year of research (2012) in bold.
Table 2
Demographic Characteristics of Participants by Country.
| France (n = 558) | Greece (n = 751) | Italy (n = 497) | ||
|---|---|---|---|---|
| Sex | Male (%) | 49.4 | 48.9 | 34.4 |
| Female (%) | 50.6 | 51.1 | 65.6 | |
| Work Status | Working (%) | 57.1 | 48.1 | 64.6 |
| Not Working (%) | 42.9 | 51.9 | 35.4 | |
| Age | Range | 17–84 yrs | 18–83 yrs | 18–76 yrs |
| Mean (SD) | 38.7 (17.4) | 39.7 (14.9) | 31.5 (15.5) |

Figure 1
Confirmatory factor analysis of the perceived causes of the economic crisis (pooled data from Greece, France, and Italy; N = 1779; regression weights are standardized; all coefficients are statistically significant at α = .001).
Table 3
Standardized Regression Weights of the Perceived Causes of the Economic Crisis.
| Items/Parcels | France | Greece | Italy | |
|---|---|---|---|---|
| Factor 1 | c20 + c24 | 0.736 | 0.771 | 0.724 |
| c30 + c15 | 0.670 | 0.717 | 0.669 | |
| c8 + c25 | 0.729 | 0.746 | 0.715 | |
| c23 + c26 | 0.628 | 0.627 | 0.610 | |
| Factor 2 | c29 + c13 | 0.749 | 0.732 | 0.668 |
| c27 + c22 | 0.826 | 0.704 | 0.710 | |
| c19 | 0.671 | 0.593 | 0.604 | |
| Factor 3 | c11 + c32 | 0.853 | 0.830 | 0.864 |
| c17 | 0.770 | 0.738 | 0.698 | |
| Factor 4 | c4 + c3 | 0.765 | 0.792 | 0.701 |
| c5 | 0.737 | 0.808 | 0.669 | |
| Factor 5 | c1 + c9 | 0.841 | 0.892 | 0.800 |
| c2 | 0.638 | 0.708 | 0.617 | |
| Factor 6 | c6 | 0.689 | 0.643 | 0.728 |
| c12 | 0.726 | 0.639 | 0.710 |
Table 4
Multigroup Confirmatory Factor Analysis of the Perceived Causes of the Economic Crisis.
| Model (Invariance) | χ2 | df | χ2/df | CFI | RMSEA | SRMR | Model comparison | Δχ2 | df | ΔCFI | |
|---|---|---|---|---|---|---|---|---|---|---|---|
| Model 1 (Configural) | 820.51*** | 225 | 3.647 | 0.931 | 0.039 | 0.044 | |||||
| Model 2 (Metric) | 856.85*** | 243 | 3.526 | 0.929 | 0.038 | 0.046 | M1–M2 | 36.39 | ** | 18 | 0.002 |
| Model 3 (Scalar) | 2380.64*** | 273 | 8.720 | 0.755 | 0.066 | 0.059 | M2–M3 | 1523.79 | *** | 30 | 0.174 |
[i] Note. **p < 0.01. ***p < 0.001. Countries included in the analysis: France (n = 548), Greece (n = 739), and Italy (n = 492).
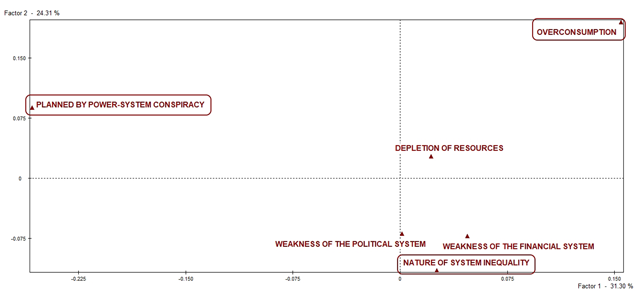
Figure 2
Factorial Correspondence Analysis on the perceived causes of the economic crisis (factorial axes 1, 2).
Table 5
Factor Means and Repeated-Measures ANOVAs of the Perceived Causes of the Economic Crisis within Countries.
| France (N = 556) | Greece (N = 739) | Italy (N = 490) | |
|---|---|---|---|
| F1. Depletion of resources | 4.12c | 3.96e | 4.05d |
| F2. Weakness of the financial system | 5.42a | 5.29b | 5.29b |
| F3. Planned by power-system conspiracy | 4.20c | 5.37b | 3.65e |
| F4. Nature of system inequality | 5.15b | 5.15c | 5.09c |
| F5. Overconsumption | 4.22c | 4.95d | 4.00d |
| F6. Weaknesss of the political system | 5.08b | 6.31a | 6.07a |
| F | 147.66*** | 437.80*** | 450.71*** |
| Partial η2 | 0.210 | 0.372 | 0.480 |
[i] Note. ***p < 0.001. Different letters indicate significant differences between pairs of means at α = 0.05 according to Bonferroni post-hoc test (within-country ANOVAs).
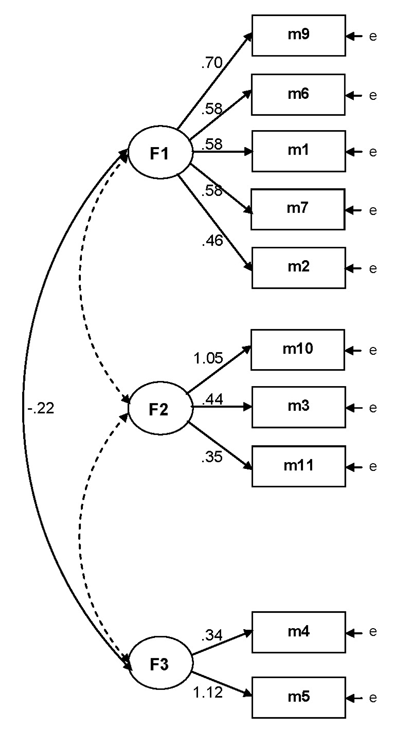
Figure 3
Confirmatory factor analysis of the proposed strategies to exit the economic crisis (pooled data from Greece, France, and Italy; N = 1785; regression weights are standardized; all coefficients are statistically significant at α = .001; dotted arrows indicate non-significant relationships).
Table 6
Multigroup Confirmatory Factor Analysis of the Proposed Measures for the Economic Crisis.
| Model (Invariance) | χ2 | df | χ2/df | CFI | RMSEA | SRMR | Model comparison | Δχ2 | df | ΔCFI |
|---|---|---|---|---|---|---|---|---|---|---|
| Model 1 (Configural) | 632.12*** | 96 | 6.585 | 0.808 | 0.056 | — | ||||
| Model 2 (Metric) | 770.89*** | 110 | 7.008 | 0.763 | 0.058 | — | M1–M2 | 138.77*** | 14 | 0.045 |
| Model 3 (Scalar) | 1891.26*** | 130 | 14.548 | 0.368 | 0.087 | — | M2–M3 | 1120.37*** | 20 | 0.395 |
[i] Note. **p < 0.01. ***p < 0.001. Countries included in the analysis: France (n = 556), Greece (n = 739), and Italy (n = 490). SRMR was not calculated because the model was not successfully fitted.