
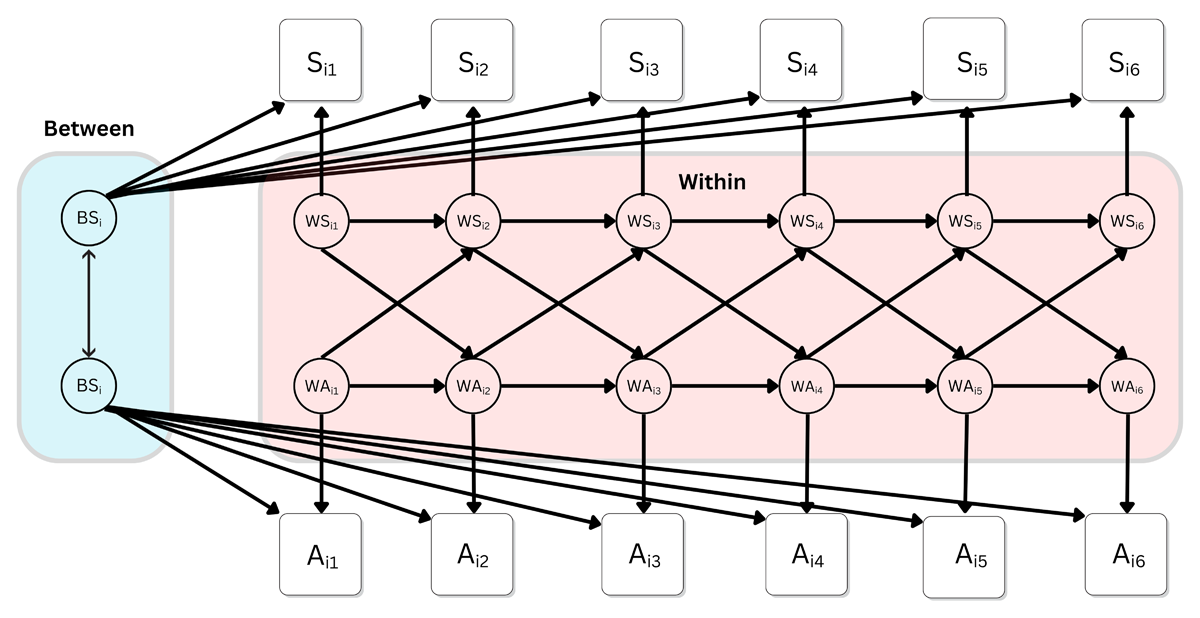
Figure 1
The RI-CLPM model-structure used in the present study, depicting the cross-lagged relationship between stress and affective polarization over six waves.
Note: Si1 represents the participants’ stress score at time T1, and so on to Si5 at time T5; Ai1 represents the participants’ affective polarization score at time T1, and so on to Si5 at time T5. BSi represents the participants’ random intercept, which captures their time-invariant deviation from the grand means, or the stable trait-like component. The within components (W) at each time represent the differences between participants’ observed score and their expected score based on their random intercept and the grand means.
Table 1
Descriptive statistics for all measures in the present study across the 6 survey waves (T1–T6).
| T1 M (SD) | T2 M (SD) | T3 M (SD) | T4 M (SD) | T5 M (SD) | T6 M (SD) | ICC | |
|---|---|---|---|---|---|---|---|
| Affective polarization | 3.5 (1.4) | 3.4 (1.5) | 3.6 (1.5) | 3.5 (1.5) | 3.5 (1.5) | 3.6 (1.5) | 0.86 |
| Social support | 3.2 (0.5) | 3.3 (0.5) | 3.3 (0.6) | 3.3 (0.6) | 3.3 (0.5) | 3.3 (0.6) | 0.84 |
| Perceived stress | 2.5 (0.8) | 2.4 (0.8) | 2.4 (0.8) | 2.4 (0.9) | 2.4 (0.9) | 2.4 (0.9) | 0.78 |
| Health | 3.3 (0.9) | 3.3 (0.9) | 3.3 (0.9) | 3.2 (0.9) | 3.2 (0.9) | 3.2 (0.9) | 0.88 |
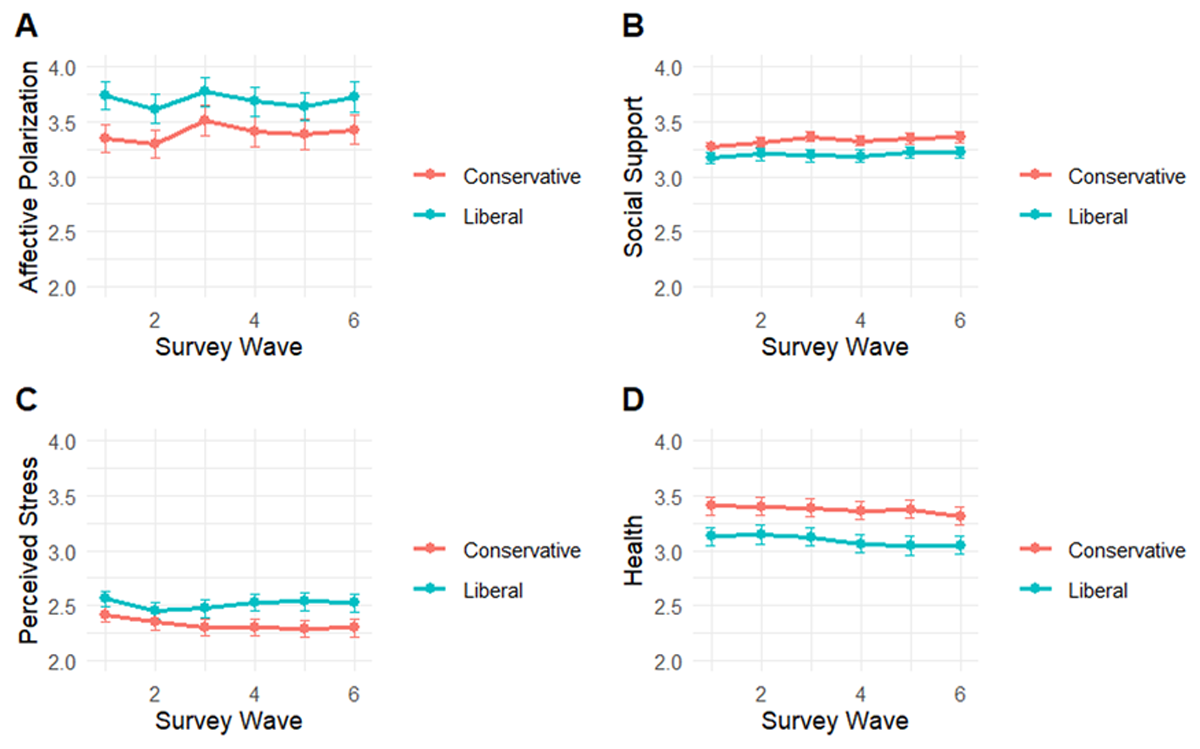
Figure 2
Trends in affective polarization, social support, perceived stress, and self-rated health among liberals (N = 237) and conservatives (N = 233), measured bi-weekly over the course of three months preceding the 2024 US presidential election.
Note: Scales do not begin at zero to allow for error bar visibility. Affective polarization values can range from 1–7, social support from 1–4, and perceived stress and health from 1–5. Error bars indicate 95% CIs.
Table 2
Fit statistics for the RI-CLPM models assessing hypotheses H1–H3.
| FIT STATISTIC (PRE-REGISTERED FIT CRITERIA) | H1 | H2 | H3 |
|---|---|---|---|
| RMSEA (<.06) | 0.05 | 0.04 | 0.05 |
| SRMR (<.08) | 0.04 | 0.04 | 0.03 |
| CFI (>.95) | 0.99 | 0.99 | 0.99 |
| TLI (>.90) | 0.99 | 0.99 | 0.99 |
| X2 | 93.67, p = .01 | 95.32, p = .008 | 87.43, p = .03 |
| ΔX2 (28) | 35.02, p = .17 | 34.66, p = .18 | 32.86, p = .24 |
[i] Note: ΔX2 (28) indicates the results of a chi-square difference test with 28 degrees of freedom between the constrained and unconstrained models.
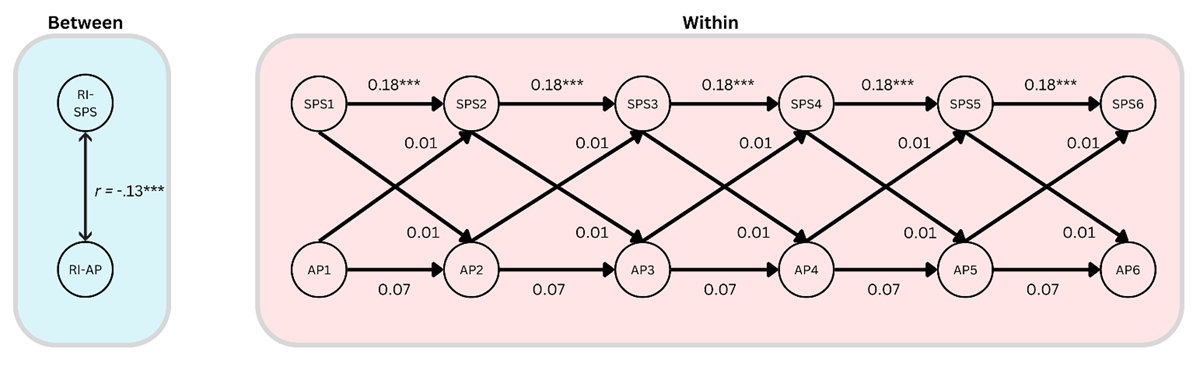
Figure 3
A simplified diagram of the RI-CLPM assessing relationships between affective polarization (AP) and social support (SPS), showing the within-person dynamics over time, and the stable between-person correlation.
Note: *** = p < .001.

Figure 4
A simplified diagram of the RI-CLPM assessing relationships between affective polarization (AP) and perceived stress (PSS), showing the within-person dynamics over time, and the stable between-person correlation.
Note: *** = p < .001, * = p < .05.
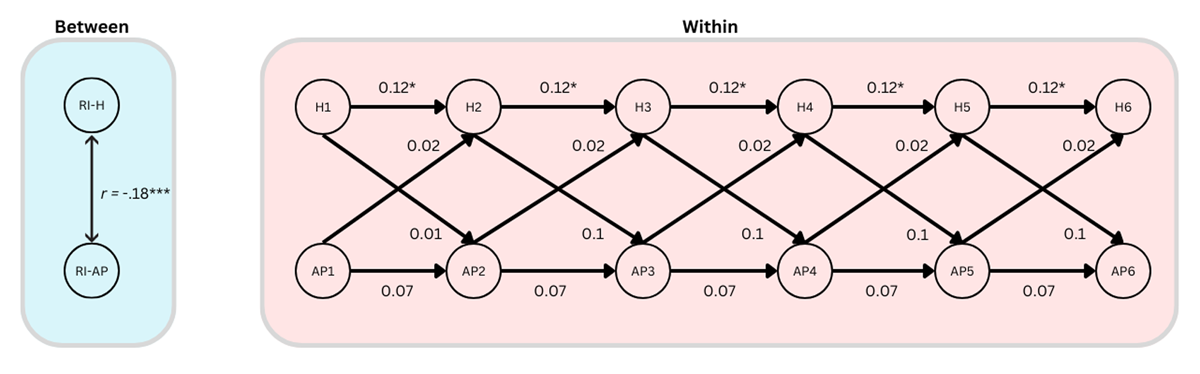
Figure 5
A simplified diagram of the RI-CLPM assessing relationships between affective polarization (AP) and self-reported health (H), showing the within-person dynamics over time, and the stable between-person correlation.
Note: *** = p < .001, * = p < .05.