
Table 1
Profile of participating Learning Communities (as of May 2018)*.
| LEARNING COMMUNITY | SCHOOL | NO. OF STUDENTS | PARTICIPATION IN FRSIS |
|---|---|---|---|
| Learning Community A Approximately 4,243 students. FOEI** Range of 80–127 | School 1 (Years 7–9, FOEI 127) | 878 | Yes, October 2016 |
| School 2 (Years 10–12, FOEI 119) | 650 | Yes, August 2017 | |
| School 3 (Years K–6, FOEI 120) | 537 | Yes, November 2017 | |
| School 4 (Years K–6, FOEI 124) | 487 | Yes, November 2017 | |
| School 5 (Years K–6, FOEI 103) | 466 | Yes, December 2017 | |
| School 6 (Years K–6, FOEI 93) | 768 | Yes, February 2018 | |
| School 7 (Years K–6, FOEI 80) | 457 | No | |
| Learning Community B Approximately 4,459 students. FOEI Range of 126–150 | School 8 (Years 7–12, FOEI 137) | 832 | No |
| School 9 (Years 7–12, FOEI 126) | 963 | Yes, March 2018 | |
| School 10 (Years K–6, FOEI 135) | 574 | Yes, December 2017 | |
| School 11 (Years K–6, FOEI 140) | 551 | Yes, February 2018 | |
| School 12 (Years K–6, FOEI 150) | 609 | Yes, February 2018 | |
| School 13 (Years K–6, FOEI 143) | 382 | Yes, March 2018 | |
| School 14 (Years K–6, FOEI 131) | 548 | Yes, March 2018 | |
| Learning Community C Approximately 1,764 students. FOEI Range of 116–135 | School 15 (Years 7–9, FOEI 123) | 717 | No |
| School 16 (Years K–6, FOEI 135) | 237 | Yes, March 2018 | |
| School 17 (Years K–6, FOEI 118) | 375 | Yes, March 2018 | |
| School 18 (Years K–6, FOEI 116) | 435 | Yes, May 2018 |
[i] * Data sources: FRSIS documentation and My School website https://www.myschool.edu.au/, coded here for anonymity. ** Family Occupation and Education Index (FOEI) Scores greater than 100 (the mean) indicate educational disadvantage related to socio-economic background.
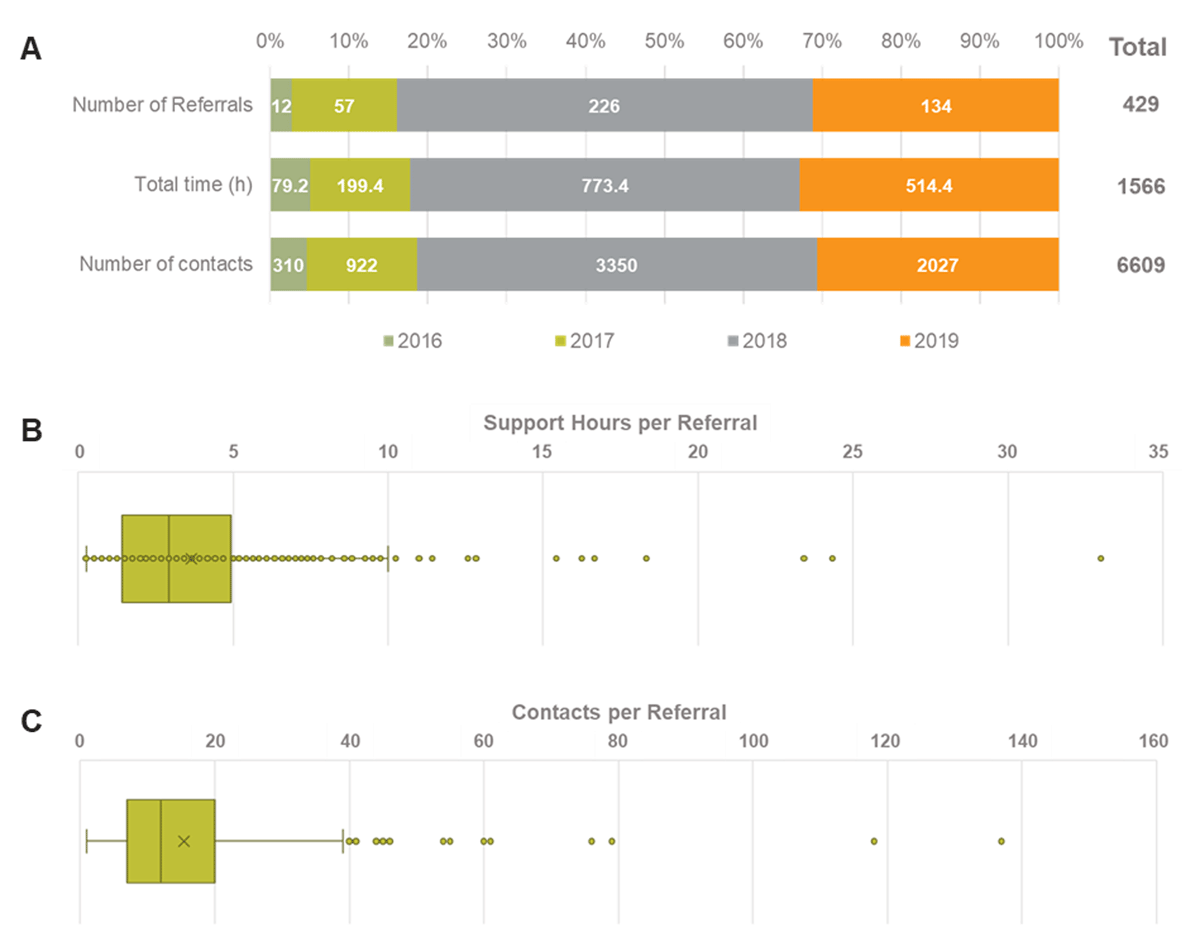
Figure 1
Profile of FRSIS referrals by year (A), support hours (A, B) and contacts made (A, C).
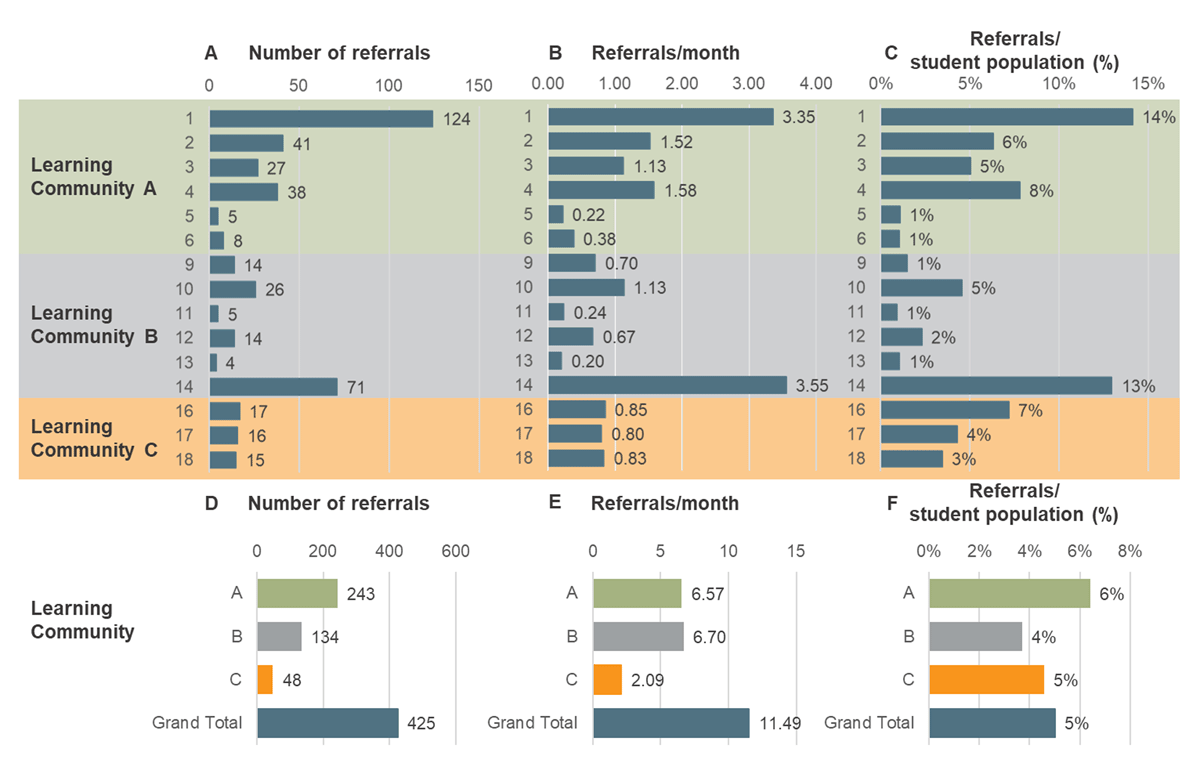
Figure 2
FRSIS referrals: total number* (A, D), per month (B, E) and per student population (%, C, F) by school and Learning Community respectively.
* We note that 4 referrals were made by Department of Education staff outside of schools, these have been omitted here for clarity.
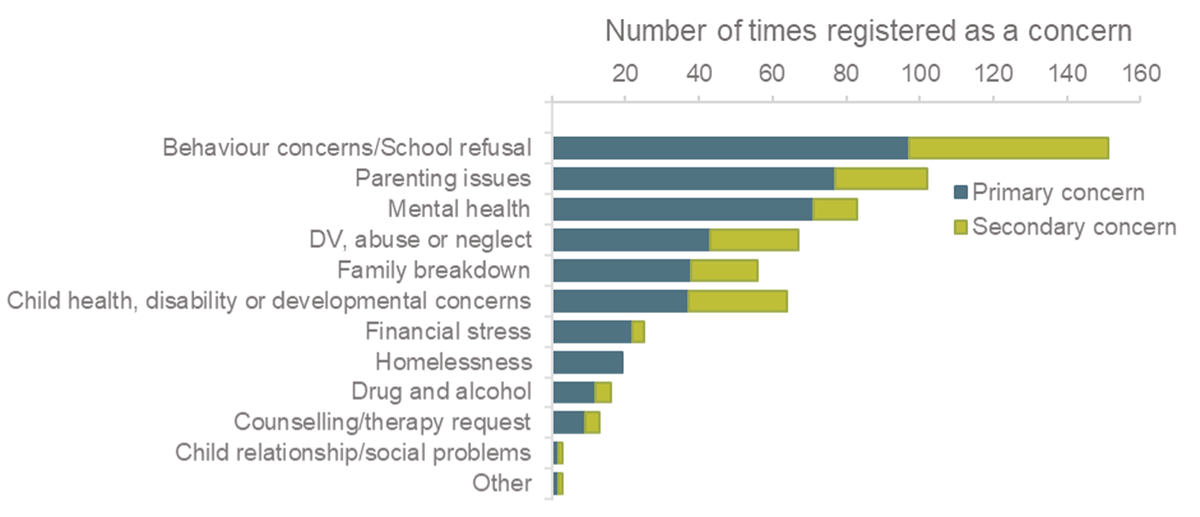
Figure 3
Primary and secondary reasons for referral to FRSIS.
Table 2
Types of services for outbound referrals.
| TYPE OF REFERRAL SERVICE | n 417 | |
|---|---|---|
| Social Care – including departmental initiatives, other counselling, drug and alcohol services | 211 | |
| Parent/family support | 92 | |
| Other counselling | 42 | |
| Housing | 22 | |
| Welfare | 37 | |
| Centrelink | 9 | |
| Gambling counselling | 1 | |
| Child Protection Helpline | 5 | |
| Drug and alcohol | 3 | |
| Health | 110 | |
| Mental health counselling | 67 | |
| GP | 11 | |
| Health | 25 | |
| Paediatrician | 6 | |
| Speech Pathologist | 1 | |
| Education | 10 | |
| Education | 9 | |
| Vocational Training Provider | 1 | |
| Other – including legal, sport and recreation and disability services | 86 | |
| Sport and recreation | 16 | |
| Legal support | 11 | |
| Disability | 29 | |
| Other (not specified) | 30 |
Table 3
Summary of main reasons provided for not referring families to other services.
| REASON | N |
|---|---|
| Client did not meet the service criteria – Family already linked with service (including having an open plan with CSC*) | 71 |
| Information only given | 34 |
| Family declined | 25 |
| Family not able to be contacted | 20 |
| Family will self-refer | 12 |
| Further assessment required | 12 |
| Client deteriorated and couldn’t access referral | 2 |
| No appropriate service | 1 |
[i] *CSC = Community Service Centre for Department of Community and Justice.