
Table 1
Participant characteristics.
| CHARACTERISTICS | WINTER COHORT 2017 (N = 458) | WINTER COHORT 2018 (N = 594) | BOTH WINTER 2017 & 2018 (N = 192)1 | ALL PARTICIPANTS (N = 1244) |
|---|---|---|---|---|
| Age – Mean (SD) | 74.9 (13.18) | 73.9 (11.60) | 76.0 (12.15) | 74.6 (12.30) |
| Sex (% Female) | 255 (55.7%) | 339 (57.1%) | 101 (52.6%) | 695 (55.9%) |
| Current Smoker | 46 (10.0%) | 27 (4.5%) | 14 (7.3%) | 87 (7.0%) |
| Disability or aged pension | 233 (50.9%) | 459 (77.3%) | 105 (54.7%) | 797 (64.1%) |
| Health card holder | 38 (8.3%) | 90 (15.2%) | 29 (15.1%) | 157 (12.6%) |
| Comorbidities | ||||
| Congestive Cardiac Failure | 71 (15.5%) | 44 (7.4%) | 29 (15.1%) | 144 (11.6%) |
| COPD3 | 152 (33.2%) | 154 (25.9%) | 94 (49.0%) | 400 (32.2%) |
| Ischemic Heart Disease | 169 (36.9%) | 104 (17.5%) | 60 (31.3%) | 333 (26.8%) |
| Diabetes | 156 (34.1%) | 140 (23.6%) | 62 (32.3%) | 358 (28.8%) |
| Chronic Kidney Disease | 51 (11.1%) | 54 (9.1%) | 37 (19.3%) | 142 (11.4%) |
| Asthma | 98 (21.4%) | 133 (22.4%) | 42 (21.9%) | 273 (21.9%) |
| Number of Comorbidities | ||||
| No comorbidities | 92 (20.1%) | 3 (0.5%) | 37 (19.3%) | 132 (10.6%) |
| 1 comorbidity | 267 (58.3%) | 299 (50.3%) | 102 (53.1%) | 668 (53.7%) |
| 2 comorbidities | 87 (19.0%) | 223 (37.5%) | 45 (23.4%) | 355 (28.5%) |
| 3 or more comorbidities | 12 (2.6%) | 69 (11.6%) | 8 (4.2%) | 89 (7.2%) |
| Mental Health | ||||
| Depression or anxiety | 114 (24.9%) | 142 (23.9%) | 40 (20.8%) | 296 (23.8%) |
| Active alcohol and/or other drug use issues | 15 (3.3%) | 12 (2.0%) | 2 (1.0%) | 29 (2.3%) |
| Other mental health conditions | 38 (8.3%) | 27 (4.5%) | 7 (3.6%) | 72 (5.8%) |
| Other | ||||
| Medications – Prescribed more than 5 medications | 333 (72.7%) | 439 (73.9%) | 130 (67.7%) | 902 (72.5%) |
| Care Plan – Reviewed in the last 6 months | 298 (65.1%) | 461 (77.6%) | 165 (85.9%)2 | 892 (71.7%) |
| Sick day action plan | 47 (10.3%) | 178 (30.0%) | 43 (22.4%)2 | 242 (19.5%) |
[i] Notes:
1. Baseline demographic characteristics taken from 2017 enrolment information.
2. Care plans and sick day plan statistics taken from 2018 enrolment information for this cohort.
3. Chronic Obstructive Pulmonary Disease.
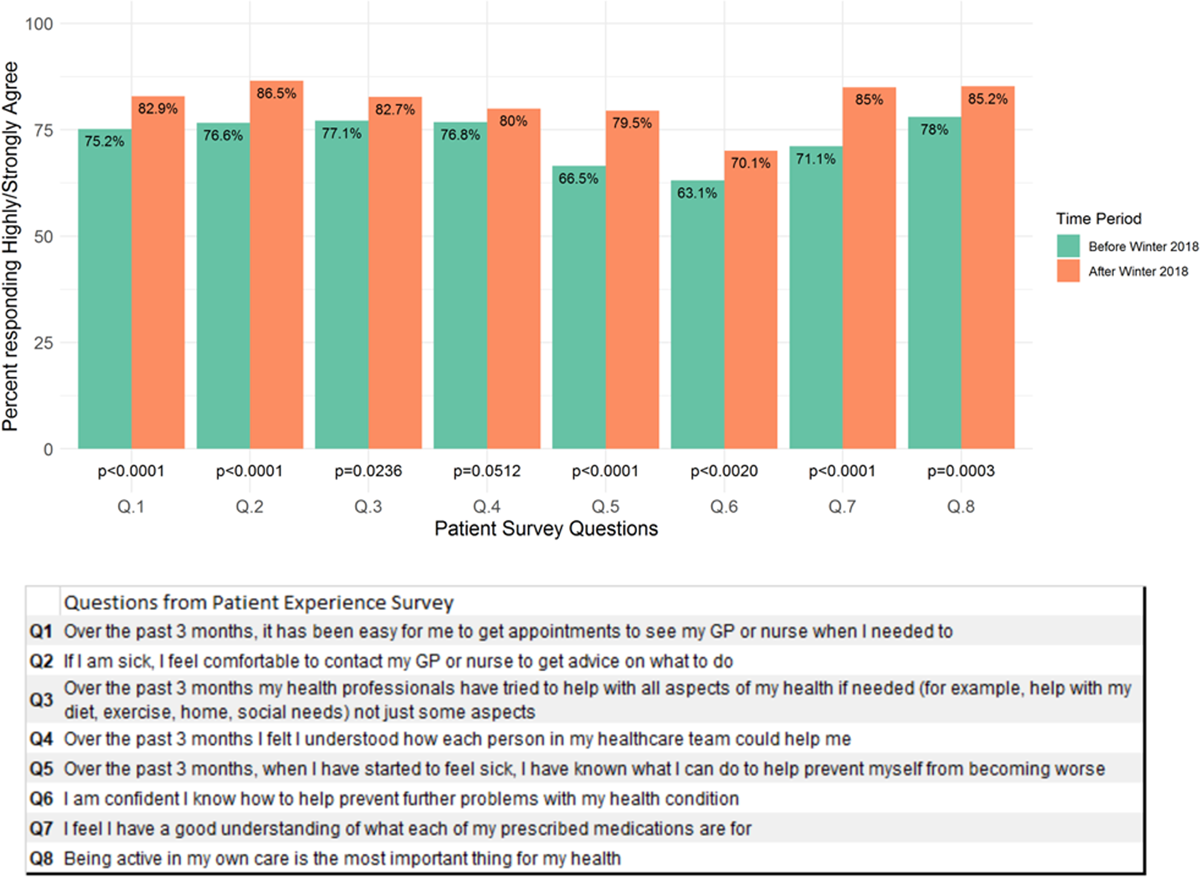
Figure 1
Patient experience survey responses (n = 608) before and after participation in the Winter Strategy in 2018.
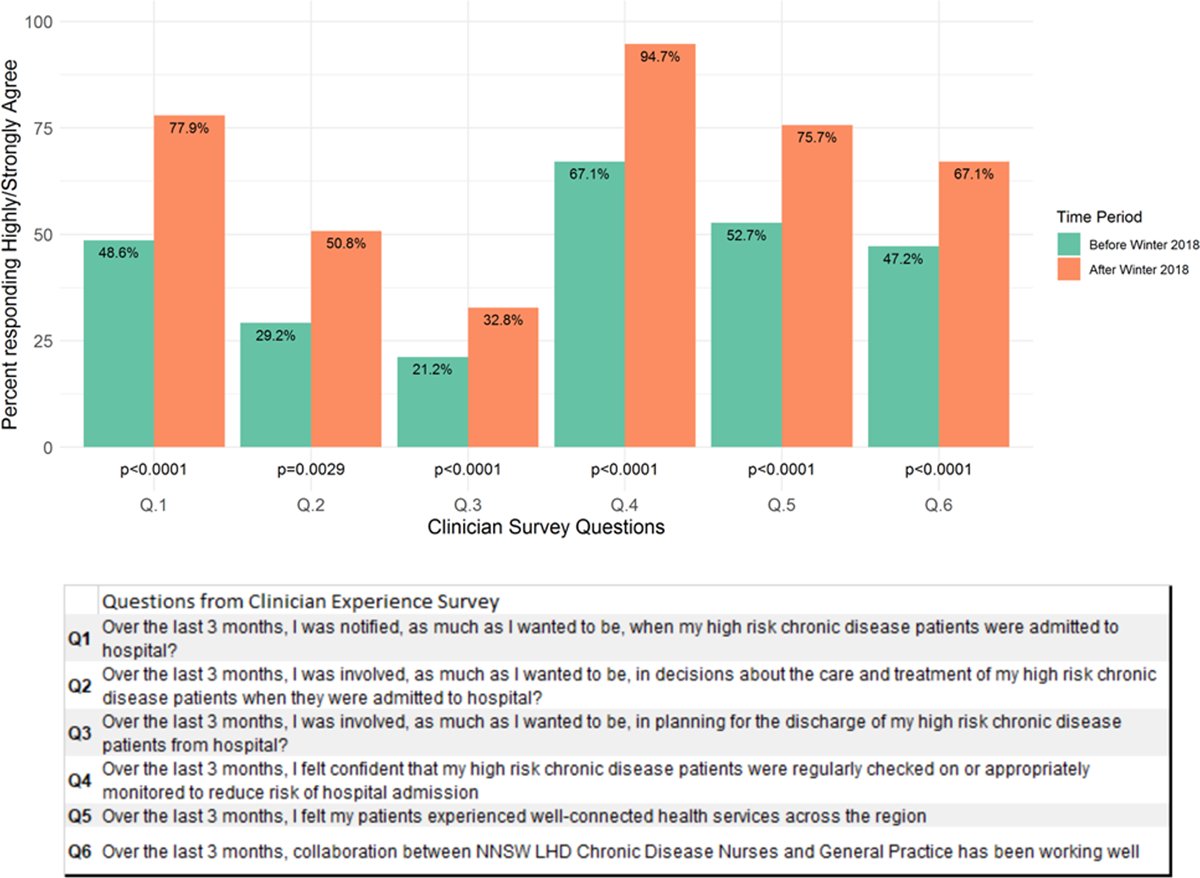
Figure 2
Clinician experience responses (n = 78) before and after participating in the Winter Strategy in 2018.
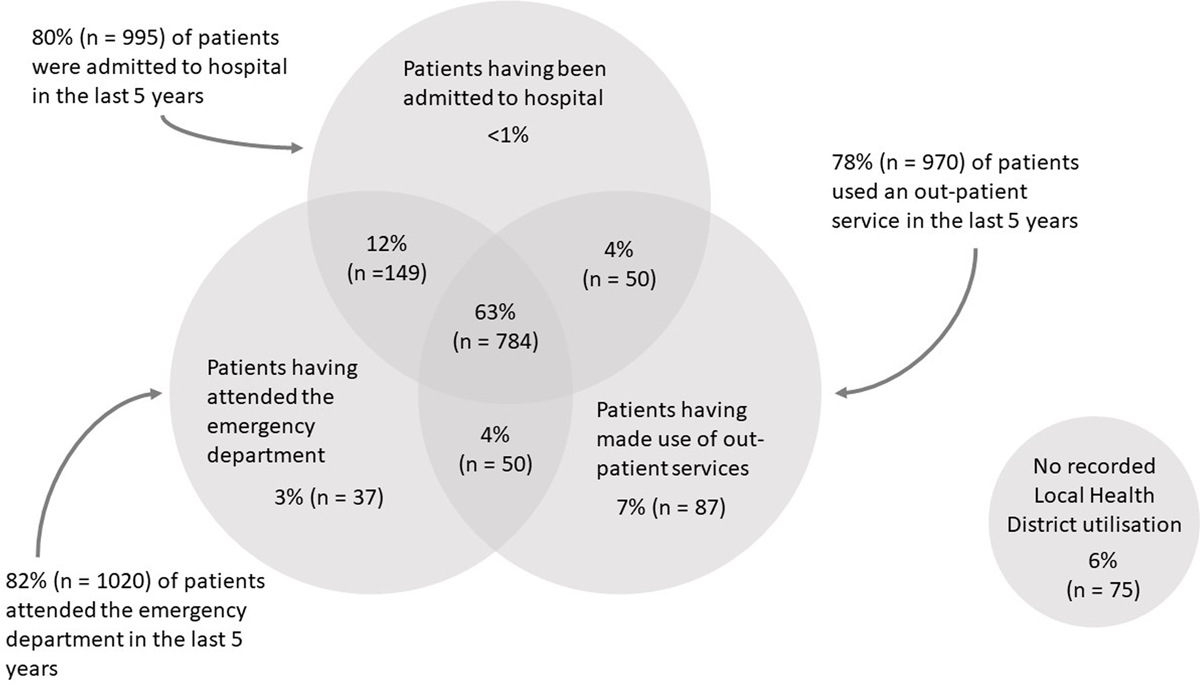
Figure 3
Winter Strategy participants’ use of health services within 5 years prior to enrolment (n = 1244).
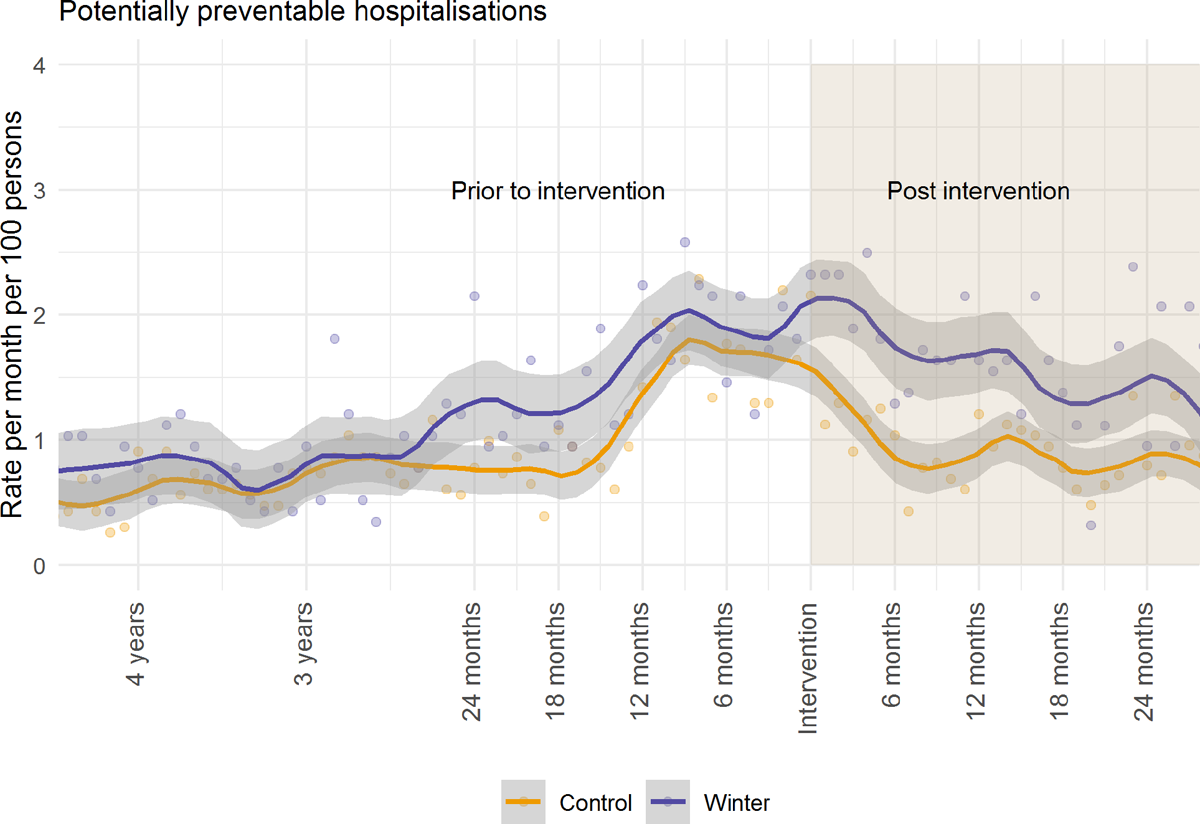
Figure 4
Potentially preventable hospitalisation rate (per 100 people per month) before and after the intervention, for all Winter Strategy participants.
Table 2
Hospitalisation utilisation rate per 100 people per month between Winter and comparison cohorts.
| OUTCOME (RATE PER 100 PEOPLE) | MEAN DIFFERENCE (PRE-POST INTERVENTION) 95% CI | ADJUSTED* DIFFERENCE IN DIFFERENCE ESTIMATE | p-VALUE | |
|---|---|---|---|---|
| WINTER COHORT | COMPARISON COHORT | |||
| Potentially preventable hospitalisations | –0.9 (–0.91, –0.89) | –10.0 (–10.13, –9.94) | 1.67 (1.21, 2.27) | 0.0018 |
| All cause hospitalisations | –3.4 (–3.55, –3.48) | –34.1 (–34.14, –34.06) | 1.52 (1.31, 1.79) | <0.0001 |
| Unplanned hospitalisations | –3.1 (–3.11, –3.09) | –29.3 (–29.25, –29.4) | 1.62 (1.31, 1.94) | <0.0001 |
| Planned hospitalisations | –0.4 (–0.41, –0.39) | –4.7 (–4.71, –4.67) | 1.31 (1.00, 1.94) | 0.047 |
| Total emergency department presentations (total) | –15.4 (–15.66, –15.14) | –37.8 (–37.90, –37.75) | 1.26 (1.04, 1.52) | 0.018 |
| Semi urgent and non-urgent emergency department presentations | –6.2 (–6.44, –5.94) | –9.1 (–9.11, –9.08) | 1.16 (0.87, 1.54) | 0.32 |
| Potentially preventable bed days | 7.8 (7.47, 8.13) | –55.7 (–55.91, –55.49) | 1.53 (0.94, 2.48) | 0.09 |
| Total NWAU | –10.6 (–10.61, –10.52) | –52.9 (–52.83, –52.94) | 1.43 (1.13, 1.81) | 0.0028 |
[i] * Adjusted for sex, marital status, year of birth and SEIFA; generalised estimating equation with the log link function, negative binomial distribution, and compound symmetry correlation structure.