
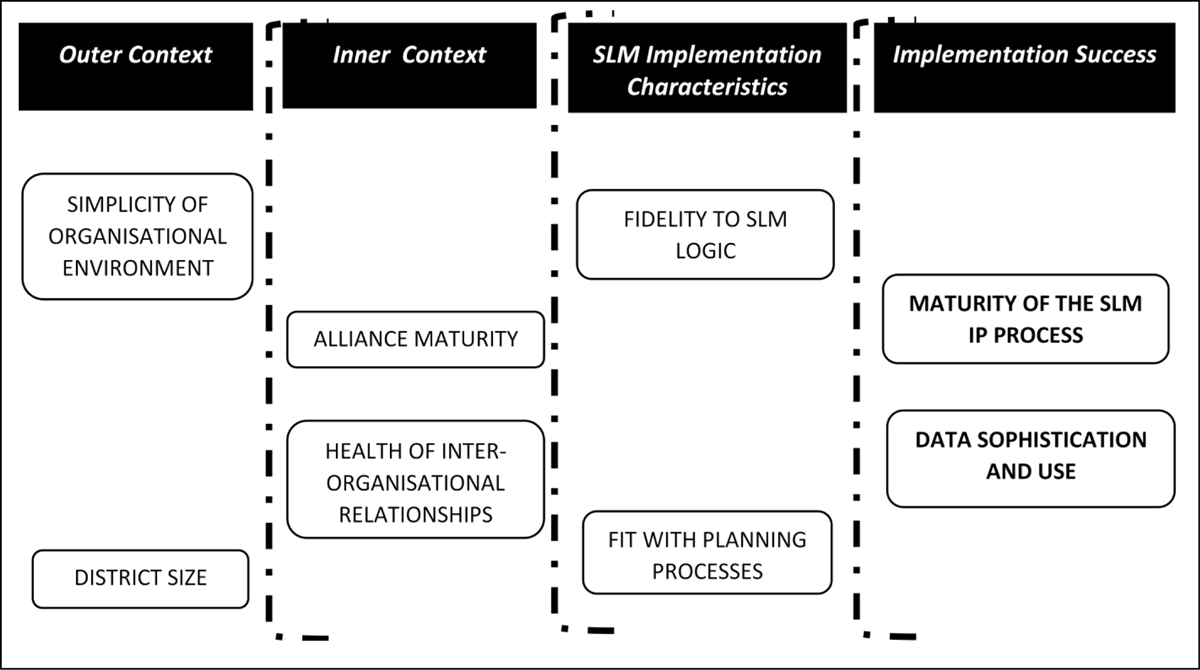
Figure 1
A framework for analysing the implementation success of SLMF.
Table 1
Configurations for Maturity of SLM Improvement Plan processes success (Outcome 1).
| CONDITIONS | SOLUTIONS | ||
|---|---|---|---|
| 1 | 2 | 3 | |
| DHB Size | • | ⊗ | • |
| Simplicity of I-O relation | ⊗ | • | - |
| Alliance maturity | – | • | • |
| Health of I-O relation | ⊗ | • | • |
| Fidelity to SLM logic | • | • | • |
| SLM fit | ⊗ | – | • |
| Frequency of cases (District names) | 2 (B, P) | 6 (D, E, J, K, U, Z) | 2 (R, Y) |
| Consistency | 1.00 | 1.00 | 1.00 |
| Raw coverage | 0.31 | 0.59 | 0.39 |
| Unique coverage | 0.11 | 0.30 | 0.11 |
| Solution coverage | 0.83 | ||
| Solution consistency | 1.00 | ||
[i] Notation: (“•”) = presence of a condition; (“⊗⊗”) = absence of a condition; (“-”) = ‘don’t care’ situation where the condition is either present or absent [50].
Table 2
Configurations for achieving success: data sophistication and use (Outcome 2).
| CONDITIONS | SOLUTIONS | ||
|---|---|---|---|
| 1 | 2 | 3 | |
| DHB Size | ⊗ | • | • |
| Simplicity of I-O relation | • | – | ⊗ |
| Alliance maturity | • | • | ⊗ |
| Health of I-O relation | • | • | ⊗ |
| Fidelity to SLM logic | • | • | • |
| SLM fit | – | • | ⊗ |
| Frequency of cases | 6 (D, E, J, K, U, Z) | 2 (R, Y) | 1 (B) |
| Consistency | 0.89 | 0.95 | 0.91 |
| Raw coverage | 0.61 | 0.45 | 0.27 |
| Unique coverage | 0.29 | 0.13 | 0.08 |
| Solution coverage | 0.85 | ||
| Solution consistency | 0.92 | ||
[i] Notation: (“•”) = presence of a condition; (“⊗”) = absence of a condition; (“-”) = ‘don’t care’ situation where the condition is either present or absent [50].