
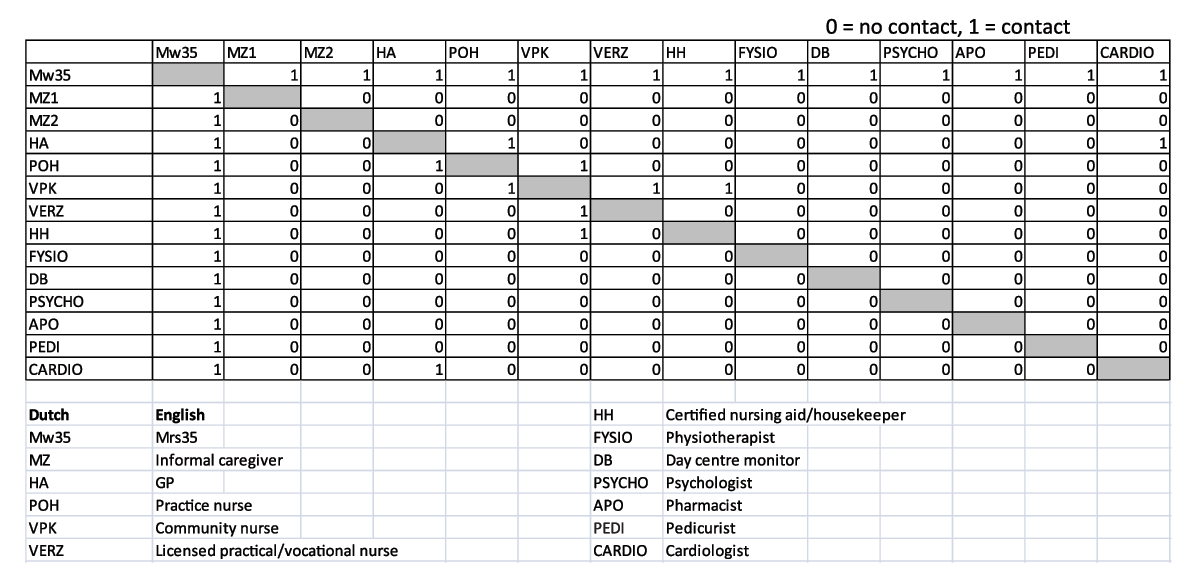
Figure 1
Example of the adjacency matrix for ‘Mrs. 35’.
Table 1
Care network metrics of interest and their definitions.
| Metric | Definition | |
|---|---|---|
| 1. | Network size (ego-level) | Number of actors in the network, including the respondent |
| 2. | Ties (network-level) | Number of connections in a network. One tie represents two connections, as within the care networks, all ties are two-way connections |
| 3. | Density (network-level) | Proportion of all possible ties: number of ties/((total number of actors) * (total number of actors – 1)) |
| 4. | Centrality (ego-level) | Centrality of the respondent as an attribute of the individual actors, as a consequence of their position |
| 5. | Sub-groups (network-level) | Number of sub-groups. A sub-group is a sub-set of a network in which the actors are more closely and intensely tied to one another than they are to other members of the network |
Table 2
Characteristics of the study population (n = 44).
| n (%) | |
|---|---|
| Gender | |
| Male | 13 (30) |
| Female | 31 (70) |
| Age (average; [min–max]): | 84 [69–98] |
| 65–79 | 13 (30) |
| ≥80 | 31 (70) |
| Polypharmacy (≥5 medicines): | 32 (73) |
| Amount of chronic diseases: | |
| 2–4 | 15 (34) |
| 5–7 | 18 (41) |
| ≥8 | 11 (25) |
| Care co-ordinated by* | |
| general practitioner/practice nurse | 12 (50) |
| In-home care provider | 10 (42) |
| other | 2 (5) |
| no-one | 17 (39) |
| ‘I don’t know’ | 3 (7) |
| Informal caregiver**: | |
| spouse | 4 (9) |
| children/son-/-daughter-in-law | 32 (73) |
| other family members | 17 (39) |
| neighbours/friends/acquaintances | 15 (34) |
| none | 3 (7) |
[i] * Patients could have more than one care co-ordinator.
** Patients could have more than one informal caregiver.
Table 3
Perceived collaboration between general practices* and others.
| Collaboration | General practice* and in-home care providers | General practice and medical specialists | General practice and allied medical** professionals | General practice and social services | General practice and informal caregivers*** | |||||
|---|---|---|---|---|---|---|---|---|---|---|
| Answer | % | (n****) | % | (n) | % | (n) | % | (n) | % | (n) |
| Yes | 61% | (51) | 59% | (61) | 29% | (37) | 12% | (14) | 34% | (60) |
| No | 21% | (17) | 20% | (21) | 55% | (72) | 68% | (78) | 59% | (102) |
| Unknown | 13% | (11) | 16% | (17) | 14% | (18) | 19% | (22) | 3% | (5) |
| Presumption | 5% | (4) | 5% | (5) | 2% | (3) | 1% | (1) | 4% | (7) |
| Total | 100% | (83) | 100% | (104) | 100% | (130) | 100% | (115) | 100% | (103) |
[i] * General practices include: general practitioners, practice nurses, practice assistant, pharmacists, and dentists. ** See appendix 2 for a full list of allied medical professionals. *** Respondents reported up to three informal caregivers. **** n = number of answers given, which can transcend the number of respondents.

Figure 2
Examples of the three network typologies.
Table 4
Features of network typologies.
| Network type | Number (% of total) Simple star | Number (% of total) Complex star | Number (% of total) Sub-group | Number (% of total) Total | ||||||||
|---|---|---|---|---|---|---|---|---|---|---|---|---|
| 16 (36) | 16 (36) | 12 (27) | 44 (100) | |||||||||
| Characteristic | mean | min–max | SD | mean | min–max | SD | mean | min–max | SD | mean | min–max | SD |
| Number of actors | 11 | 6–15 | 3.1 | 15 | 12–19 | 2.2 | 19 | 14–26 | 3.4 | 14.5 | 6–26 | 4.2 |
| Number of ties | 31.4 | 14–56 | 11.9 | 55.6 | 38–77 | 10.5 | 80.9 | 56–192 | 38.2 | 53.7 | 14–192 | 29.3 |
| Average density | 0.3 | 0.2–0.6 | 0.1 | 0.3 | 0.2–0.5 | 0.1 | 0.2 | 0.2–0.3 | 0 | 0.3 | 0.2–0.6 | 0.1 |
| Centrality | 0.9 | 0.5–1.0 | 0.1 | 0.8 | 0.6–0.9 | 0.1 | 0.8 | 0.8–0.9 | 0.1 | 0.8 | 0.5–1.0 | 0.1 |
| Number of sub-groups | 3.2 | 0–5 | 1.4 | 6.7 | 6–8 | 0.8 | 10.8 | 9–15 | 1.7 | 6.5 | 0–15 | 3.3 |
| Number (%) of networks of each type in which the informal caregiver is the central person next to the respondent | ||||||||||||
| Informal caregiver | 3 (19) | 6 (38) | 4 (33) | 13 (30) | ||||||||