
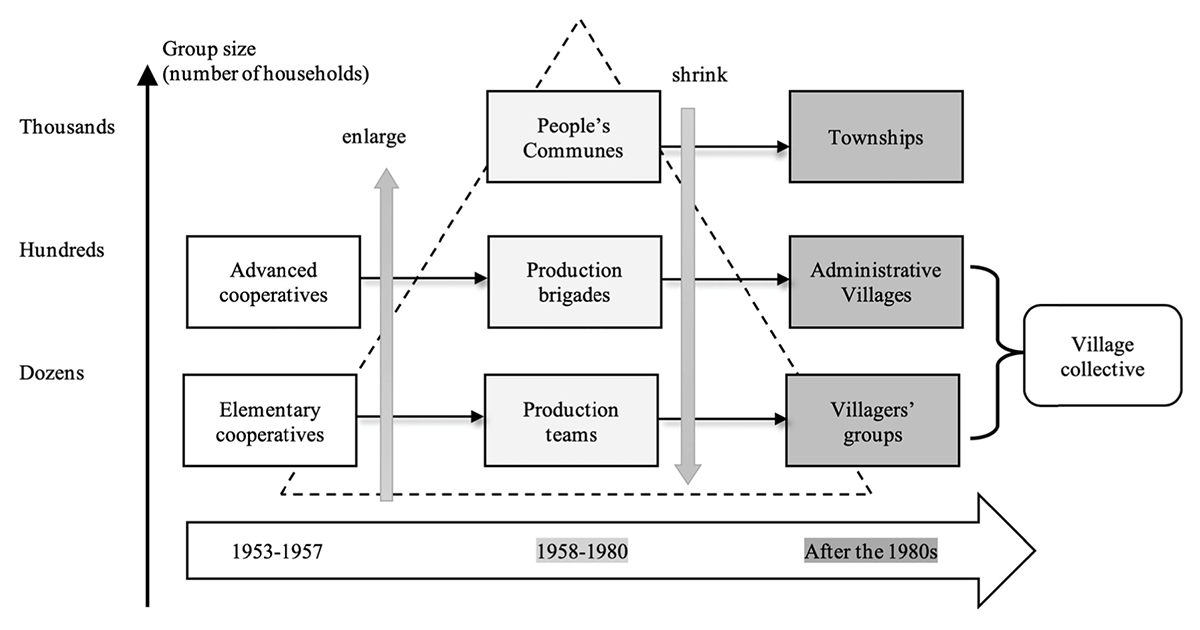
Figure 1
Rural governance units in different periods: group size, evolution, and correspondences.
Table 1
The types of forests and their management regimes in the early 2000s.
| Timber forests | Ecological forests | Economic forests | Bamboo forests | |
|---|---|---|---|---|
| Main purposes (functions) | Produce commercial timber | Environmental and farmland protection, national defence, scientific research, etc. | Produce fruits, woody oil plants, medicinal plants, industrial raw materials, etc. | Produce bamboo timber and bamboo sprouts |
| Predominant species | Chinese fir (Cunninghamia lanceolata), Masson pine (Pinus massoniana) | Diversified species: various coniferous trees, broadleaf trees, etc. | Diversified species: various fruit trees, tea, camellia, etc. | Meso bamboo (Phyllostachys edulis) |
| Proportion of area (%) | 49 | 32 | 11 | 9 |
| Predominant management regime | Diversified | Collective | Household-based | Household-based |
[i] Note: Proportion of area is at the provincial level; data is from China Forestry Handbook (2017).
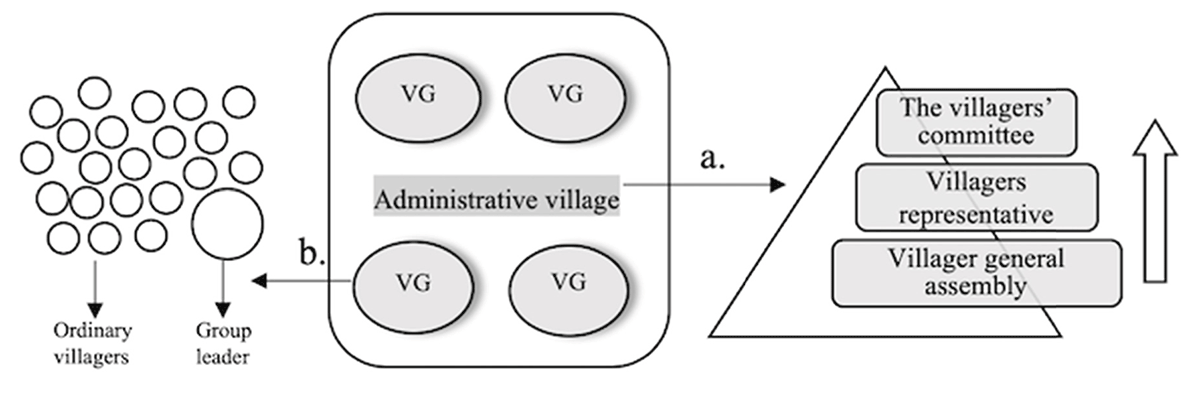
Figure 2
Governance structures of the administrative village and villagers’ groups.
Note: VG denotes villagers’ groups. a. and b. denote the governance structures of administrative villages and villagers’ groups.
Table 2
Basic conditions of two cases.
| X | B | |
|---|---|---|
| Number of villagers’ groups | 10 | 11 |
| Number of households | 426 | 987 |
| Total population | 1640 | 2906 |
| Per-capita income (CNY) | 14285 | 18231 |
| Proportion of villagers whose surnames are among the ten most popular ones in the village | 60% | 51% |
| Proportion of forest-related income in total income | 5.7% | 6.1% |
| Total area of forests (ha) | 1768 | 459 |
| Area of forests that were partitioned into villagers’ groups (ha) | 286 | 201 |
| Outcomes of the restructuring | Mixed | Positive |
[i] Note: Data is collected from village archives (Year of 2015).
Table 3
Forestland plots distributed to FUGs in X Village and B Village.
| Village | FUG No. | Number of forest parcels | Total area of forests (ha) | Total number of members | Average size of forest parcels (ha) | Standard errors of parcels (ha) | Forest species |
|---|---|---|---|---|---|---|---|
| X Village | 1 | 8 | 40.53 | 241 | 5.07 | 3.67 | 1,2 |
| 2 | 4 | 40.80 | 222 | 10.20 | 6.69 | 1,2 | |
| 3 | 7 | 41.80 | 231 | 5.97 | 4.12 | 1,2,3 | |
| 4 | 9 | 41.80 | 248 | 4.64 | 3.41 | 1,2 | |
| 5 | 9 | 41.73 | 186 | 4.64 | 2.17 | 1,2,3 | |
| 6 | 6 | 40.33 | 254 | 6.72 | 4.24 | 1,2 | |
| 7 | 8 | 39.47 | 130 | 4.93 | 3.17 | 1,2 | |
| In total | 51 | 286.47 | 1512 | ||||
| B Village | 1 | 2 | 18.13 | 207 | 9.07 | 6.00 | 1 |
| 2 | 3 | 18.87 | 215 | 6.29 | 5.33 | 1 | |
| 3 | 4 | 18.33 | 209 | 4.58 | 3.59 | 1 | |
| 4 | 2 | 18.67 | 213 | 9.33 | 5.72 | 1 | |
| 5 | 4 | 18.07 | 206 | 4.52 | 2.30 | 1 | |
| 6 | 3 | 18.07 | 206 | 6.02 | 3.86 | 1 | |
| 7 | 3 | 17.40 | 199 | 5.80 | 3.86 | 1 | |
| 8 | 4 | 19.13 | 218 | 4.78 | 4.28 | 1 | |
| 9 | 4 | 18.87 | 215 | 4.72 | 3.67 | 1 | |
| 10 | 3 | 17.27 | 197 | 5.76 | 3.78 | 1 | |
| 11 | 2 | 17.87 | 204 | 8.93 | 6.44 | 1 | |
| In total | 34 | 200.67 | 2289 |
[i] Note: Data is collected from village archives. Tree species: 1. the Chinese fir 2. the pine tree 3. mixed forests.
Table 4
Villagers’ subjective assessment of changes in the forest management outcomes.
| Indicators | Transparency of collective decision-making | Strength of monitoring FUG managers | Equity of allocating timber revenues | Number of timber thefts | Capacity for investing in forest management activities | Costs of conducting forest management activities | Overall satisfaction with forest management | |
|---|---|---|---|---|---|---|---|---|
| Villages | Frequency (%) | |||||||
| X Village (sample size = 53) | ||||||||
| increase | 53 | 51 | 60 | 2 | 25 | 40 | 72 | |
| no change | 32 | 34 | 17 | 21 | 36 | 34 | 13 | |
| decrease | 8 | 8 | 11 | 70 | 21 | 15 | 13 | |
| hard to say | 8 | 8 | 11 | 8 | 19 | 11 | 2 | |
| Is the change significant? (p-value) | 0.00 | 0.00 | 0.00 | 0.00 | 0.68 | 0.02 | 0.00 | |
| B Village (sample size = 40) | ||||||||
| increase | 78 | 73 | 78 | 0 | 43 | 30 | 83 | |
| no change | 15 | 23 | 13 | 23 | 50 | 40 | 10 | |
| decrease | 5 | 3 | 3 | 75 | 8 | 25 | 5 | |
| hard to say | 3 | 3 | 8 | 3 | 0 | 5 | 3 | |
| Is the change significant? (p-value) | 0.00 | 0.00 | 0.00 | 0.00 | 0.00 | 0.67 | 0.00 | |
| Is the change different between X Village and B Village (p-value) | 0.10 | 0.15 | 0.28 | 0.74 | 0.00 | 0.41 | 0.56 | |
[i] Note: One sample median test (Wilcoxon signed-rank test) is used to test for a given village, whether the indicator has significant change after the restructuring (samples choosing hard to say are excluded). Fisher’s exact test is used to test if the indicator has different changes across two villages.
Table 5
Comparing six cases that partitioned forests into subgroups from China and Mexico.
| Village name | X Village | B Village | Caoba | Petcacab | Canelas | Santa Marta |
|---|---|---|---|---|---|---|
| Community characteristics | ||||||
| Village types and region | Administrative villages, Fujian, China | Ejidos, Quintana Roo, Mexico | Agrarian communities, Durango, Mexico | |||
| Tree species | Chinese fir, Masson pine | Mahogany, cedar | pine and oak | |||
| Total area of forests (ha) | 1768 | 459 | 32500 | 32500 | 158000 | 17000 |
| Number of village members | 1640 | 2906 | 1535 | 947 | 829 | 630 |
| Characteristics of subgroups and restructuring strategies | ||||||
| Major driving force | Top-down | Top-down | Bottom-up | Bottom-up | Bottom-up | Bottom-up |
| Number of subgroups | 7 | 11 | 7 | 11 | 11 | 4 |
| Subgroups vary in size | NO | NO | YES | YES | YES | YES |
| Farmers can select group partners | NO | NO | YES | YES | YES | YES |
| Sub-division of subgroups or even individualization | NO | NO | NO | YES | YES | NO |
| Transfer of physical forests | YES | YES | NO | NO | YES | NO |
| Transfer of decision-making power to subgroups | YES | YES | YES | YES | YES | YES |
| Outcomes of the restructuring | ||||||
| Participation in community forestry | Increase | Increase | Increase | Mixed | Mixed | Increase |
| Corruption of village elites | Decrease | Decrease | Decrease | Decrease | Decrease | Decrease |
| Farmers’ access to timber revenues | Increase | Increase | Increase | Increase | Increase | Increase |
| Equitability of benefit-sharing between community members | Increase | Increase | Increase | Decrease | Decrease | Increase |
| Long-run economic efficiency | Decrease | Increase | Decrease | Decrease | Decrease | Decrease |