
Introduction
Global agricultural supply chains are a telecoupled system where demand in one location displaces environmental impacts, such as biodiversity loss at distal locations (Liu et al., 2015). This spatial, social, and institutional distance creates governance mismatches, along with “rivalry and non-excludability” for biodiversity in production sites forms a classic common-pool resource problem (Coenen et al., 2023; Gardner et al., 1990; Navarro-Gambín et al., 2025; Ostrom, 2008). The common-pool conflict is aggravated by the increase in both supply and demand for sustainable products over the last decades (FiBL, 2020; Helga, 2025) This upward trend has been influenced partly by consumers’ consciousness of their choices, also known as pro-environmental or biodiversity-first, or sustainable consumption (Kossmann and Gomez-Suarez, 2019; Ricci et al., 2018). Pro-environmental consumption is also driven by the instrumental, relational, and intrinsic values put forward (Pascual et al., 2023) and consumers’ awareness of the choices made by their social circles (Perry et al., 2021). However, the interplay between individuals’ psychological choices and the cascading impact of their social influence and vice versa is not sufficiently studied within current literature (Croson and Treich, 2014; Schulze et al., 2024).Commons literature focuses on collective and institutional adaptations (Gebara, 2019; Ghorbani and Bravo, 2016) and goes as far as social capital (Henry and Dietz, 2011). Thus, there is a need to integrate behavioural theories with demand studies to gain a deeper understanding of the governance mechanism for telecoupled agricultural commons.
Behavioural studies depart from traditional economics, which assumes a perfectly rational actor, recognising that cognitive biases, social influences, and personal attitudes also play significant roles in shaping sustainable choices (Kwon and Silva, 2020; Reina Paz and Rodríguez Vargas, 2023). Parsimonious theories such as the Theory of Reasoned Action (TRA) offer robust frameworks for studying complex intertwined psychological and social factors influencing consumer behaviour (Randall et al., 2023). TRA posits that individual attitude and subjective norms influence behaviour (Ajzen et al., 1980). Since biodiversity conservation and management are inherently a collective challenge, and their success largely relies on both regulatory measures and management goals but also social acceptance and coordination (Timilsina et al., 2017). Given the emphasis on social influences on individual decisions, commons governance research requires incorporating a new type of data that accounts for the social dimension.
Traditionally, consumer behaviour and perception over sustainably produced or labelled products are studied using surveys, social experiments, economic proxy indicators, or retail data (Andorfer and Liebe, 2012; Bangsa and Schlegelmilch, 2020; Kossmann and Gomez-Suarez, 2019; Rana and Paul, 2017; Samoggia et al., 2020). While surveys and experiments include information on the perception over sustainability issues or sustainably labelled products, they are time-consuming, costly, or limited to smaller spatiotemporal scales (Pilař et al., 2018). Spatially extensive surveys like the German National Consumption Study took two years to collect data from about 20,000 participants across Germany (Heuer et al., 2015), but all participants were only asked to list their food consumption within the last day, and each wave of the study is 20 years apart; thus generating high temporal granularity (Padilla Bravo et al., 2013). On the other hand, retail data often lacks insights into psychological motivations and the social aspects of decision-making (Bangsa and Schlegelmilch, 2020; Kossmann and Gomez-Suarez, 2019).
The big data wave of the last decade gives access to an overflow of information, of which social media has been used in tandem with extensive surveys as a proxy for consumption data on larger scales (Wang and Ye, 2018). Among social media networks, current research on food consumption uses X, formerly known as Twitter (X, 2023), focuses primarily on topic detection (Moreno-Sandoval et al., 2018; Samoggia et al., 2020; Vidal et al., 2015) or correlations with theme-specific indicators such as health or more direct process related to food (Abbar et al., 2015; Huang et al., 2019). Examples of topic detection are “where, by whom, and when” food tweets are made (Moreno-Sandoval et al., 2018), or more detailed information such as “food purchase, food preparation, food consumption, the context of food actions, associations with foods/consequences of consumption” (Vidal et al., 2015) or the utilitarian and hedonic impact of food (Samoggia et al., 2020). There is a gap in research focusing on capitalising the network component of social media data to understand the social influence of such behaviour, and subsequently to understand the emergent social norms that governs this telecoupled system (Henry and Dietz, 2011; Scalco et al., 2017).
This research aims to propose a novel methodological framework, using coffee demand in Germany, as an example of demand for a common-pool resource affected by both individual attitudes and social norms. Our research question is:
to what extent do digital social networks shape the social norms and individual attitudes that influence sustainable demand?
Our corresponding research objectives are three-fold:
to develop a methodological framework that integrates a behavioural perspective with large-scale social data to measure the mechanisms of commons governance;
to identify the social factors influencing pro-biodiversity behaviour, specifically testing the relative power of individual attitudes versus digitally mediated social norms; and
to integrate intrapersonal level dynamics with interpersonal level social norms to understand resulting transformations as a multi-level social change process (Soliev et al., 2025) .
A conceptual framework for sustainable demand
Our choice of the parsimonious Theory of Reasoned Action (TRA) is both theoretically and empirically driven. The interest of our research lies in the digital social network as a governance tool for physical commons (Henry and Dietz, 2011; Mathias et al., 2017). By keeping two core psychological mechanisms, attitude and social norms as in TRA, we can focus on the “governance mismatch” of our telecoupled system.
To set up the conceptual framework for identifying factors influencing pro-environmental or sustainable consumption, we reviewed relevant literature on pro-environmental consumers’ behaviour. This approach ensures that our conceptual framework is not only theoretically robust but also empirically grounded in the literature, with factors that most influence sustainable consumption.
We searched for literature on ScienceDirect and Scopus between 2009 and 2025, using the keywords (“sustainable food” OR “organic food”) AND (consumption OR demand OR behaviour OR choice). From 959 results limited by subject areas and keywords, we selected 186 articles based on titles, and after the abstract screening, we found 10 review papers and 9 relevant analytical articles. We retained factors that were frequently mentioned in Table 1.
Table 1
Selected reviewed literature.
| FUNCTIONAL | SENSORY | COST | ORIGIN | LABEL | LOCATION | SOCIOECONOMIC | SUSTAINABILITY AWARENESS | HEALTH | HABIT | SENTIMENT | SOCIAL NORMS | |
|---|---|---|---|---|---|---|---|---|---|---|---|---|
| (Andorfer and Liebe 2012) | V | V | V | V | ||||||||
| (Bangsa and Schlegelmilch 2020) | V | V | V | V | V | V | V | V | V | |||
| (Cornish et al. 2019) | V | V | V | V | V | V | V | |||||
| (Kossmann and Gomez-Suarez 2019) | V | V | V | V | V | V | V | V | ||||
| (Kushwah et al. 2019) | V | V | V | V | V | V | V | V | V | |||
| (Massey, O’Cass, and Otahal 2018) | V | V | V | V | V | V | V | V | ||||
| (Pristl, Kilian, and Mann 2021) | V | V | ||||||||||
| (Rana and Paul 2017) | V | V | V | V | V | |||||||
| (Samoggia and Riedel 2018) | V | V | V | V | V | V | ||||||
| (White, Habib, and Hardisty 2019) | V | V | V | V | ||||||||
| Total 10 Review papers | 7 | 7 | 7 | 5 | 4 | 2 | 5 | 7 | 2 | 6 | 3 | 7 |
| (Antonschmidt and Heo 2025) | V | V | V | V | V | V | V | V | ||||
| (Bartoloni, Ietto, and Pascucci 2022) | V | V | V | V | V | V | V | V | ||||
| (De Canio and Martinelli 2021) | V | V | V | V | V | V | ||||||
| (Czarniecka-Skubina et al. 2021) | V | V | V | V | V | V | V | V | V | V | ||
| (Peattie 2010) | V | V | V | V | V | V | ||||||
| (Scalco et al. 2017) | V | V | V | |||||||||
| (Trudel 2019) | . | . | . | V | . | V | ||||||
| (Vos et al. 2022) | V | V | V | V | V | V | V | V | V | V | V | |
| (Robichaud and Yu 2022) | V | V | V | V | V | V | ||||||
| Total 9 Analytical papers | 5 | 4 | 4 | 5 | 6 | 3 | 7 | 8 | 5 | 5 | 1 | 7 |
Based on the literature, the factors driving demand were grouped into 3 groups: product’s attributes, consumer attributes, and social norms (Figure 1). Product attributes contain functional, sensory, cost, origin, and taste of coffee. Functional characteristics for coffee are the stimulation effect of coffee (Aertsens et al., 2009; Bangsa and Schlegelmilch, 2020), the sensory effect of coffee is related to the atmosphere of “bliss and calm” that drinking coffee brings (Cornish et al., 2019; Hughner et al., 2007), the costs refer to the mention of payment or price of coffee (Andorfer and Liebe, 2012; Kossmann and Gomez-Suarez, 2019), the origin is countries that are mentioned with coffee (Massey et al., 2018; Samoggia and Riedel, 2018) and taste are vocabularies from the World Coffee Research Sensory Lexicon (Kushwah et al., 2019; Samoggia and Riedel, 2018). Consumer attributes refer to consumers’ socioeconomic class (Massey et al., 2018; Rana and Paul, 2017; Samoggia and Riedel, 2018), coffee consumption habits (Andorfer and Liebe, 2012; Bangsa and Schlegelmilch, 2020), health attitude (Massey et al., 2018; Samoggia et al., 2020) and sustainability attitude (Peattie, 2010; Rana and Paul, 2017; Trudel, 2019).
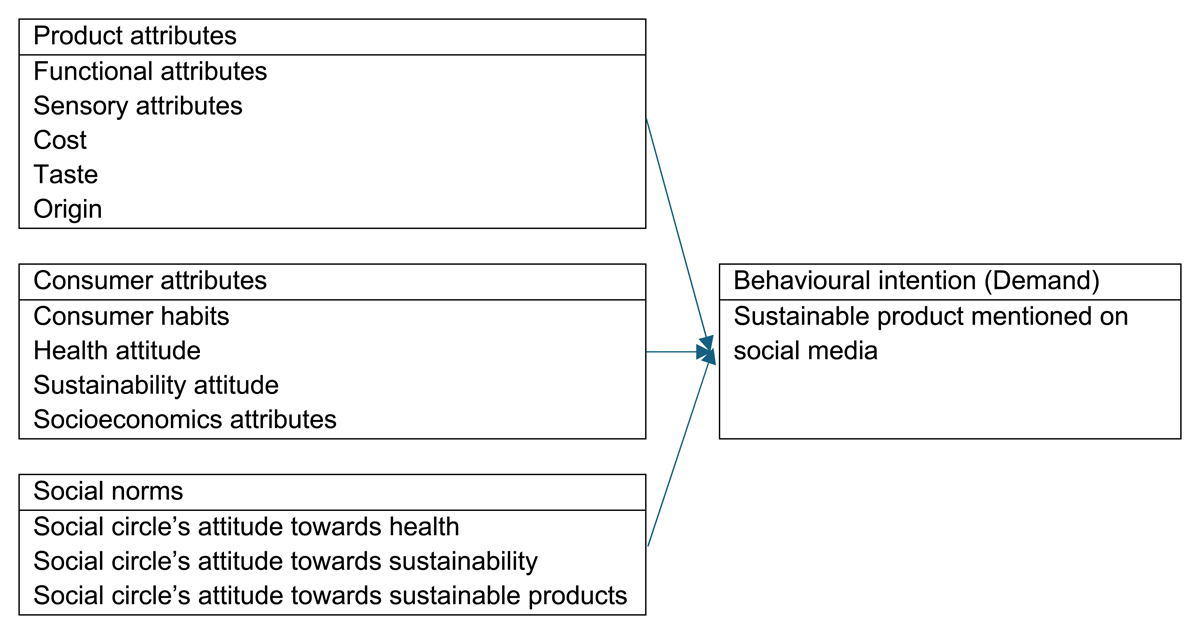
Figure 1
Sustainable Coffee Consumption Conceptual Framework.
Social norms refer to the health attitude of the social circle, sustainability attitude of the social circle, and sustainable product attitude of the social circle (Scalco et al., 2017; White et al., 2019). This deviates slightly from the original “subjective norms” in the TRA because instead of measuring subjective norms solely as the individual’s perception of social pressure, we calculate it quantitatively as the average attitude toward the behaviour held by all surrounding friends. This also explains the distinction between individuals’ attitudes and the attitudes of society contained within “social norms”. The resulting conceptual framework is similar to the TRA in which behavioural intention is influenced by consumer attitude and social norms (Ajzen et al., 1980).
The list of complete search terms for each attribute can be found in the Appendix.
Based on this integrated framework, we test the following three hypotheses:
Hypothesis 1 (H1): Consumers’ sustainability awareness (attitude) is a significant, positive predictor of their demand for sustainable coffee.
Hypothesis 2 (H2): The sustainable coffee attitude of the digital “social circle” (social norm) is a significant, positive predictor of consumers’ demand for sustainable coffee.
Hypothesis 3 (H3): The social norm mediated by the digital “social circle” (H2) is a stronger predictor of sustainable demand than customers’ sustainability awareness (H1), demonstrating its primary role as a governance mechanism.
Methodology
We conducted a national level analysis of stated coffee consumption, with a distinction between sustainable or organic labelled coffee versus conventional coffee. In this paper, the terms “pro-environment” or “sustainable driven” or “biodiversity-first” are used interchangeably since they reflect “motivations oriented toward the well-being of others” (Perry et al., 2021; Turaga et al., 2010).
Research design and case study
For the pro-environmental consumption of sustainable products, we selected coffee, a ubiquitous agri-food product that is increasingly traded with implications for the social-environmental and particularly biodiversity common-pool resource systems (Quiñones-Ruiz et al., 2015; Wynter et al., 2025). Coffee is also the first certified Fairtrade product, making sustainable coffee a widely recognised consumer choice (Fairtrade International, 2021), with many benefits, both hedonistic and utilitarian (Samoggia et al., 2020; Samoggia and Riedel, 2018). Since the early 2000s, consumption of coffee has emphasised quality, with a focus on the origin and sustainability of the beans, named the “third wave” (Bartoloni et al., 2022). Recently, with the rise of technologies, the consumption and production of specialty coffee are gaining visibility online (Torga and Spers, 2020), we name this the “fourth wave” of coffee. The bridge between demand online and digital social norms makes sustainable coffee research using social media very relevant.
Coffee is cultivated in tropical regions and exported all over the world (Nguyen and Drakou, 2021) with sustainable farming applied to most specialty coffee (Hunt et al., 2020). We chose Germany for its position in the agricultural value chain: it is among the largest importers globally and the largest exporter of locally roasted coffee (United Nations, 2018). This is a telecoupling example of how coffee production in the southern countries incurs the cost of biodiversity loss from coffee consumption in Germany, similar to the textile industry (Navarro-Gambín et al., 2025). Furthermore, German caffeine consumption (coffee, among others) is the highest among European countries, with an increasing rate (Schienkiewitz et al., 2020). Another reason why Germany was selected is because of the accessibility of social media data, where it is in the top 10 countries with the most users (DataReportal, 2025).
Data were acquired through social media, spanning a long period, with substantial users’ information (Sloan and Quan-Haase, 2017). We have limited the collection period to before Covid in 2019 to ensure that there is no sudden and significant change in mobility and consumption (Brzustewicz and Singh, 2021).
As a data source, we selected X, a microblogging site that allows users to post and interact with other users publicly. Even though X users might not be representative of the population (Janetzko, 2017), the freely available content embedded in its social context makes it ideal for consumer research (Sloan and Quan-Haase, 2017). Furthermore, “digital footprints” such as users’ metadata, pictures, text content, linguistic styles, social networks, etc., can be used to predict additional users’ demographic characteristics, socioeconomic class, and personality traits as individual factors driving consumption trends (Ghazouani et al., 2019; Hinds and Joinson, 2018).
We followed a step-wise approach (Figure 2), aligning with our first three research objectives:
we created a conceptual framework to identify factors influencing pro-environmental consumption;
we collected the relevant data and associated variables;
we analysed the data to understand the trends and factors influencing sustainable coffee consumption.
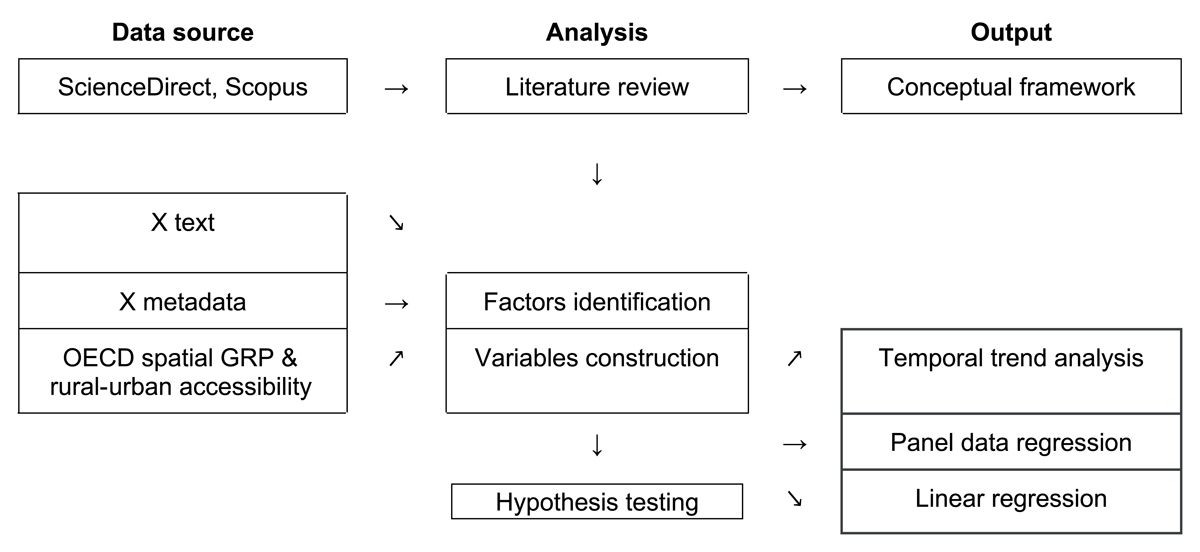
Figure 2
Workflow to build a methodological framework for sustainable product consumption. The data came from three primary sources (scientific articles, X, and OECD spatial regional data), leading to three main types of analysis: literature review, factor identification, and analysis of influence.
Data collection
X Data scraping
To collect data over a 3-year period on German users’ awareness of sustainable coffee that reflects awareness of product attributes, users’ attributes, and their attitudes to social circle, we followed a snowball two-stage sampling method similar to the procedure by (Hino and Fahey, 2019). We chose the starting year of 2017 due to the increase in X word limit, allowing for more meaningful content, and the ending year of 2019, before the COVID-19 pandemic significantly changed consumption and mobility behaviours (Brzustewicz and Singh, 2021). This two-stage method allows a high representation of data under resource constraints (Hino and Fahey, 2019). We ended the search in 2019 when the data was collected in 2020 to capture tweets from all 12 months of the year and avoid seasonal bias.
Stage 1 (Primary):
Seed Sample: Collected tweets with “coffee” or “kaffee” + German geolocation.
Primary Users: Filtered tweet authors to identify users with German locations (Google Geolocation API, 2021), ensuring they were residents, not tourists.
Primary Corpus: Collected ~1,500 historical tweets* per primary user (2017–2019).
Stage 2 (Secondary – Social Circle):
Secondary Users: Extracted @mentioned users from the Primary Corpus. Justify this: @mentions represent active social ties, a better proxy for social norms than static follower lists (Abbar et al., 2015).Secondary Corpus: Collected ~1,500 historical tweets* from these secondary users.
*We chose to gather 1,500 historical tweets instead of the maximum of 3,200 tweets (Kearney, 2019) because a median X user tweets 1–2 times per month (Wojcik and Hughes, 2019), 1,500 tweets would span more than three years from 2017 to 2019. The lesser data also reduces the data collection time due to the X rate limit – how much data can be gathered within a given time (Kearney, 2019).
Socio-economic and spatial data
We collected demographic (gender, age) and socioeconomic status data mentioned in the literature (income, urban accessibility) (Massey et al., 2018; Rana and Paul, 2017; Samoggia and Riedel, 2018).
X profile pictures and profile descriptions were used to infer gender, age, and organisation identity using a machine learning algorithm based on the work of Wang et al. (2019). We collected Gross Regional Product per capita (OECD, 2018) data as a proxy for regional income and urban-rural typology (OECD, 2020) as a proxy for product accessibility.
Variable construction and content analysis
To identify different factors influencing sustainable coffee consumption, we create keywords for each factor using Latent Dirichlet Allocation (LDA) topic modelling on a separate database (Grün and Hornik, 2011). LDA assumes documents (in this case, tweets) are written with “latent” topics, and words (unigrams) are classified into these topics based on “Dirichlet” distribution. For example, to understand the topics associated with coffee and pleasure, we scraped X for the keyword “coffee pleasure” and analysed 5,000 tweets to yield keywords of the most relevant topics, similar to the method illustrated by Liu (2020) and Tuarob and Tucker (2014).
Using the list of keywords for each topic, we tagged the content of the primary and secondary corpus using pattern recognition (Tuarob and Tucker, 2014); this means assigning the value 1 to each tweet if it contains coffee attributes (functional, sensory, cost, origin and sustainable coffee), user attitude (sustainability, health, and habit) and 0 for tweets that do not contain these topics. We repeated the process of content tagging on the secondary corpus. This gave us the attitude of the social network related to sustainability, health, and sustainable coffee topics.
The tagged tweets are then averaged per user per day to get the frequency of mentioning each topic as a proxy of topic awareness (for the independent variables) and stated sustainable coffee demand (for the dependent variable).
A detailed example of the process is given in the Appendix: Figure A1, Figure A2, Figure A3, Table A1, and Table A2.
Dependent variable construction
The dependent variable of the linear regression is the percentage of tweets per user that mention sustainable coffee. The dependent variable of the panel regression is the percentage of tweets per user per week that mention sustainable coffee.
Independent variables construction
H1 variable is the consumer’s Attitude or user’s sustainable awareness. This is constructed by the percentage of tweets per user on sustainability topics.
H2 variable is the social norms, or the average percentage of tweets among user’s social circle on sustainability topics.
To classify user data with profile-specific probability by sociodemographic characteristics, we used the M3 model (Wang et al., 2019) named after its multimodal, multilingual, and multi-attribute abilities for inferring gender, age, and organisation identity from user profile pictures, descriptions, and names.
The four age classes were under 18, between 19 and 29, between 30 and 39, and over 40. For our fixed-effect regression, we generated an age estimate for 2020 using the estimated probability per corresponding age group.
GRP per capita and urban-rural typology data were matched to each user’s location stated on their profile.
Hypothesis testing
We empirically tested the proposed conceptual framework with regression analysis using X exchanges and data inferred from additional sources (3.2). Our core assumption was that mentioning a topic in a tweet (sustainable coffee, coffee attributes, health, sustainability, etc) reflects topic awareness (Moreno-Sandoval et al., 2018; Samoggia et al., 2020; Vidal et al., 2015). Analysing this data allowed us to understand each factor’s relative contribution to sustainable coffee consumption, a proxy of sustainable coffee demand.
To analyse the temporal trends of consumption, we first created panel data reflecting the frequency of tweets by user by day for each topic. The panel data allows us to observe the behaviour change of the same primary users over a 3-year period. We then ran panel regressions of different models, including different variables, to test our hypotheses.
To include demographic variables, which are time-invariant, we ran linear regressions using different models to test our hypotheses. The specificities of these models are in the Appendix.
Results
Descriptive findings: sample characteristics and temporal trends
Within the original 9,000 tweets about “coffee” and another 9,000 tweets about “kaffee,” we identified 7,160 unique users in Germany. The collection of historical tweets (a maximum of 1,500 tweets for each primary user) resulted in a corpus of approximately 9,503,000 tweets ranging from 2007-04-30 to 2020-04-04. Limiting the corpus to Tweets written in English or German and between 2017 and 2019 narrowed it to 1,910,000 tweets (20%). Among the primary corpus, 23% tweets are in English.
The 7,160 users mentioned 364,000 secondary users in their tweets, creating a network with 647,000 connections. The collection of historical tweets (maximum 1,500 tweets for each secondary user) resulted in a secondary corpus of 80,112,000 tweets, of which 60,104,000 tweets (75%) were published between 2017 and 2019 in English or German. Of these secondary tweets, 58% were in English.
Of the primary users, metadata for 84% users was collected, location data for 78% users, and profile pictures to infer demographic details for 80% users. Figure 3 shows the distribution of demographic attributes in our sample compared to the national average.
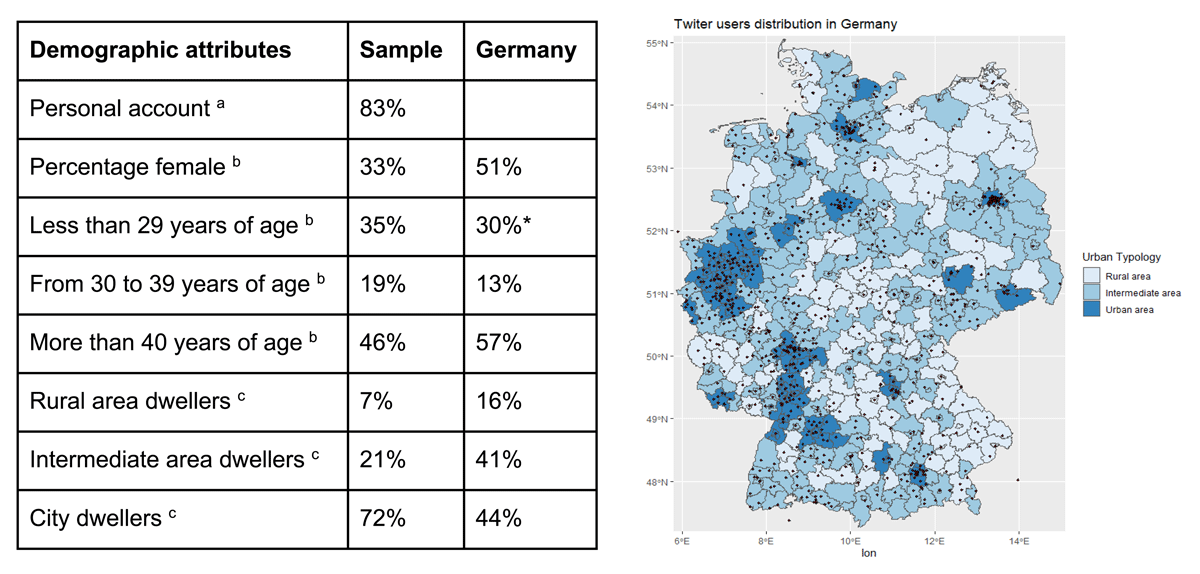
Figure 3
Demographic attributes from X account data based on metadata and profile photos vs the national average (left) abd German urban-rural typology (OECD, 2020) overlaid by X user distribution: The darker shade denotes a higher population density area (right).
a based on 5,756 accounts whose pictures and metadata are available for analysis (80% of primary users).
b based on 4,750 personal accounts (66% of primary users).
c based on 3,528 personal accounts with location data available for analysis (50% of primary users).
* we aggregated the first two groups into “less than 29 years of age” in both our sample and the national average.
The demographic attributes of X users showed that our sample is predominantly male, 67% versus 49% male in the German population. The sample also featured a younger population, with 54% of users under 40, compared to 43% in Germany. In addition, most of our sample resides within the city, at 72%, compared to 44% for urbanites based on national data. This population of young city dwellers describes the consumers of the fourth wave of coffee, where social information is key, making the sampling representative for our research.
Over the three years, we observed an upward trend in the frequency of sustainable coffee tweets among all coffee tweets 4 ± 1% of tweets were about sustainable coffee in 2017 compared to 5 ± 1% in 2019, or a 10% annual increase. The same trend is observed in the social circle of primary users; even though secondary users tweet less frequently about sustainable coffee than primary coffee consumers do, 2.5 ± 1% of tweets were about sustainable coffee in 2017 compared to 4.5 ± 1% in 2019, corresponding to a 15% annual increase.
Figure 4 shows that mentions of product attributes (sensory, functional, origin, taste, and cost) reduce over time, while user habits reduce, users’ health and users’ sustainable awareness increase. The same increasing trend is observed in the social circles of users, having an increase in mentions in health, sustainability, and sustainable coffee. This shows an overall shift in online coffee discourse away from individual, hedonic experiences (taste, sensory, functional etc.) and toward social, normative concerns (sustainability).
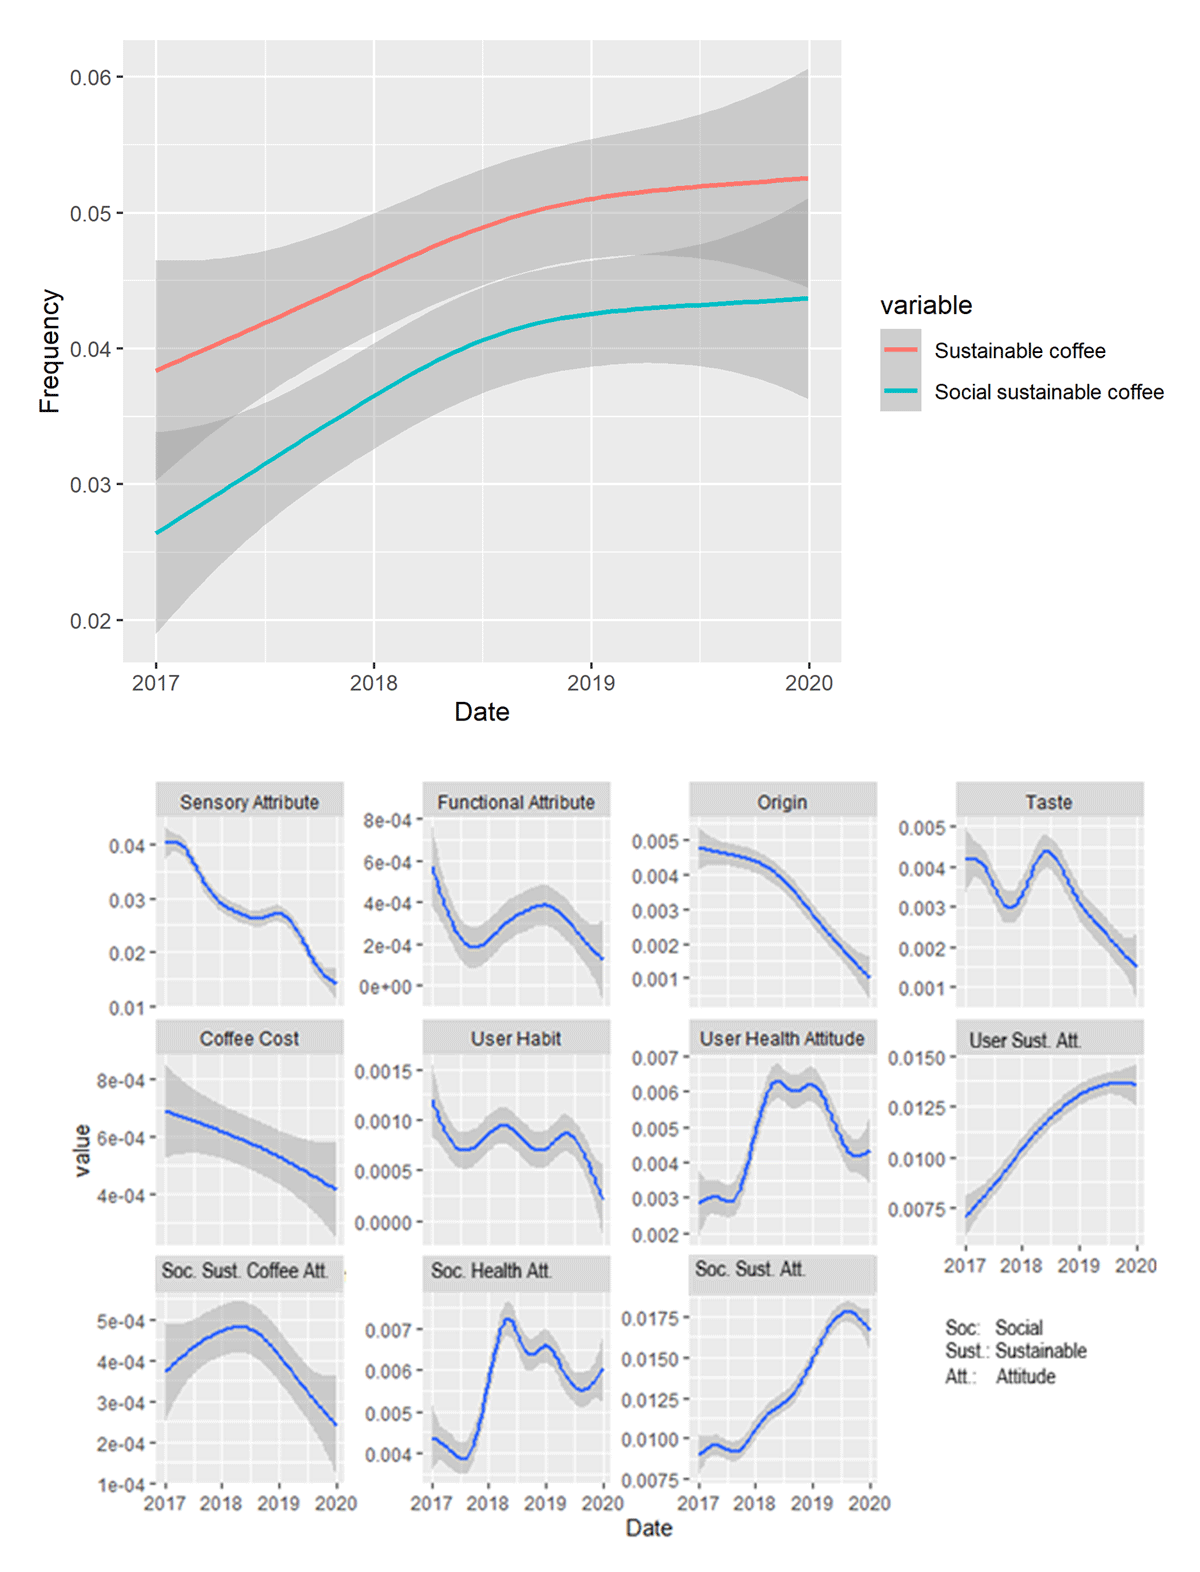
Figure 4
Observed temporal trends of independent variables (upper) and dependent variables (lower) over frequency of tweets. The grey margin shows the minimum and maximum values in the dataset.
Main Findings: Testing the factors influencing sustainable demand
To test the hypotheses regarding the factors influencing this sustainable demand, both fixed-effect panel and linear regression models were employed. The panel model analyses behavioural change over time, while the linear model incorporates time-invariant demographic controls.
H1 and H2 validation: Attitude and Social Norms as significant predictors
Two fixed-effect regressions analysed which factors correlates with the increase in sustainable coffee tweets. Our panel dataset is unbalanced because X accounts are created at various times, and accounts active in 2019 could have been created after 2017.
The first fixed-effect regression found no stationarity issue. We employed the Hausman endogeneity test issue (Liu, 2020) to select between the fixed and random-effect models. This test showed a p-value of less than 0.05, rejecting the null hypothesis that the fixed-effect model was preferable to a random-effect model.
The fixed-effect regression results are demonstrated in Figure 5 among all variables; only sensory attributes, origin, taste, sustainability awareness, social sustainability awareness, and social sustainability coffee attitude are significantly positive predictors for users’ mention of sustainable coffee. While the product attributes’ influence on sustainable coffee consumption might be explained by the way that the variables were constructed, the social impact on sustainable coffee tweet frequency might be explained by the fact that sustainable tweets, in general, and sustainable coffee tweets, in particular, are parts of exchanges, of awareness-raising tweets involving their friends. In contrast, when customers tweet about their experiences (involving coffee attributes or hedonic characteristics), they share information without needing replies or responses from their friends.
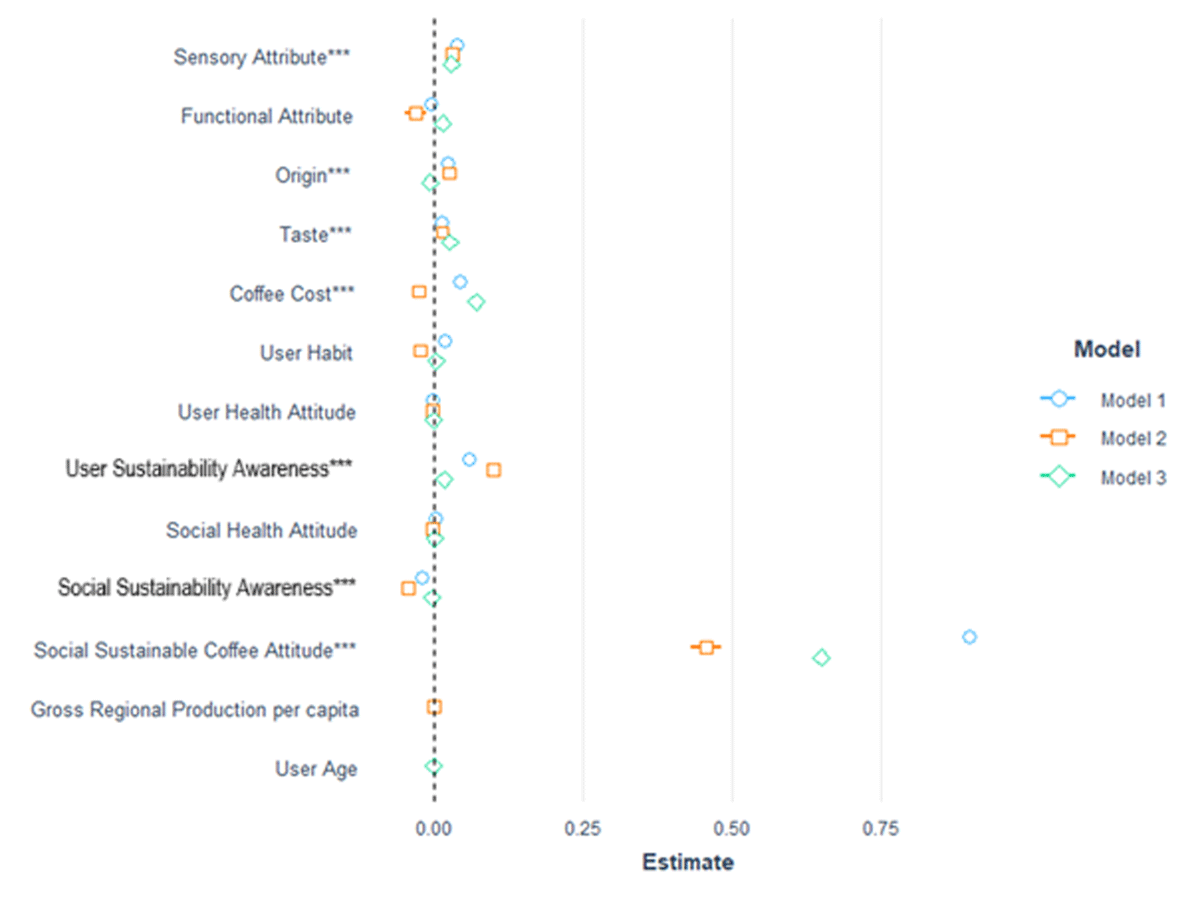
Figure 5
Fixed effect regression standardised result. Model 1 includes all variables except age and income; model 2 consists of all variables except users’ age, and model 3 includes all variables except users’ income (proxy by gross regional production per capita). From the result, we see that socially sustainable coffee attitude has the highest significant correlation to sustainable coffee mention, followed by coffee sensory attributes, user’s sustainability awareness, coffee origin, coffee taste, and coffee cost in respective order.
All continuous predictors are mean-centred and scaled by one standard deviation.
*** p < 0.001; ** p < 0.01; * p < 0.05.
The coefficients for most variables, except for two, are significant and close to 0. The size of the coefficient is partly due to the way the explanatory variables and response variable are constructed and the p-value is significant due to large sample size (Sullivan and Feinn, 2012). In the first model, the explanatory variables come exclusively from the X sample using the same calculation, using the percentage of tweets mentioning certain keywords, the infrequent use of these keywords can result in their coefficients being 0. Whereas Model 2 and 3, the spatially explicit proxy variable of purchasing power and machine learning inferred variable age are calculated differently, leading to their coefficients being close to 0. The one variable that is largely different from 0 is the social circle’s attitude toward sustainable coffee; this means that the more the social circle mentions sustainable coffee, the more the users themselves tweet about sustainable coffee. Similarly, the more the users mention other pro-environment facts, the more likely they are to talk about sustainable coffee. The same relationship is found when the users mention the taste or the origin of their coffee, they will most likely mention the sustainability aspect of their coffee as well. At the same time, the effect is reduced with additional variables in model 2 (including proxy by GRP per capita) and model 3 (including age—probabilistic calculation based on X metadata).
The result of the linear regression reveals that only origin, cost, user sustainability awareness, social sustainability awareness, and social sustainable coffee attitude significantly influence the mention of sustainable coffee. However, the mention of coffee origin negatively influences the mention of sustainable coffee, whereas this was positive for the fixed-effect regression.
The results are similar to the panel regression, the standardised coefficients of most variables (Figure 6) are close to 0 even though most are significant, except for the social sustainable coffee attitude. The two variables that are largely different from 0 is the social circle’s attitude toward sustainable coffee and sustainability awareness. Despite the additional variables (age group, accessibility and organisational status), the importance of the social sustainable coffee attitude does not change.
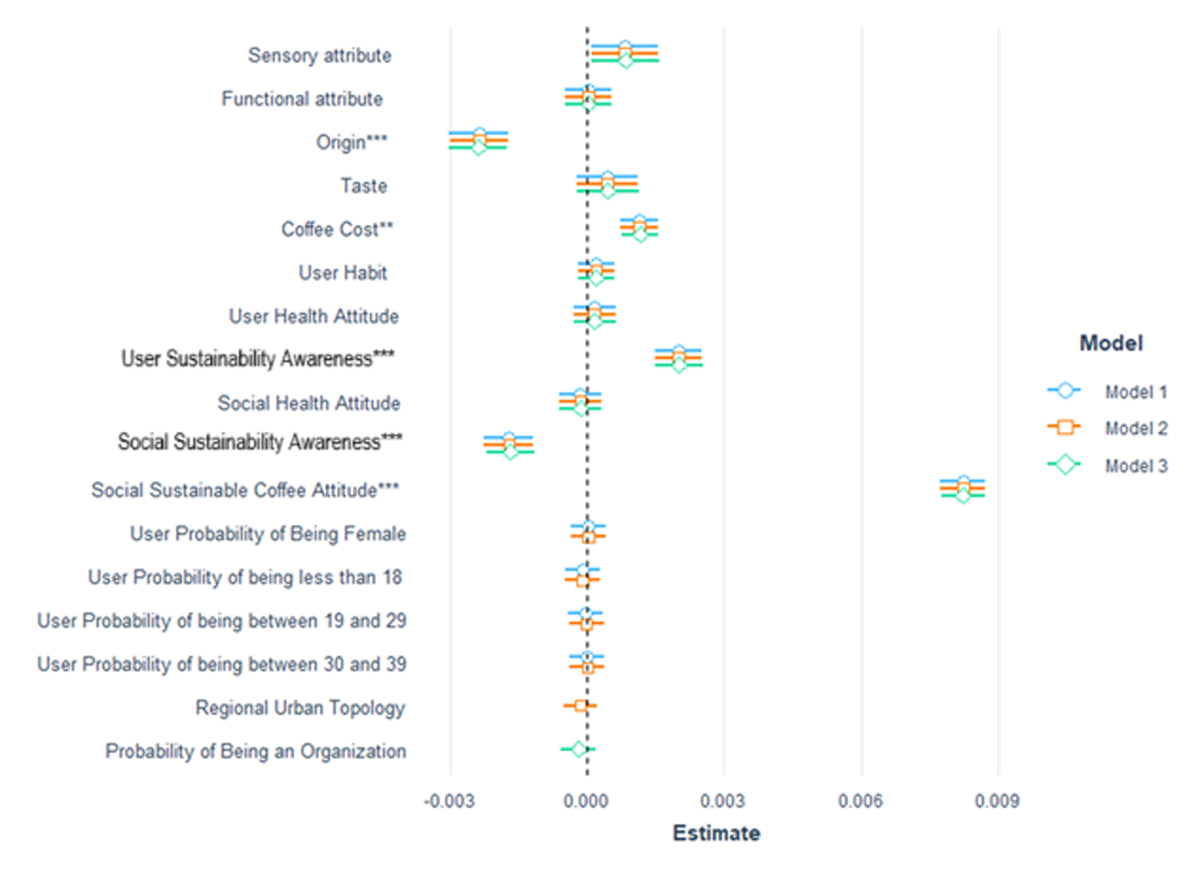
Figure 6
Linear regression model standardised result. Model 1 includes all variables except users’ accessibility (proxy by a regional urban-rural topology) and organisational status; model 2 consists of all variables except users’ organisational status, and model 3 includes all variables except users’ accessibility. The result shows that socially sustainable coffee attitude has the highest significantly positive correlation to sustainable coffee mentions, followed by user’s sustainability awareness, coffee sensory attributes, and coffee cost. In contrast, coffee origin and social sustainability awareness correlate significantly negatively with sustainable coffee mentions.
All continuous predictors are mean-centred and scaled by one standard deviation.
*** p < 0.001; ** p < 0.01; * p < 0.05.
H3 validation: digital social norms as a governance mechanism
The panel and linear regressions provide robust proof for our three research hypotheses: consumers’ sustainability awareness (H1) and social sustainability coffee attitude (H2) are both positive and significant predictors of sustainable coffee consumption, as we take tweets as a proxy of consumption. Importantly, the social norm towards sustainable coffee is a stronger predictor of sustainable coffee consumption (H3) than consumers’ sustainability awareness. These findings directly answer our research question, demonstrating that digital social norms function as an emergent system of governance, both shaping and reflecting the factors influencing sustainable demand.
Discussion
This study addresses three interconnected research objectives to advance the understanding of governance of the commons, particularly those concerning demand for sustainable commons. First, we developed a methodological framework that integrates a behavioural perspective through the lens of the theory of reasoned action (TRA) with consumers’ demand and validated it using big social data. Second, we compared the relative power of individual attitudes versus digitally mediated social norms. Third, we link intrapersonal level dynamics with interpersonal level social norms in facilitating transformation change and provide recommendations as outlined below.
A novel framework to analyse the mechanisms of commons governance
This study creates a novel framework that integrates a behavioural perspective through the lens of the theory of reasoned action (TRA) for analysing pro-environmental behaviours at scale using big social data analytics. The framework’s strength lies in its ability to capture the social and psychological dimensions of individuals’ choices, enabling the detection of behavioural patterns across scales in a resource-efficient manner. This approach offers significant methodological improvement and resource-saving compared to traditional survey techniques, especially in resource-constrained environments.
From a conceptual point of view, our framework addresses the weakness of traditional ecological economics of assuming individuals as rational actors (Trudel, 2019) since the behavioural framework incorporated social influence and its feedback in time. The added value of incorporating a behavioural framework (TRA) is supported by several studies (Kwon and Silva, 2020; Schulze et al., 2024). We also assessed individuals’ preferences and contributing factors behind their pro-environmental decisions and detected the most influential parameters that can be used to influence pro-environmental choices.
From a data point of view, this approach allowed the analysis to be extended across scales in multiple dimensions: the data covers an entire nation (Germany), spans three years with daily content and is embedded within its social context, which is lacking in all previous survey methods (Abbar et al., 2015; Huang et al., 2019; Moreno-Sandoval et al., 2018; Samoggia et al., 2020; Vidal et al., 2015). This is a research gap since social influence has proven to significantly influence consumption patterns, especially for products like coffee, whose consumption includes a social dimension (Samoggia et al., 2020; Samoggia and Riedel, 2018). Big data analysis is a significant methodological improvement and resource-saving compared to traditional survey techniques such as the German National Consumption Study (Padilla Bravo et al., 2013). Within two weeks of data collection (1/50 of the survey duration), we increased the data granularity by more than 4,000 times. Additionally, data can be obtained easily through social media in a resource-constrained environment, such as during the lockdown imposed due to the Coronavirus pandemic.
From an analytical point of view, the combination of linear regression and panel regression allowed to both analyse the change in behaviour and the importance of time-invariant demographic factors that influence consumption behaviour (Vujić and Zhang, 2018; Yin et al., 2022). Furthermore, the temporal analysis showed us the trend in consumption and sustainability. Previous research on social media text analysis largely correlated tweet content with national or regional health indicators to understand trends spatially and across sections (Abbar et al., 2015; Huang et al., 2019). While they were useful in illustrating the various information embedded within tweets, they stopped short at revealing temporal patterns. In addition to that, this research fulfilled the three dimensions of social media data, that is, “space, time, and content” (Wang and Ye, 2018), but lacked the fourth dimension, the “social dimension,” which is eponymous to these data platforms. Social dimension refers to the observed behaviour as part of a social context, that is, social media content analysed within its context, for example, how “social connectedness” influences behaviour. The comprehensive approach presented here captured this dimension between attitudes and social norms that is particularly relevant for the commons research focusing on the intersection of individuals and society.
Core factors influencing sustainable coffee consumption
Within the context of coffee’s fourth wave, our framework revealed that digital social networks function as novel governance mechanisms for telecoupled commons. Specifically, empirical evidence shows that social norms outweigh individual attitudes as a predictor of sustainable consumption.
We analysed three categories of factors influencing sustainable coffee demand: product attributes (coffee origin), user attributes (sustainability awareness), and social norms (sustainability awareness of the social circle and sustainable coffee awareness of the social circle) all influence sustainable product awareness. This finding is in line with the commons literature on the simultaneous importance of individual motivations, resources, and social learning or social norms (Sanil et al., 2024). That existing pro-environmental behaviour (e.g., posts on social media) is a relatively good predictor of sustainable food choices is well documented in the literature (Aertsens et al., 2009; Andorfer and Liebe, 2012; Hughner et al., 2007; Scalco et al., 2017; Trudel, 2019). Similarly, social norms are found to influence behaviour by many researchers (Kushwah et al., 2019; Peattie, 2010; Rana and Paul, 2017; White et al., 2019) while weakened social norms are known to be linked with individuals’ correspondingly weaker coordination abilities for social dilemmas of resource sustainability (Timilsina et al., 2017). In our case, tweets from the individuals’ social circle about sustainability and sustainable coffee positively correlated with their own posts of sustainable coffee choices. The selection bias in our data may explain the high coefficient of the variable “social sustainable coffee.” It signifies that consumers tweet about sustainable coffee in a “social” setting, engaging (via mention) others in their social circle as part of a discussion or awareness raising. In contrast, tweets about other products or customer attributes do not necessarily involve other consumers.
Recommendations for transformative change and conclusion
Using big data, we built and empirically tested a behavioural framework on pro-environmental behaviour. X data allowed us to capture all four dimensions of space, time, content, and social network. X is often criticised for not being representative of the population (Abbar et al., 2015; Huang et al., 2019; Vidal et al., 2015; Wang et al., 2019) since there is a selection bias of internet affluence and urban dwellers among users. However, this sample is the representative for the “fourth wave” of coffee that pushes technologically advanced processes and information, including consumption and production online (Torga and Spers, 2020). Given these new norms and new governance mechanisms, the focus of interventions to steer sustainability of consumer demand needs to shift from informational toward individual to collective normative dynamics. For example, group identity (Andorfer and Liebe, 2012) should be emphasised and messages should be rephrased toward collective action, such as “join” or “together” to reflect shared norms (Agrawal, 2003).
In addition, we analysed factors leading to pro-environmental behaviour based on the extended Theory of Reasoned Action. The results showed that consumers’ sustainability awareness and attitudes of consumers’ social circles correlated with sustainable coffee consumption. Furthermore, within the digitally-driven fourth wave coffee sphere, we found that the social factor was more significant than the individual factor. Based on our findings, we propose that to make bottom-up steps toward sustainable consumption, policy should target product-level interventions and community-level awareness. Campaigns should leverage social networks, a dimension often overlooked in policy solutions for sustainability transition (Ammann et al., 2023).
Coffee is an example of a telecoupled common-pool resource system where major consumer groups are located in the Global North while the major producers are largely in the Global South. Using the telecoupled common pool resource example of coffee trade from producers in the Global South to consumers in the Global North, we examined the spatial and psychological distance that resulted from direct and indirect drivers of impact (IPBES, 2024). Recent research on direct drivers (land use and management strategies) in cultivating coffee that determines their impact on biodiversity (Wynter et al., 2025) shows how the complexity of the resource system already in relation to the direct drivers, limits “our ability to make meaningful conclusions on its biodiversity conservation potential”. Our work that focuses on indirect drivers – the role of individual attitudes and social norms – complements such research, similarly highlighting the challenges of the complex resource system, but also revealing the nuances of the powerful social processes shaping our demand. Already by analysing the fraction of social media data (albeit big data on its own), it seems there is sufficient evidence that interaction of individual attitudes with social norms can substantially shape consumer demand. Larger studies with data from different platforms and across political-cultural contexts are urgently needed linking these indirect – intrapersonal and interpersonal levels – drivers with the direct drivers (such as land use and management strategies) and long-term biodiversity impact.
Additional File
The additional file for this article can be found as follows:
Data Accessibility Statement
Due to X confidentiality, original tweets are not available, but regression results derived from these data are available upon request.
Acknowledgements
We thank the editor, guest editor Ilkhom Soliev, and anonymous reviewers for their constructive and insightful comments, which substantially improved this appendix and the wider study.