
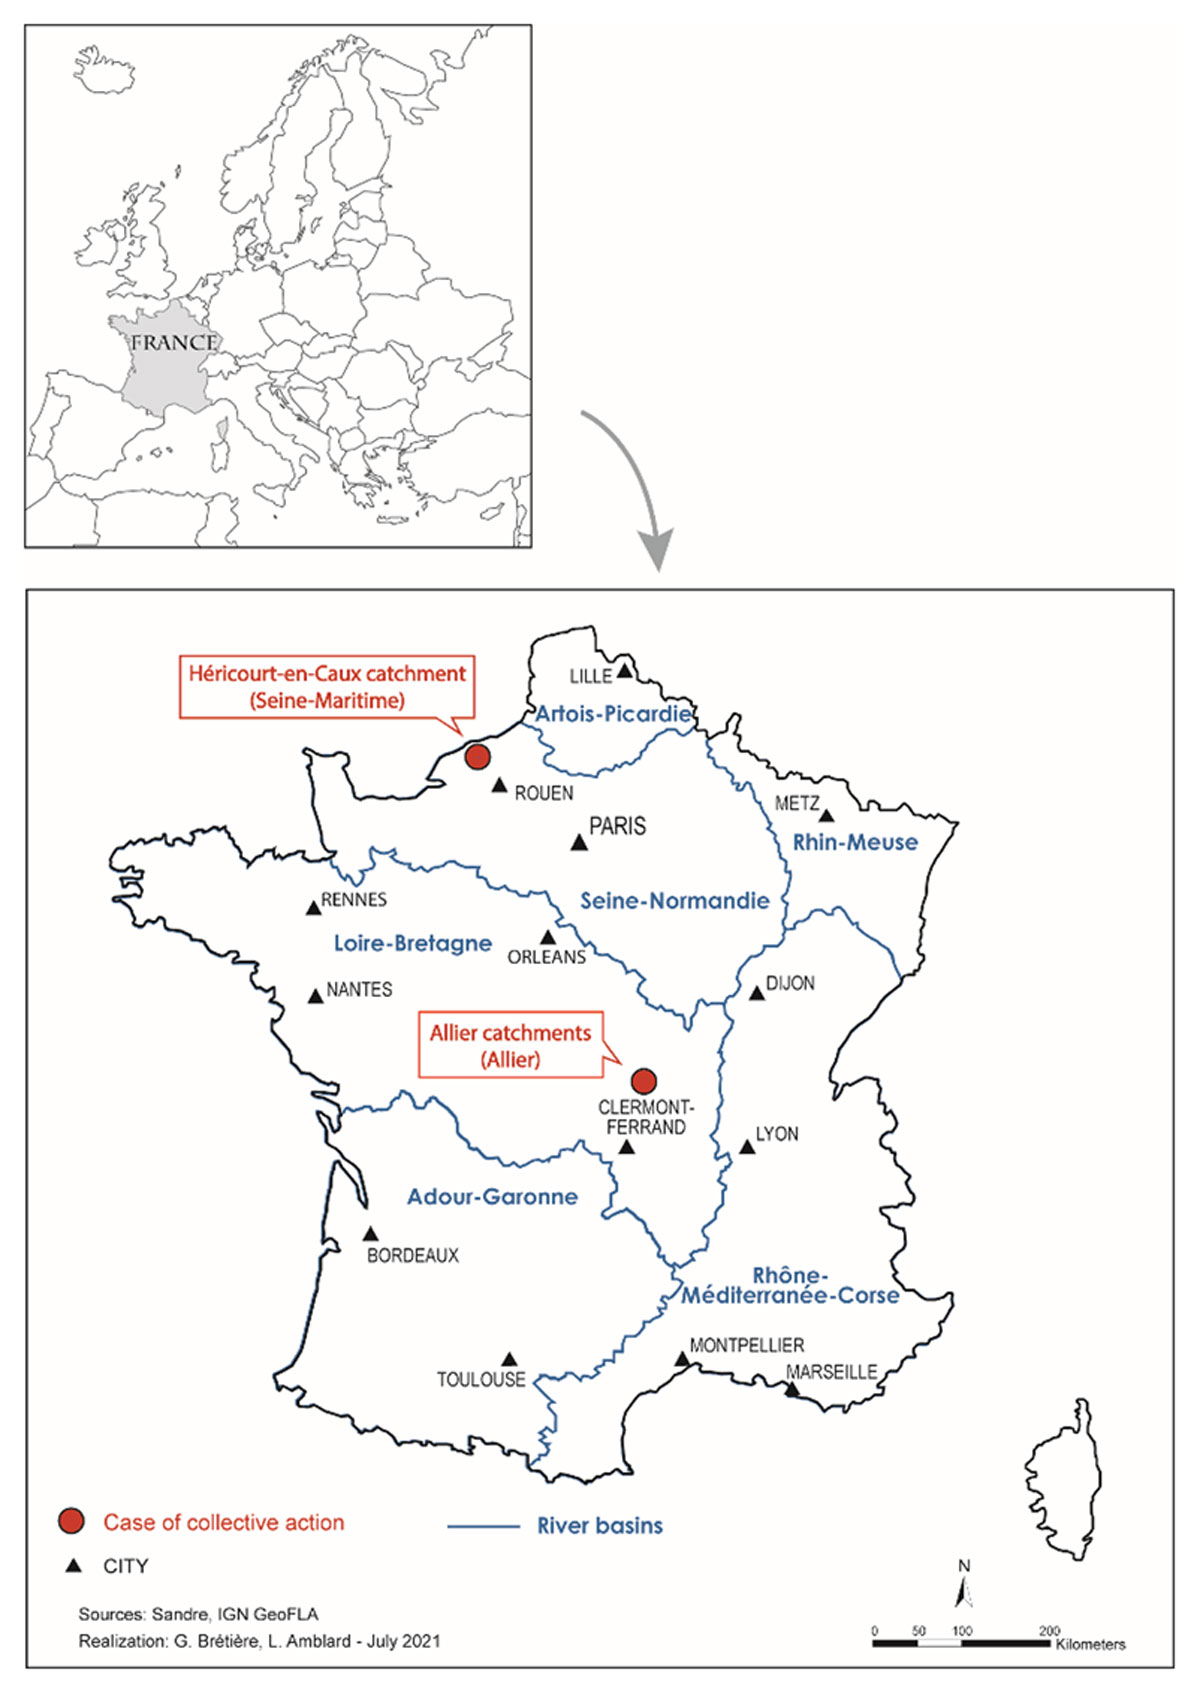
Map 1
Locations of the two cases of cooperative management of drinking water quality.
Table 1
Main characteristics of the two drinking water catchments.
| ALLIER | HÉRICOURT-EN-CAUX | |
|---|---|---|
| Water resource | ||
| Water management | Intermunicipal water utility (SMEA) | Intermunicipal water utility (SMEACC)* |
| Hydrogeological system | Alluvial aquifers (Allier and Loire rivers) | Karst aquifers |
| Population supplied by the resource | 39,900 | 20,000* |
| Share of the total drinking water supply | 51% | 61%* |
| Type of pollution | Nitrates/ Pesticides | Nitrates/ Pesticides* |
| Agriculture | ||
| Catchment area | 8,300 ha | 11,636 ha** |
| Agricultural area | 6,900 ha (83% of the catchment area) | 9,860 ha** (85% of the catchment area) |
| Number of farms | 120 | 260** |
| Types of farming systems | Mixed crop; mixed crop- livestock farming | Mixed crop-livestock farming** |
| Proportion of grassland (% of the agricultural area) | 24% | 27%** |
| Proportion of arable crops (% of the agricultural area) | Cereals: 63% Oleaginous: 9% Others: 4% | Cereals: 47%** Oleaginous: 11% Industrial crops: 15% |
[i] Sources: Allier: SMEA, 2013; Héricourt-en-Caux: * SMEACC, 2018 (a); ** CA de la Seine Maritime, 2012.
Table 2
Farmers’ participation in collaborative water quality management.
| ALL | ALLIER | HÉRICOURT-EN-CAUX | |
|---|---|---|---|
| Participation | 68 | 36 | 32 |
| 56.7% | 60.0% | 53.3% | |
| Participation/type of action | |||
| Information and/or training | 45 | 22 | 23 |
| 67.2% | 62.9% | 71.9% | |
| – Information | 44 | 22 | 22 |
| 65.7% | 62.9% | 68.7% | |
| – Training | 13 | - | 13 |
| 19.4% | - | 40.6% | |
| Technical support | 39 | 36 | 3 |
| 57.3% | 100% | 9.4% | |
| Analyses | 54 | 28 | 26 |
| 80.6% | 80% | 81.2% | |
| – Livestock manure analyses | 19 | 3 | 16 |
| 28.4% | 8.6% | 50% | |
| – Soil nitrogen residue analyses | 51 | 28 | 23 |
| 76.1% | 80% | 71.9% | |
| – Rapeseed plant analyses | 18 | 18 | - |
| 26.9% | 51.4% | - | |
| Contracts | 21 | 4 | 17 |
| 31.2% | 11.4% | 53.1% | |
| – EU AES | 8 | 4 | 4 |
| 11.9% | 11.4% | 12.5% | |
| – PES | 13 | - | 13 |
| 19.4% | - | 40.6% |
Table 3
Farmers’ level of participation in collaborative water quality management.
| ALL | ALLIER | HÉRICOURT-EN-CAUX | |
|---|---|---|---|
| Participation | 68 | 36 | 32 |
| 56.7% | 60.0% | 53.3% | |
| Participation/number of actions | |||
| One action | 14 | 7 | 7 |
| 20.9% | 20% | 21.9% | |
| Two actions | 9 | 3 | 6 |
| 13.4% | 8.6% | 18.7% | |
| Three actions | 13 | 6 | 7 |
| 19.4% | 17.1% | 21.9% | |
| Four actions | 23 | 16 | 7 |
| 34.3% | 45.7% | 21.9% | |
| Five actions | 7 | 3 | 4 |
| 10.4% | 8.6% | 12.5% | |
| Six actions | 1 | 0 | 1 |
| 1.5% | 0% | 3.1% |
Table 4
Explanatory variables.
| VARIABLE | DEFINITION | EXPECTED IMPACT ON PARTICIPATION |
|---|---|---|
| Farm size | Utilized agricultural area (UAA) (ha) | + |
| Eligible area | Proportion of the farm UAA in the catchment (%) | + |
| Arable farming | = 1 if the farm specialized in arable crops | – |
| Equipment | Number of machinery items adapted to agroecological practices | + |
| Labor | Available family workforce (AWUs) | + |
| Gross operating surplus | = 1 if gross operating surplus ≥ 50,000 € | + |
| Off-farm income | = 1 if off-farm income | + |
| Age | Age of the farmer | –/+ |
| College education | = 1 if the farmer has a college education | + |
| Previous participation | = 1 if the farmer has previous experience participating in AESs | + |
| Environmental concern | = 1 if the farmer often or always takes the environment into account in farming practices | + |
| Coop | = 1 if the farmer is a member of a cooperative | –/+ |
| Agricultural network diversity | Number of different types of agricultural organizations of which the farmer is a member | + |
| Nonagricultural network diversity | Number of different types of nonagricultural organizations of which the farmer is a member | + |
| Héricourt-en-Caux | = 1 if the farm is in the Héricourt-en-Caux catchment | –/+ |
Table 5
Determinants of participation in collaborative water management (probit model).
| VARIABLE | COEFFICIENTS | STD. ERROR | AVERAGE MARGINAL EFFECTSB |
|---|---|---|---|
| Constant | –6.033*** | 1.147 | |
| Farm size | 0.003* | 0.002 | 0.001* |
| Eligible area | 0.024*** | 0.005 | 0.005*** |
| Arable farming | –0.044 | 0.402 | –0.010 |
| Equipment | 0.267** | 0.116 | 0.060** |
| Labor | 0.170 | 0.200 | 0.038 |
| Gross operating surplus | 0.866* | 0.444 | 0.202* |
| Off-farm income | 0.931** | 0.380 | 0.195** |
| Age | 0.028* | 0.016 | 0.006* |
| College education | –0.886** | 0.350 | –0.189*** |
| Previous participation | 0.273 | 0.368 | 0.062 |
| Environmental concern | 0.696* | 0.368 | 0.162* |
| Coop | 0.225 | 0.393 | 0.050 |
| Agricultural network diversity | 0.383** | 0.160 | 0.085** |
| Nonagricultural network diversity | 0.464** | 0.191 | 0.103** |
| Héricourt-en-Caux | –0.146 | 0.433 | –0.033 |
| Model summary | |||
| Number of observations | 117 | ||
| Pseudo R2 | 0.41 | ||
| % of correct predictionsa | 79.49 |
[i] a Model predictions based on the threshold c = 0.57. Collinearity tests showed no sign of collinearity among the variables (mean variance inflation factor (VIF) = 1.51; SQRT VIF below 1.5 for all variables). (*), (**), and (***) represent significance at the 0.1, 0.05 and 0.01 levels, respectively. b The estimated average marginal effects correspond to the changes in the probability of participating in collaborative water management when an independent variable changes by one unit.
Table 6
Determinants of the level of participation in collaborative water management (ordered probit model).
| VARIABLE | COEFFICIENTS | STD. ERROR | AVERAGE MARGINAL EFFECTS a | |||
|---|---|---|---|---|---|---|
| NONPARTICIPATION | ONE ACTION | TWO-THREE ACTIONS | FOUR-SIX ACTIONS | |||
| Farm size | 0.0002 | 0.0018 | –0.00006 | –3.24e-07 | 8.96e-06 | 0.00005 |
| Eligible area | 0.017*** | 0.004 | –0.004*** | –0.0002 | 0.0007** | 0.004*** |
| Arable farming | –0.128 | 0.295 | 0.033 | –7.52e-06 | –0.005 | –0.028 |
| Equipment | 0.249** | 0.086 | –0.065** | –0.0003 | 0.010* | 0.055** |
| Labor | 0.163 | 0.149 | –0.042 | –0.0002 | 0.006 | 0.036 |
| Gross operating surplus | 0.532 | 0.346 | –0.144 | –0.0008 | 0.027 | 0.117 |
| Off-farm income | 0.176 | 0.255 | –0.046 | –0.0006 | 0.006 | 0.040 |
| Age | 0.020 | 0.013 | –0.005 | 0.00003 | 0.0008 | 0.004 |
| College education | –0.710** | 0.282 | 0.181** | –0.003 | –0.029** | –0.148** |
| Previous participation | 0.264 | 0.282 | –0.070 | –0.001 | 0.011 | 0.060 |
| Environmental concern | 0.736** | 0.352 | –0.200** | 0.007 | 0.043 | 0.150** |
| Coop | 0.041 | 0.287 | –0.011 | –0.0003 | 0.002 | 0.009 |
| Agricultural network diversity | 0.349** | 0.138 | –0.091** | –0.0005 | 0.014** | 0.078** |
| Nonagricultural network diversity | 0.377** | 0.150 | –0.098** | –0.0005 | 0.015** | 0.084** |
| Héricourt-en-Caux | –0.407 | 0.352 | 0.106 | 0.0001 | –0.016 | –0.091 |
| /cut1 | 4.095 | |||||
| /cut2 | 4.576 | |||||
| /cut3 | 5.287 | |||||
| Model summary | ||||||
| Number of observations | 116 | |||||
| Pseudo R2 | 0.22 | |||||
| % of correct predictions | 59.48 | |||||
[i] (*), (**), and (***) represent significance at the 0.1, 0.05 and 0.01 levels, respectively. aThe estimated average marginal effects correspond to the changes in the probability of belonging to one category when an independent variable changes by one unit.
Table 7
Farmers’ agricultural networks.
| ALL(N = 120) | NONPARTICIPANTS(N = 52) | PARTICIPANTS(N = 68) | |
|---|---|---|---|
| Agricultural association *** | 30% | 17.3% | 39.7% |
| Cooperative for machinery use *** | 66.7% | 51.9% | 77.9% |
| Farmer unions * | 31.7% | 23.1% | 38.2% |
| Management role ** | 13.3% | 5.8% | 19.1% |
| Number of agricultural networks *** | 2.2 | 1.75 | 2.6 |
| (1.6) | (1.7) | (1.5) | |
| Min: 0 Max: 6 | Min: 0 Max: 6 | Min: 0 Max: 6 | |
| Diversity of agricultural networks *** | 1.7 | 1.2 | 2.4 |
| (1.1) | (1) | (1.1) | |
| Min: 0 Max: 5 | Min: 0 Max: 4 | Min: 0 Max: 5 |
[i] Chi2 tests or Student’s t tests: * p value < 0.1; ** p value < 0.05; *** p value < 0.01.
Table 8
Farmers’ nonagricultural networks.
| ALL(N = 120) | NONPARTICIPANTS(N = 52) | PARTICIPANTS(N = 68) | |
|---|---|---|---|
| Association | 40.8% | 34.6% | 45.6% |
| Local government *** | 24.2% | 7.7% | 36.8% |
| Neighborhood group | 10.8% | 9.6% | 11.8% |
| Number of nonagricultural networks *** | 0.9 | 0.6 | 1.1 |
| (1) | (0.86) | (1) | |
| Min: 0 Max: 4 | Min: 0 Max: 3 | Min: 0 Max: 4 | |
| Diversity of nonagricultural networks *** | 0.8 | 0.5 | 1 |
| (0.8) | (0.7) | (0.8) | |
| Min: 0 Max: 3 | Min: 0 Max: 3 | Min: 0 Max: 3 |
[i] Chi2 tests or Student’s t tests: * p value < 0.1; ** p value < 0.05; *** p value < 0.01.