
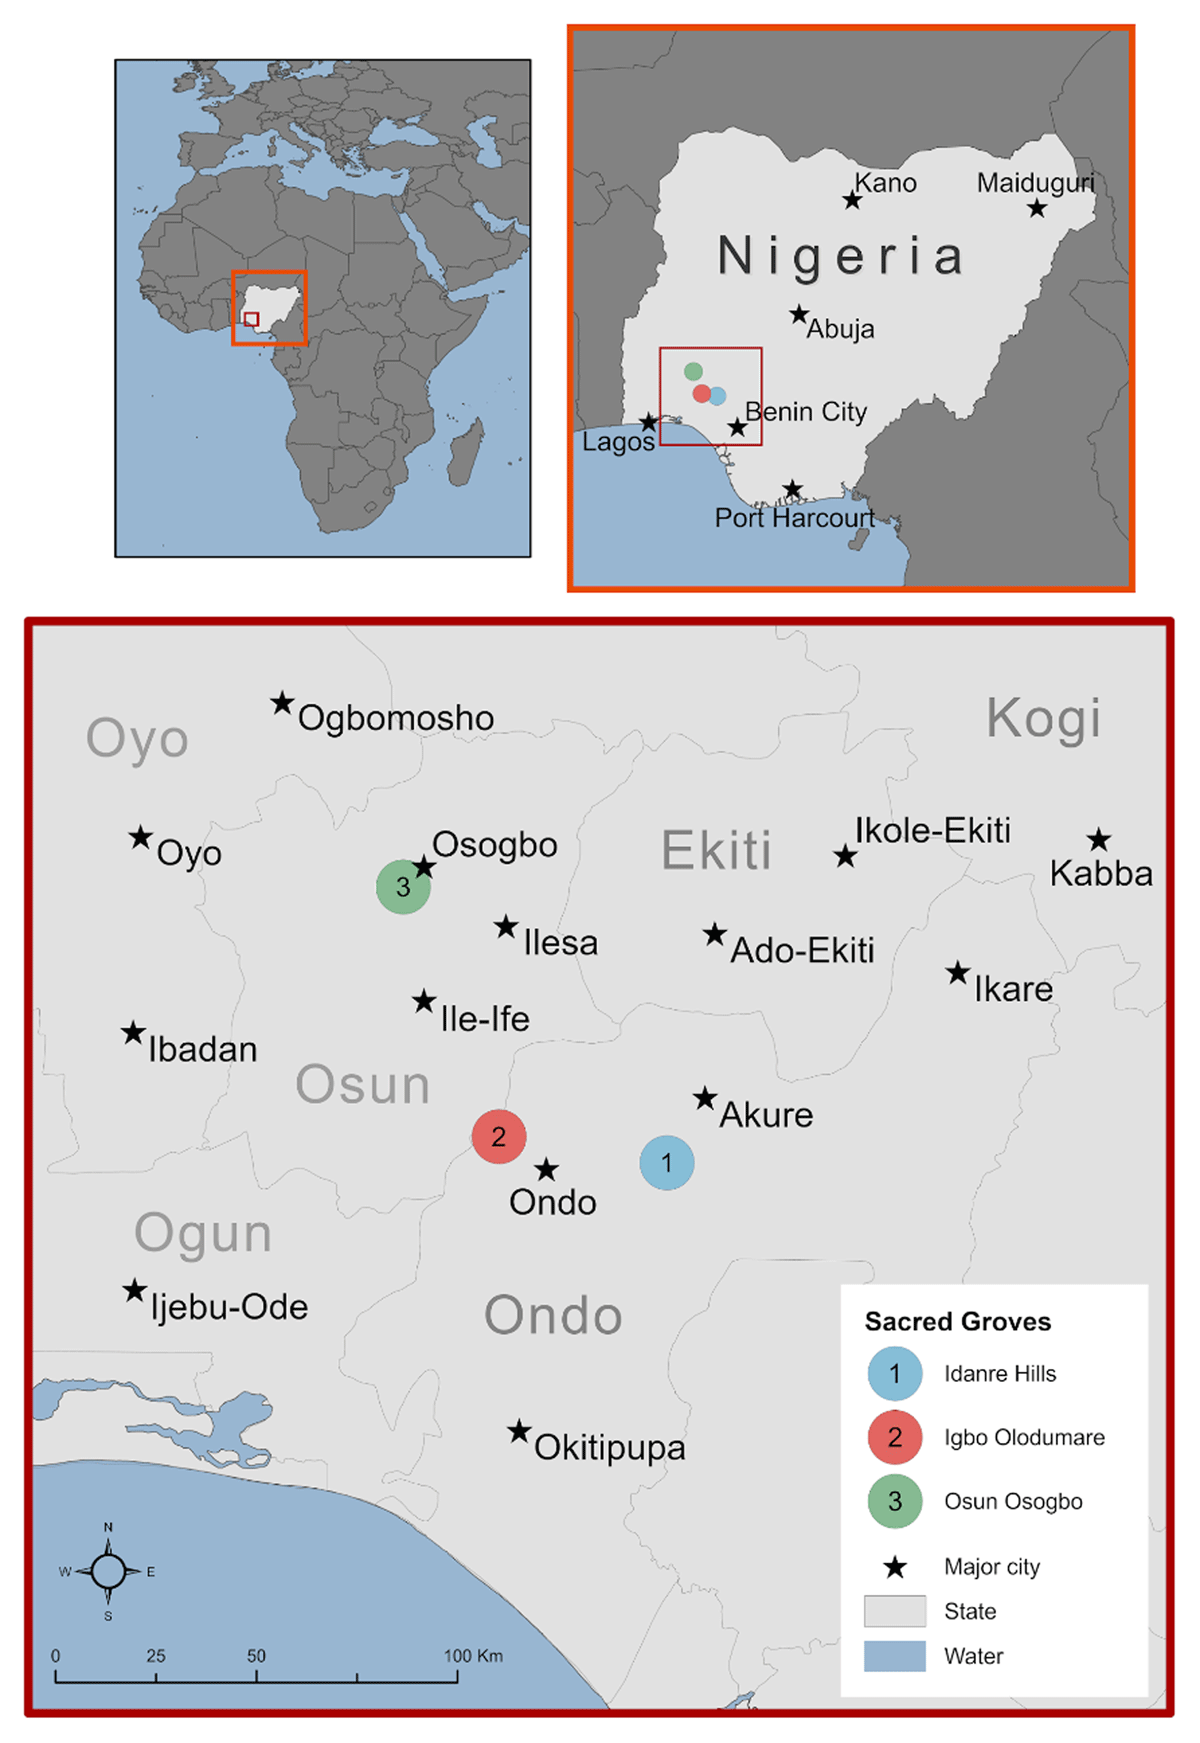
Figure 1
Map of Nigeria showing the study sites. The map was created by Agatha Czekaljo.
Table 1
List of possible benefits driving biodiversity conservation in sacred groves.
| CATEGORIES | LIST OF DRIVERS |
|---|---|
| Socio-economic drivers | Income generation, provision of social amenities, timber for poles and buildings, Non-Timber Forest Products (NTFPs) collection, fishing, hunting, tourism potential, employment opportunities |
| Religio-cultural drivers | Place of worship, ritual site, meeting point for traditional ceremonies, ordination of kings, place to seek supernatural interventions, cultural promotion, shelter for deities |
Table 2
Number and category of participants who took part in the study.
| OSUN OSOGBO SACRED GROVE | IDANRE HILLS | IGBO-OLODUMARE | |
|---|---|---|---|
| State | Osun State | Ondo State | Ondo State |
| Status | UNESCO World Heritage Site | Nigerian National Monument | State/Local cultural heritage site |
| # of survey respondents | 64 (6 priests; 58 community members) | 63 (2 priests; 61 community members) | 403 (1 priest; 39 community members) |
| # of focus groups | 2 | 3 | 2 |
| # of interviews with key informants | 1 | Nil | 1 |
Table 3
Overview of survey respondents’ demographics across the three sacred groves.
| VARIABLE | TOTAL NUMBER | PERCENTAGE (%) |
|---|---|---|
| Gender | ||
| Female | 63 | 38 |
| Male | 104 | 62 |
| Age range (years) | ||
| 18–35 | 30 | 18 |
| 36–60 | 75 | 45 |
| ≥ 61 | 62 | 37 |
| Education Level | ||
| Informal education | 51 | 31 |
| Primary | 29 | 17 |
| Secondary | 65 | 39 |
| Tertiary | 22 | 13 |
| Occupation | ||
| Agric. Rel. Jobs | 56 | 33 |
| Government workers | 6 | 4 |
| Others | 95 | 57 |
| Unemployed | 10 | 6 |
| Monthly Income (Naira – #)4 | ||
| 10,000–40,000 | 77 | 46 |
| 41,000–70,000 | 45 | 27 |
| 71,000 – 100,000 | 5 | 3 |
| ≥ 100,000 | 16 | 10 |
| Prefer not to answer | 24 | 14 |
| Religion | ||
| Christianity | 76 | 46 |
| Islam | 48 | 28 |
| Traditional | 43 | 26 |
| Nativity | ||
| Natives | 121 | 72 |
| Migrants5 | 46 | 28 |

Figure 2
Mean scores and standard errors showing respondents’ levels of agreement with the question “what are the socio-economic benefits that drive biodiversity conservation” in the three sacred groves using a 4-point scale from strongly disagree (1) to strongly agree (4).
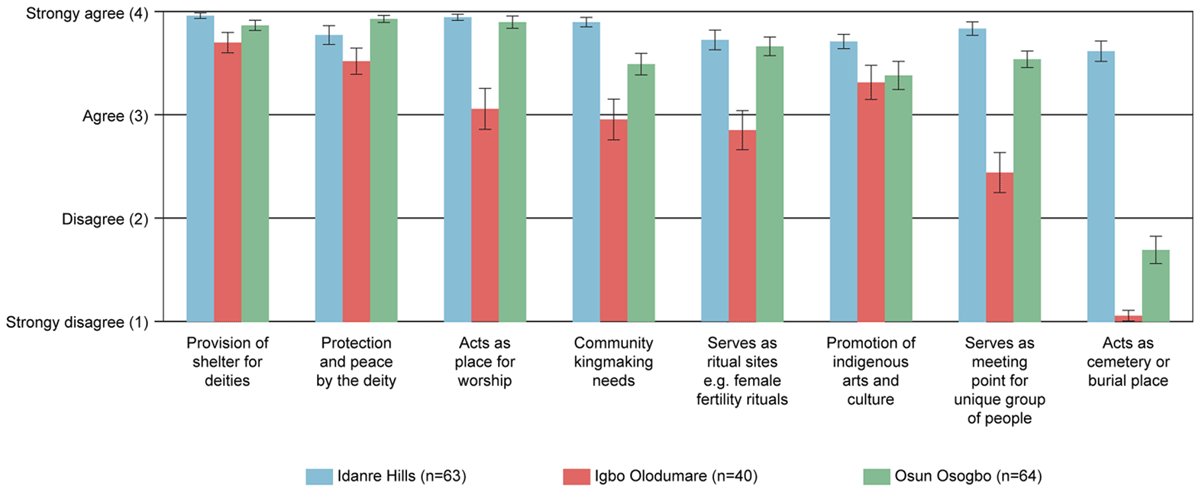
Figure 3
Mean scores and standard errors showing respondents’ levels of agreement with the question “what are the religio-cultural benefits that drive biodiversity conservation” in the three sacred groves, using a 4-point scale from strongly disagree (1) to strongly agree (4).