
Table 1
Participants characteristics of 4359 female CESCAS participants.
| N | In line with guidelines | Excessive drinkers | |||||
|---|---|---|---|---|---|---|---|
| Lifetime abstainers | Former drinkers | < 1 unit/week | 1–7 units/week | >7 units/week | Binge drinkers | ||
| % of participants | 4359 | 48.5 | 19.6 | 12.1 | 16.1 | 2.0 | 1.7 |
| Age group | |||||||
| 35–44 years | 1009 | 44.3 | 18.4 | 14.2 | 18.5 | 2.0 | 2.6 |
| 45–54 years | 1240 | 48.2 | 19.3 | 11.9 | 17.3 | 2.0 | 1.4 |
| 55–64 years | 1180 | 52.8 | 20.9 | 11.4 | 11.9 | 1.9 | 1.1 |
| 65–74 years | 930 | 54.3 | 21.7 | 7.8 | 13.5 | 2.3 | 0.4 |
| Country | |||||||
| Argentina | 2400 | 53.2 | 11.9 | 13.6 | 15.9 | 3.8 | 1.7 |
| Chile | 1027 | 49.3 | 21.9 | 9.9 | 16.6 | 0.7 | 1.6 |
| Uruguay | 932 | 34.9 | 31.0 | 15.4 | 15.2 | 1.7 | 1.8 |
| Obesity (BMI > 30) | 1845 | 52.4 | 18.7 | 12.0 | 13.8 | 1.4 | 1.6 |
| Smoking status | |||||||
| Current smoking | 1042 | 35.0 | 18.8 | 14.9 | 23.9 | 3.7 | 3.7 |
| Former smoking | 878 | 39.6 | 22.6 | 13.1 | 20.4 | 2.0 | 2.3 |
| Never smoking | 2424 | 58.7 | 18.8 | 10.4 | 10.5 | 1.2 | 0.4 |
| Education level | |||||||
| Primary education | 2028 | 54.9 | 19.9 | 10.8 | 11.5 | 1.5 | 1.4 |
| Secondary education | 1590 | 49.7 | 19.7 | 11.5 | 15.6 | 1.8 | 1.6 |
| University | 736 | 36.7 | 19.0 | 15.0 | 24.0 | 3.2 | 2.1 |
| Low physical activity | 1661 | 50.3 | 19.7 | 11.5 | 15.0 | 1.8 | 1.8 |
| Presence or history of disease | |||||||
| No history of disease | 2621 | 46.9 | 18.4 | 13.4 | 17.4 | 1.9 | 1.9 |
| High CVD risk | 358 | 54.3 | 23.5 | 7.9 | 10.5 | 1.5 | 2.4 |
| Cardiovascular disease | 490 | 49.0 | 25.2 | 10.2 | 11.3 | 2.0 | 2.3 |
| Respiratory disease | 489 | 46.8 | 20.3 | 10.9 | 18.8 | 2.9 | 0.4 |
| Malignancy | 140 | 47.0 | 22.3 | 9.6 | 18.0 | 2.2 | 0.9 |
| Multimorbidity | 261 | 64.6 | 17.1 | 7.9 | 8.0 | 1.4 | 1.0 |
| Comorbidities | |||||||
| Diabetes | 646 | 53.5 | 21.3 | 11.5 | 11.2 | 1.0 | 1.4 |
| Hypertension | 1956 | 53.0 | 21.9 | 9.5 | 12.3 | 1.7 | 1.5 |
| Dyslipidemia | 2219 | 49.9 | 21.3 | 11.3 | 14.5 | 1.9 | 1.1 |
| Total cholesterol (mg/dl) | 201 ± 42 | 201 ± 44 | 203 ± 41 | 203 ± 41 | 206 ± 37 | 199 ± 40 | |
| HDL cholesterol (mg/dl) | 48 ± 12 | 48 ± 13 | 49 ± 12 | 51 ± 13 | 52 ± 14 | 50 ± 12 | |
| Median alcohol consumption in g/week | 0 [0, 0] | 0 [0, 0] | 0 [0, 0] | 28 [14, 46] | 124 [101, 155] | 41 [14, 83] | |
[i] Values represent percentages; absolute numbers; means ± standard deviations; medians [25–75 percentiles]. Abbreviations: BMI (body mass index), CESCAS (Centro de Excelencia en Salud Cardiovascular para el Cono Sur), CVD (cardiovascular disease), HDL (high-density cholesterol).
Table 2
Participant characteristics of 3161 male CESCAS participants.
| N | In line with guidelines | Excessive drinkers | |||||
|---|---|---|---|---|---|---|---|
| Lifetime abstainers | Former drinkers | <1 unit/week | 1–14 units/week | >14 units/week | Binge drinkers | ||
| % of participants | 3161 | 24.4 | 16.8 | 11.5 | 33.5 | 4.0 | 9.9 |
| Age group | |||||||
| 35–44 years | 705 | 27.1 | 13.1 | 12.2 | 32.4 | 2.7 | 12.6 |
| 45–54 years | 831 | 23.2 | 16.3 | 11.5 | 34.3 | 3.7 | 11.1 |
| 55–64 years | 935 | 20.8 | 20.9 | 11.6 | 34.3 | 5.9 | 6.4 |
| 65–74 years | 690 | 24.5 | 23.0 | 8.7 | 34.0 | 5.3 | 4.5 |
| Country | |||||||
| Argentina | 2400 | 25.6 | 12.2 | 13.9 | 35.8 | 5.9 | 6.6 |
| Chile | 1027 | 27.7 | 18.4 | 10.0 | 29.4 | 1.2 | 13.3 |
| Uruguay | 932 | 11.7 | 22.9 | 10.0 | 39.9 | 7.5 | 7.9 |
| Obesity (BMI > 30) | 1067 | 23.6 | 16.4 | 12.0 | 34.6 | 3.5 | 9.9 |
| Smoking status | |||||||
| Current smoking | 960 | 18.1 | 12.8 | 12.0 | 35.6 | 5.8 | 15.7 |
| Former smoking | 1103 | 19.0 | 22.2 | 12.5 | 33.7 | 4.6 | 8.0 |
| Never smoking | 1076 | 35.4 | 15.4 | 10.2 | 31.1 | 1.7 | 6.3 |
| Education level | |||||||
| Primary education | 1380 | 22.1 | 17.9 | 11.9 | 31.9 | 5.0 | 11.2 |
| Secondary education | 1200 | 24.7 | 17.6 | 11.3 | 33.1 | 3.5 | 9.8 |
| University | 579 | 26.8 | 13.8 | 11.3 | 36.4 | 3.2 | 8.5 |
| Low physical activity | 892 | 28.7 | 17.5 | 11.2 | 31.3 | 3.8 | 7.5 |
| Presence or history of disease: | |||||||
| No history of disease | 1398 | 25.7 | 14.6 | 12.0 | 34.2 | 3.0 | 10.4 |
| High CVD risk | 852 | 22.3 | 15.7 | 13.6 | 36.3 | 5.7 | 6.5 |
| Cardiovascular disease | 452 | 21.9 | 25.9 | 8.2 | 30.3 | 4.9 | 8.7 |
| Respiratory disease | 292 | 24.5 | 17.5 | 9.9 | 27.6 | 4.2 | 16.3 |
| Malignancy | 55 | 26.7 | 25.3 | 8.9 | 32.8 | 4.5 | 1.9 |
| Multimorbidity | 111 | 19.5 | 23.8 | 5.8 | 34.9 | 6.8 | 9.2 |
| Comorbidities | |||||||
| Diabetes | 414 | 23.1 | 23.5 | 12.2 | 30.0 | 3.4 | 7.7 |
| Hypertension | 1625 | 21.4 | 17.7 | 11.1 | 34.5 | 5.5 | 9.9 |
| Dyslipidemia | 2098 | 25.2 | 17.0 | 12.4 | 32.8 | 3.2 | 9.4 |
| Total cholesterol (mg/dl) | 197 ± 39 | 192 ± 44 | 204 ± 42 | 206 ± 42 | 209 ± 45 | 207 ± 38 | |
| HDL cholesterol (mg/dl) | 40 ± 11 | 41 ± 12 | 40 ± 9 | 43 ± 11 | 48 ± 18 | 46 ± 16 | |
| Median alcohol consumption in g/week | 0 [0, 0] | 0 [0, 0] | 0 [0, 0] | 51 [26, 86] | 264 [210, 331] | 83 [39, 160] | |
[i] Values represent percentages; absolute numbers; means ± standard deviations; medians [25–75 percentiles]. Abbreviations: BMI (body mass index), CESCAS (Centro de Excelencia en Salud Cardiovascular para el Cono Sur), CVD (cardiovascular disease), HDL (high-density cholesterol).
Table 3
Motivation for alcohol consumption cessation in 1263 former drinkers from the CESCAS cohort.
| Quit Because of Health Reasons | |||||
|---|---|---|---|---|---|
| Yes | No | Total | |||
| Quit Because of A Health Worker’s Advice | All (N = 1263) | Yes | 11.6% | 0.5% | 12.1% |
| No | 11.0% | 76.9% | 87.9% | ||
| Total | 22.5% | 77.5% | 100% | ||
| Women (N = 731) | Yes | 7.9% | 0.3% | 8.2% | |
| No | 10.9% | 80.9% | 91.8% | ||
| Total | 18.8% | 81.2% | 100% | ||
| Men (N = 532) | Yes | 16.3% | 0.9% | 17.2% | |
| No | 11.1% | 71.7% | 82.8% | ||
| Total | 27.4% | 72.6% | 100% | ||
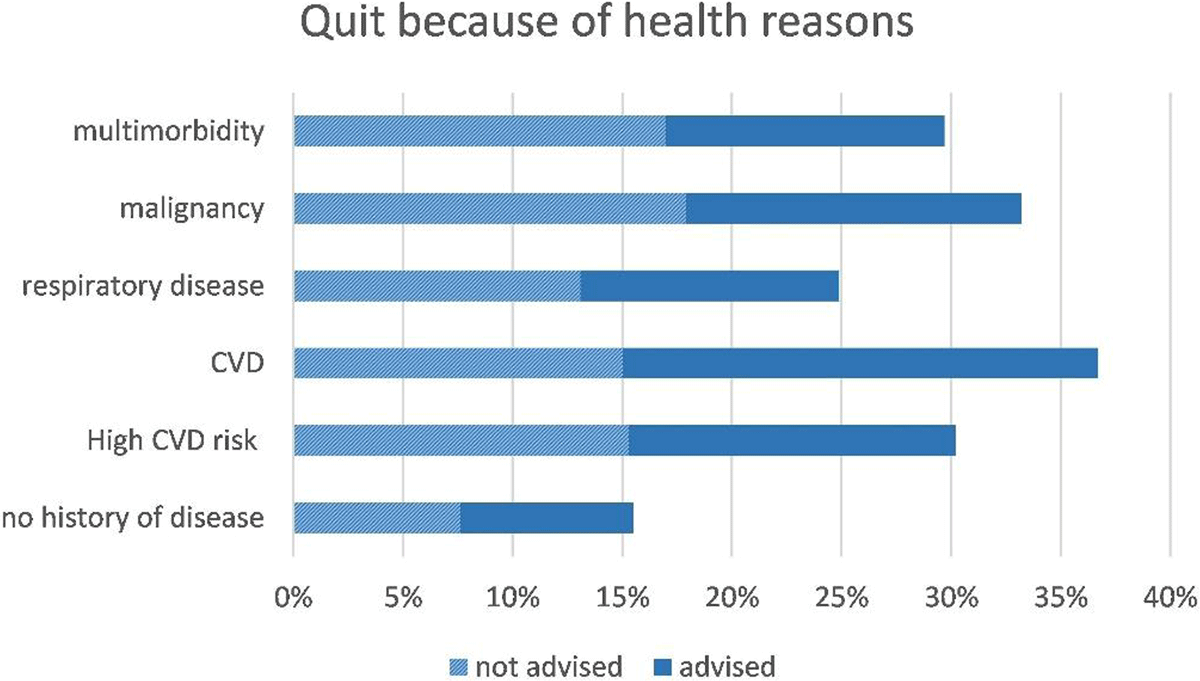
Figure 1
Percentages of CESCAS participants that quit because of health reasons, per disease category, with proportions of them being additionally advised of not advised.

Figure 2
Percentages of CESCAS participants that quit because they were advised to do so, per disease category, with proportions of them that additionally quit because of health reasons.
Table 4
Determinants of alcohol consumption cessation because of a health worker’s advice and because of health reasons in 1263 former drinkers.
| Determinant | Because of advised to quit (Yes: N = 193) OR (95% CI) | Because of health reasons (Yes: N = 348) OR (95%) |
|---|---|---|
| Demographic determinants | ||
| Male sex | 2.77 (1.79–4.30) | 1.85 (1.30–2.65) |
| Age | – | 1.02 (1.00–1.04) |
| Country (ref Argentina) | ||
| Chile | 0.53 (0.30–0.93) | 0.68 (0.43–1.06) |
| Uruguay | 0.83 (0.55–1.27) | 1.13 (0.79–1.61) |
| Education (ref low education) | ||
| Intermediate education | 1.89 (0.58–1.38) | 0.98 (0.67–1.42) |
| High education | 0.37 (0.18–0.79) | 0.57 (0.33–0.98) |
| Disease determinants | ||
| History of disease: (ref no history of disease) | ||
| High CVD risk | – | 1.34 (0.85–2.15) |
| Cardiovascular disease | – | 1.86 (1.18–2.93) |
| Respiratory disease | – | 1.35 (0.76–2.40) |
| Malignancy | – | 2.82 (1.04–7.63) |
| Multimorbidity | – | 0.90 (0.46–1.74) |
| Access to healthcare | ||
| Having a primary physician | 1.51 (0.96–2.38) | 1.30 (0.89–1.89) |
| Visits to a health professional (ref = 0–2/year) | ||
| 2–12 per year | 1.95 (1.07–2.22) | 1.48 (1.01–2.14) |
| > 12 per year | 2.69 (1.03–4.05) | 2.61 (1.38–4.93) |
[i] Abbreviations: CI (confidence interval), CVD (cardiovascular disease), OR (odds ratio).
Numbers in bold are associations that were found statistically significant (P < 0.05).
The presented odds ratios are the risk estimates from the multivariable regression analyses after backward selection was performed.