
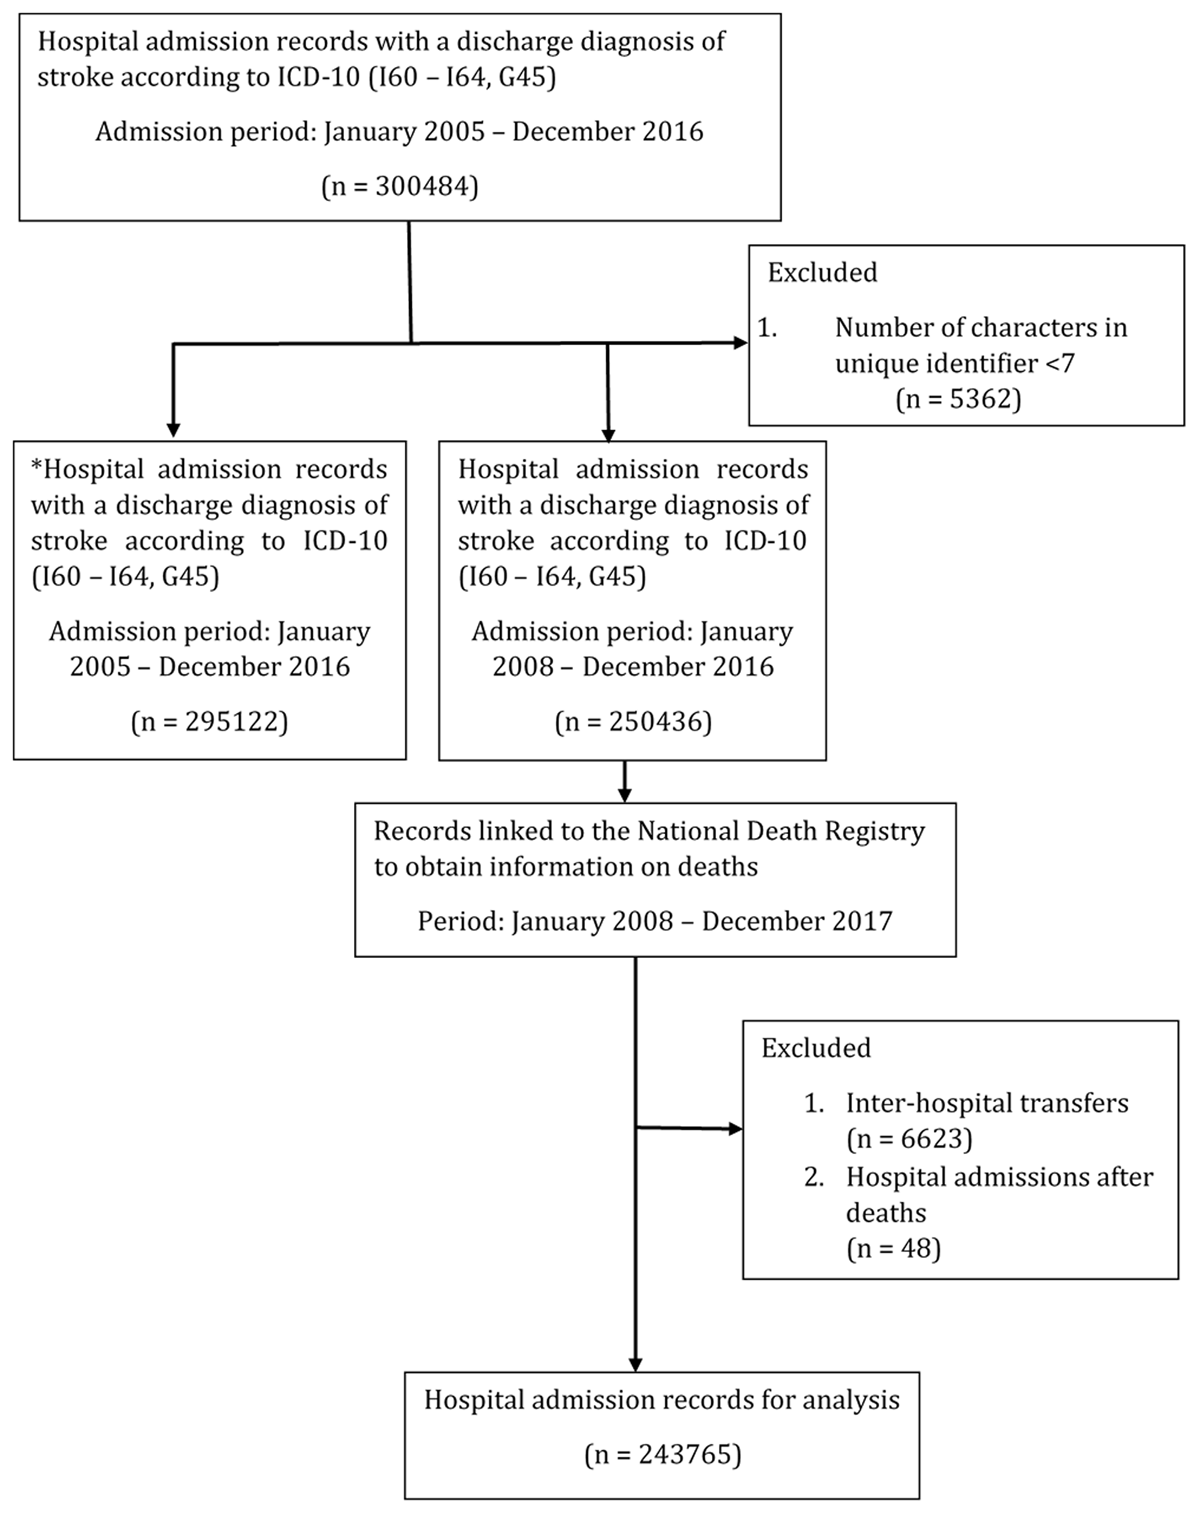
Figure 1
Flow chart showing the process of data linkage and patient selection for analysis. * Dataset used to identify patients with previous hospital admission for stroke in the last 3 consecutive years.
Table 1
Baseline characteristics of hospital admissions for stroke from 2008 to 2016.
| Year | ||||||||||||||||||
|---|---|---|---|---|---|---|---|---|---|---|---|---|---|---|---|---|---|---|
| 2008(n) | 2009(n) | 2010(n) | 2011(n) | 2012(n) | 2013(n) | 2014(n) | 2015(n) | 2016(n) | ||||||||||
| Total admissions for stroke | 24197 | 25351 | 26539 | 29992 | 20544 | 26537 | 30815 | 32749 | 33664 | |||||||||
| Hospital transfers | 534 | 638 | 675 | 911 | 594 | 734 | 850 | 827 | 860 | |||||||||
| Hospital admissions for stroke (excluding transfers) | 23663 | 24713 | 25864 | 29081 | 19950 | 25803 | 29965 | 31922 | 32804 | |||||||||
| Baseline characteristics | n | (%) | n | (%) | n | (%) | n | (%) | n | (%) | n | (%) | n | (%) | n | (%) | n | (%) |
| Mean age (SD) | 61 | (16) | 61 | (16) | 61 | (16) | 61 | (16) | 61 | (15) | 61 | (15) | 61 | (15) | 61 | (15) | 61 | (15) |
| Age groups | ||||||||||||||||||
| 0–34 | 1287 | 5.4 | 1482 | 6.0 | 1404 | 5.4 | 1555 | 5.3 | 967 | 4.8 | 1262 | 4.9 | 1597 | 5.3 | 1582 | 5.0 | 1648 | 5.0 |
| 35–39 | 561 | 2.4 | 628 | 2.5 | 676 | 2.6 | 709 | 2.4 | 519 | 2.6 | 658 | 2.6 | 916 | 3.1 | 963 | 3.0 | 1030 | 3.1 |
| 40–44 | 1018 | 4.3 | 1087 | 4.4 | 1144 | 4.4 | 1353 | 4.7 | 871 | 4.4 | 1159 | 4.5 | 1342 | 4.5 | 1553 | 4.9 | 1661 | 5.1 |
| 45–49 | 1697 | 7.2 | 1790 | 7.2 | 1851 | 7.2 | 2070 | 7.1 | 1472 | 7.4 | 1971 | 7.6 | 2268 | 7.6 | 2364 | 7.4 | 2500 | 7.6 |
| 50–54 | 2459 | 10.4 | 2537 | 10.3 | 2727 | 10.5 | 3105 | 10.7 | 2169 | 10.9 | 2701 | 10.5 | 3233 | 10.8 | 3374 | 10.6 | 3519 | 10.7 |
| 55–59 | 2733 | 11.5 | 2925 | 11.8 | 3226 | 12.5 | 3537 | 12.2 | 2476 | 12.4 | 3162 | 12.3 | 3764 | 12.6 | 4009 | 12.6 | 4184 | 12.8 |
| 60–64 | 3025 | 12.8 | 3081 | 12.5 | 3364 | 13.0 | 3862 | 13.3 | 2614 | 13.1 | 3383 | 13.1 | 3947 | 13.2 | 4226 | 13.2 | 4413 | 13.5 |
| 65–69 | 3335 | 14.1 | 3279 | 13.3 | 3302 | 12.8 | 3559 | 12.2 | 2584 | 13.0 | 3281 | 12.7 | 3894 | 13.0 | 4198 | 13.2 | 4225 | 12.9 |
| 70–74 | 3169 | 13.4 | 3337 | 13.5 | 3384 | 13.1 | 3719 | 12.8 | 2430 | 12.2 | 3197 | 12.4 | 3427 | 11.4 | 3538 | 11.1 | 3530 | 10.8 |
| 75–79 | 2237 | 9.5 | 2289 | 9.3 | 2380 | 9.2 | 2809 | 9.7 | 2040 | 10.2 | 2608 | 10.1 | 2970 | 9.9 | 3200 | 10.0 | 3075 | 9.4 |
| 80–84 | 1341 | 5.7 | 1378 | 5.6 | 1502 | 5.8 | 1720 | 5.9 | 1131 | 5.7 | 1438 | 5.6 | 1620 | 5.4 | 1757 | 5.5 | 1849 | 5.6 |
| 85+ | 801 | 3.4 | 900 | 3.6 | 904 | 3.5 | 1083 | 3.7 | 677 | 3.4 | 983 | 3.8 | 987 | 3.3 | 1158 | 3.6 | 1170 | 3.6 |
| Sex | ||||||||||||||||||
| Men | 13568 | 57.3 | 14343 | 58.0 | 14841 | 57.4 | 16901 | 58.1 | 11616 | 58.2 | 15049 | 58.3 | 17708 | 59.1 | 18878 | 59.1 | 19385 | 59.1 |
| Women | 10095 | 42.7 | 10370 | 42.0 | 11023 | 42.6 | 12180 | 41.9 | 8334 | 41.8 | 10754 | 41.7 | 12257 | 40.9 | 13044 | 40.9 | 13419 | 40.9 |
| Ethnicity | ||||||||||||||||||
| Malay | 12963 | 54.8 | 13839 | 56.0 | 14272 | 55.2 | 16355 | 56.2 | 11693 | 58.6 | 14486 | 56.1 | 17039 | 56.9 | 18470 | 57.9 | 19150 | 58.4 |
| Chinese | 5418 | 22.9 | 5564 | 22.5 | 5761 | 22.3 | 6469 | 22.2 | 3848 | 19.3 | 5265 | 20.4 | 5812 | 19.4 | 6208 | 19.4 | 6223 | 19.0 |
| Indian | 2465 | 10.4 | 2485 | 10.1 | 2513 | 9.7 | 2881 | 9.9 | 1649 | 8.3 | 2271 | 8.8 | 2691 | 9.0 | 2686 | 8.4 | 2832 | 8.6 |
| Others | 2817 | 11.9 | 2808 | 11.4 | 2690 | 10.4 | 3338 | 11.5 | 2757 | 13.8 | 3781 | 14.7 | 4386 | 14.6 | 4434 | 13.9 | 4487 | 13.7 |
| Unknown | 0 | 0.0 | 17 | 0.1 | 628 | 2.4 | 38 | 0.1 | 3 | 0.0 | 0 | 0.0 | 37 | 0.1 | 124 | 0.4 | 112 | 0.3 |
| Stroke subtypes | ||||||||||||||||||
| Ischemic | 17280 | 73.0 | 17749 | 71.8 | 18313 | 70.8 | 20547 | 70.7 | 14748 | 73.9 | 18761 | 72.7 | 21383 | 71.4 | 23192 | 72.7 | 24109 | 73.5 |
| Hemorrhagic | 3812 | 16.1 | 4259 | 17.2 | 4803 | 18.6 | 5503 | 18.9 | 3182 | 15.9 | 4354 | 16.9 | 5573 | 18.6 | 5692 | 17.8 | 5653 | 17.2 |
| Subarachnoid hemorrhage | 438 | 1.9 | 450 | 1.8 | 525 | 2.0 | 605 | 2.1 | 399 | 2.0 | 627 | 2.4 | 764 | 2.5 | 698 | 2.2 | 693 | 2.1 |
| Transient Ischemic Attack (TIA) | 2133 | 9.0 | 2255 | 9.1 | 2223 | 8.6 | 2426 | 8.3 | 1621 | 8.1 | 2061 | 8.0 | 2245 | 7.5 | 2340 | 7.3 | 2349 | 7.2 |
| Median length of hospital stay* (IQR) | 3 | (3) | 3 | (4) | 3 | (4) | 3 | (3) | 3 | (4) | 3 | (4) | 3 | (4) | 3 | (4) | 3 | (3) |
[i] * Length of stay includes the duration between hospital transfers.
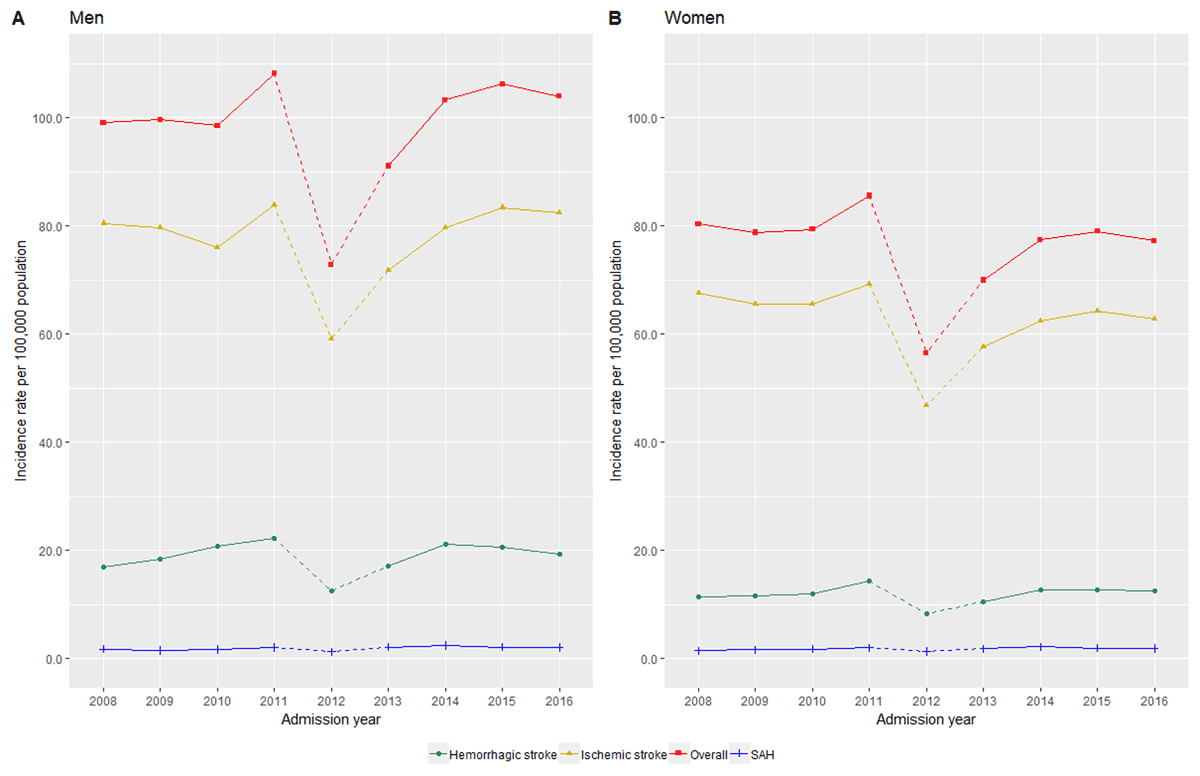
Figure 2
Trends in the age-adjusted incidence for hospitalized stroke by its subtypes for A) men and B) women from year 2008 to 2016 in Malaysia (age and sex-adjusted to 2016 Malaysian population). * Note: Dashed lines between 2012 and 2013 to indicate poor response rates as a result of starting a new web-based registration for hospital admissions in the country.
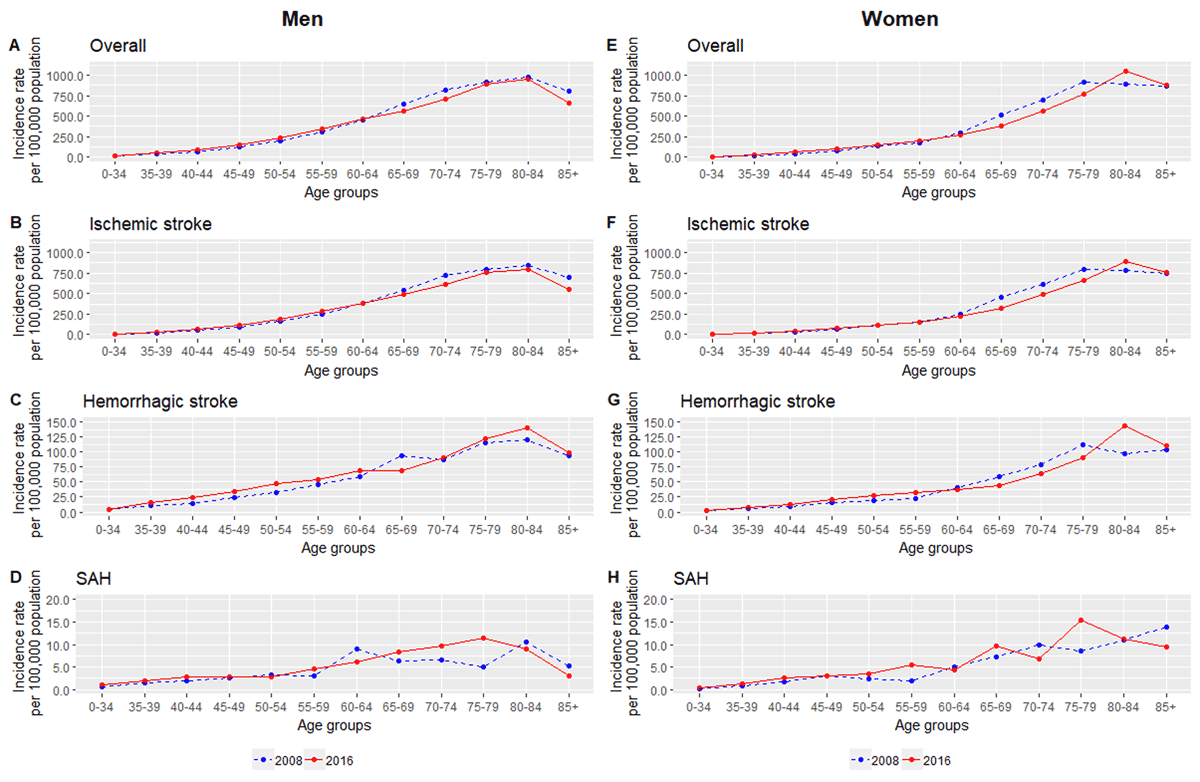
Figure 3
Trends in the incidence of hospitalized stroke by age groups and subtypes for men (A–D) and women (E–H) for year 2008 and 2016 in Malaysia. ICD-10 codes for overall stroke includes I60–I64 and G45, ischemic stroke (I63–I64 and G45), hemorrhagic stroke (I61–I62) and subarachnoid haemorrhage (I60).
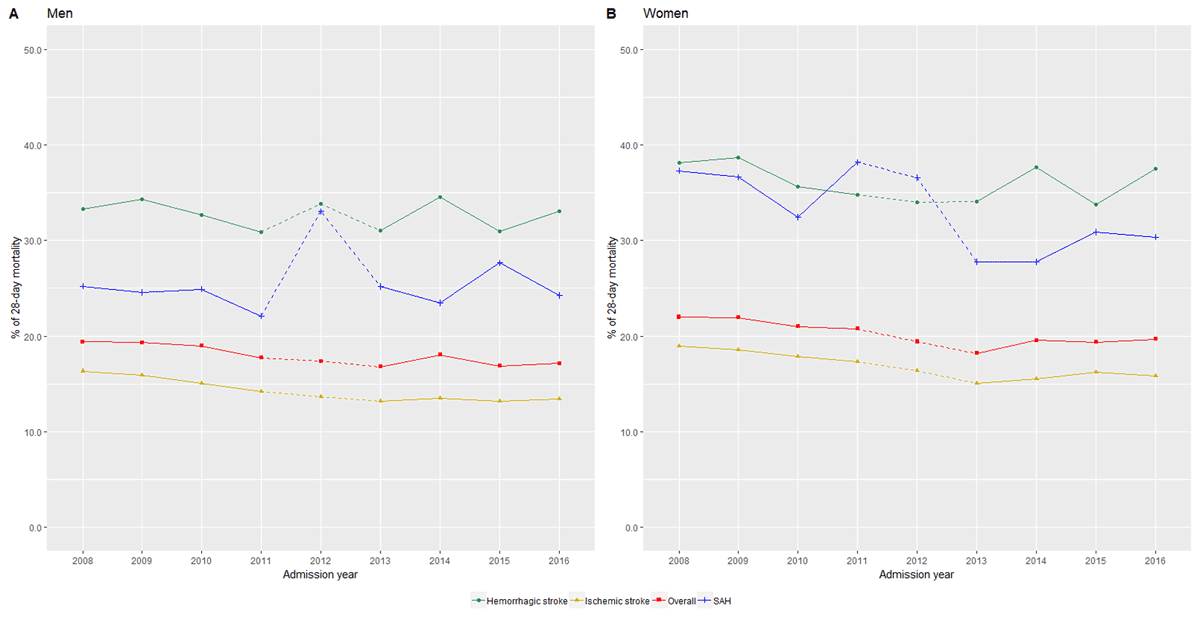
Figure 4
Trends in the age-adjusted proportion of 28-day all-cause mortality from stroke by its subtypes for A) men and B) women from year 2008 to 2016 in Malaysia (age and sex-adjusted to 2016 Malaysian population). * Note: Dashed lines between 2012 and 2013 to indicate a drop of response rates as a result of starting a new web-based registration for hospital admissions in the country.

Figure 5
Trends in the proportion of 28-day all-cause mortality from stroke by age groups and subtypes for men (A–D) and women (E–H) for year 2008 and 2016 in Malaysia. ICD-10 codes for overall stroke includes I60–I64 and G45, ischemic stroke (I63–I64 and G45), hemorrhagic stroke (I61–I62) and subarachnoid haemorrhage (I60).