
Table 1
Baseline characteristics of patients discharged following CABG (n = 189).
| Mean ± SD/Frequency | Percentage | |
|---|---|---|
| Age (years) | 59.7 ± 10.4 | N/A |
| Nationality – Emirati | 88 | 46.6% |
| Gender – Male | 166 | 87.8% |
| Out of Emiratis Only | 73 | 82.95% |
| Past Medical History (Most to Least Prevalent) | ||
| Hyperlipidemia | 170 | 89.9% |
| Hypertension | 157 | 83.1 |
| Diabetes | 134 | 70.9% |
| Heart failure | 51 | 27.0% |
| Prior PCI | 47 | 24.9% |
| CKD (GFR <60 mL/min) | 35 | 18.5% |
| PVD | 15 | 7.9% |
| Uncontrolled Hypothyroidism | 10 | 5.3% |
| Stroke or TIA | 8 | 4.2% |
| Prior CABG | 2 | 1.1% |
| Body Mass Index (kg/m2) | 27.7 ± 4.9 | N/A |
| Smoker (current or former) | 82 | 43.4% |
| Presentation on Admission | ||
| ACS | 128 | 67.7% |
| Stable angina | 61 | 32.3% |
| Length of Stay (days) | 8.4 ± 7.5 | N/A |
| AACE Classification | ||
| Very high risk | 28 | 14.8% |
| Extremely high risk | 161 | 85.2% |
| ACC/AHA Classification | ||
| Clinical ASCVD | 30 | 15.9% |
| Very high risk ASCVD | 159 | 84.1% |
[i] PCI = Percutaneous Coronary Intervention, CKD = Chronic Kidney Disease, PVD = Peripheral Vascular Disease, TIA = Transient Ischemic Attack, CABG = Coronary Artery Bypass Graft, ACS = Acute Coronary Syndrome, AACE = American Association of Clinical Endocrinologists, ACC/AHA = American College of Cardiology/American Heart Association.
Table 2
Lipid panel and management of CABG patients (n = 189).
| On statins prior to CABG | 91.0% (172) |
|---|---|
| High intensity | 72.7% (125, n = 172) |
| – Atorvastatin | 33.1% (40 mg)|18.6% (80 mg) |
| – Rosuvastatin | 18.6% (20 mg)|3.5% (40 mg) |
| Moderate intensity | 24.9% (47, n = 172) |
| – Atorvastatin | 19.8% |
| – Rosuvastatin | 6.4% |
| – Other | 1.2% |
| Combination with other agents | 7.6% (13, n = 172) |
| On statins at discharge | 99.5% (188) |
| High intensity | 93.6% (176, n = 188) |
| – Atorvastatin | 35.6% (40 mg)|31.9% (80 g) |
| – Rosuvastatin | 18.1% (20 g)|8.0% (40 mg) |
| Moderate intensity | 6.4% (12, n = 188) |
| – Atorvastatin | 2.7% |
| – Rosuvastatin | 3.7% |
| Combination with other agents | 5.3% (10, n = 188) |
| Availability of lipid panel | |
| At baseline | 59.8% |
| Up to the 3 months visit (n = 175) | 14.3% |
| Beyond 3 months visit (n = 84) | 51.2% |
| Achievement of LDL goal at any follow up beyond 3 months | |
| LDL ≤ 100 mg/dL | 86% |
| LDL ≤ 70 mg/dL | 58.1% |
| LDL ≤ 55 mg/dL** | 29% |
[i] ** Percentage out of those deemed extremely high risk per the AACE guidelines (n = 161, 85.2%).

Figure 1
Percentage of CABG patients who completed a clinic visit at the different time intervals (up to 3 months and beyond 3 months) following surgery based on the specialty of the providers.
* Patients seen by a medical specialty physician (cardiology, endocrinology and/or internal medicine) might also have been seen by cardiac surgery (CTS).
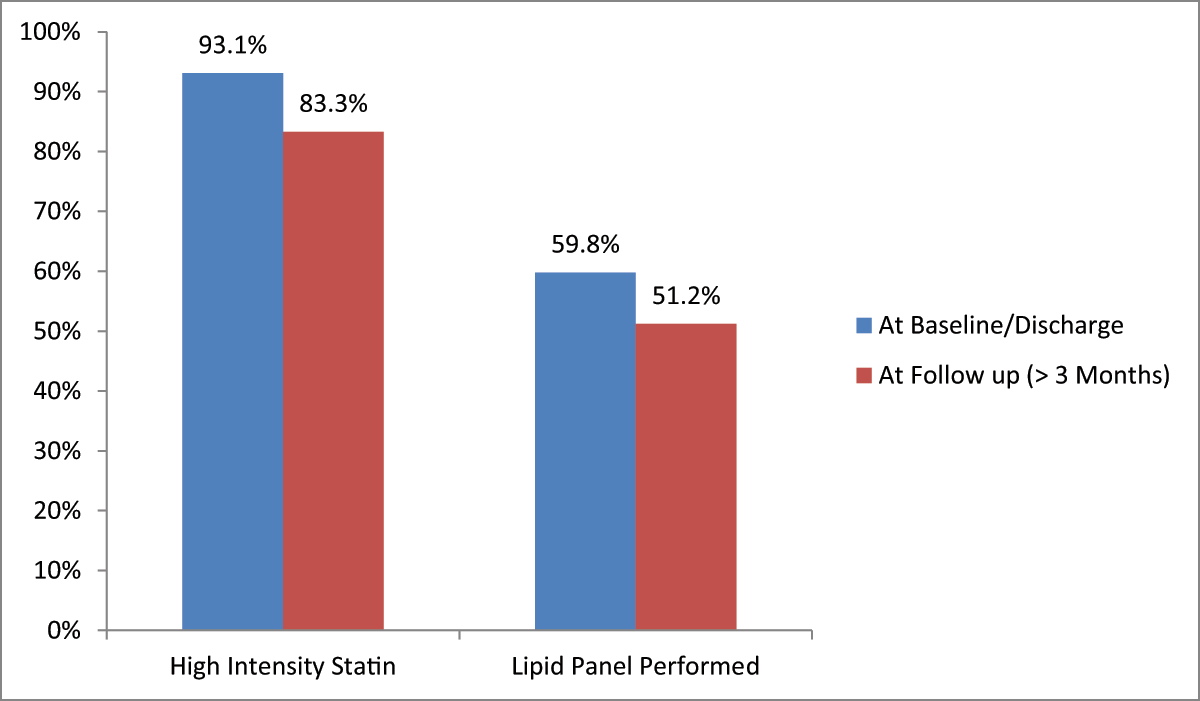
Figure 2
Percentage of lipid panels performed and patients on high intensity statins at discharge and at follow up (beyond the first 3 months).
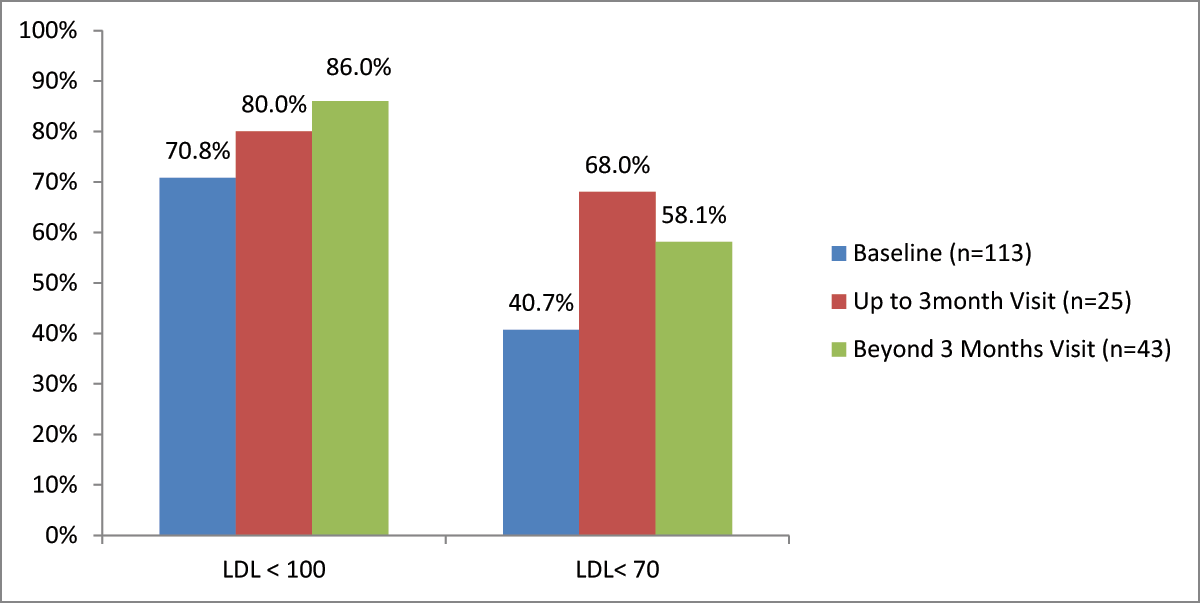
Figure 3
Percentage of patients achieving LDL goals at baseline and follow up visits (LDL in mg/dL).
Table 3
Prevalence of different interventions in patients who followed up.
| 0–4 Months | 5–8 Months | 9–12 Months | Beyond 12 Months | |
|---|---|---|---|---|
| No Intervention | 93.1% | 92.3% | 81.2% | 87.4% |
| Statin Dose Increased | 2.3% | 2.6% | 4.3% | 4.6% |
| Statin Dose Decreased | 2.3% | 3.8% | 13.0% | 4.6% |
| Statin Switched | 0.6% | 0.0% | 0.0% | 1.1% |
| Ezetimibe Added | 1.7% | 1.3% | 1.4% | 2.3% |
| PCSK9 Added | 0.0% | 0.0% | 0.0% | 0.0% |
| Follow Up (n = 189) | 175 (92.6%) | 78 (41.3%) | 69 (36.5%) | 87 (46.0%) |
Table 4
Logistic regression model for predictors of lipid panel ordering in those who followed up beyond 3 monthsX.
| Variables | Estimate | Std. Error | Z | p-Value | Odds Ratio | 95% CI Odds Ratio | |
|---|---|---|---|---|---|---|---|
| min | max | ||||||
| Intercept | 2.38 | 2.64 | 0.903 | 0.367 | 10.84 | 0.06 | 1914.30 |
| Speciality Seen (Cardiologist) | 1.61 | 0.80 | 2.008 | 0.045** | 4.99 | 1.04 | 23.95 |
| Age (Years) | –0.05 | 0.03 | –1.722 | 0.085* | 0.96 | 0.91 | 1.01 |
[i] ** Statistically significant at the 95% confidence interval.
* Statistically significant at the 90% confidence interval.
X The multivariate analysis included variables of Age, Specialty Seen (CT Surgeon, Cardiologist, Endo), BMI, Nationality, Diabetes, CVD Family History, and Risk Classification per ACC/AHA Guidelines, and AACE Guidelines. Patients who followed up with a cardiologist (p > 0.05) and who were younger (p > 0.1) were more likely to have lipid panels ordered during follow up.