
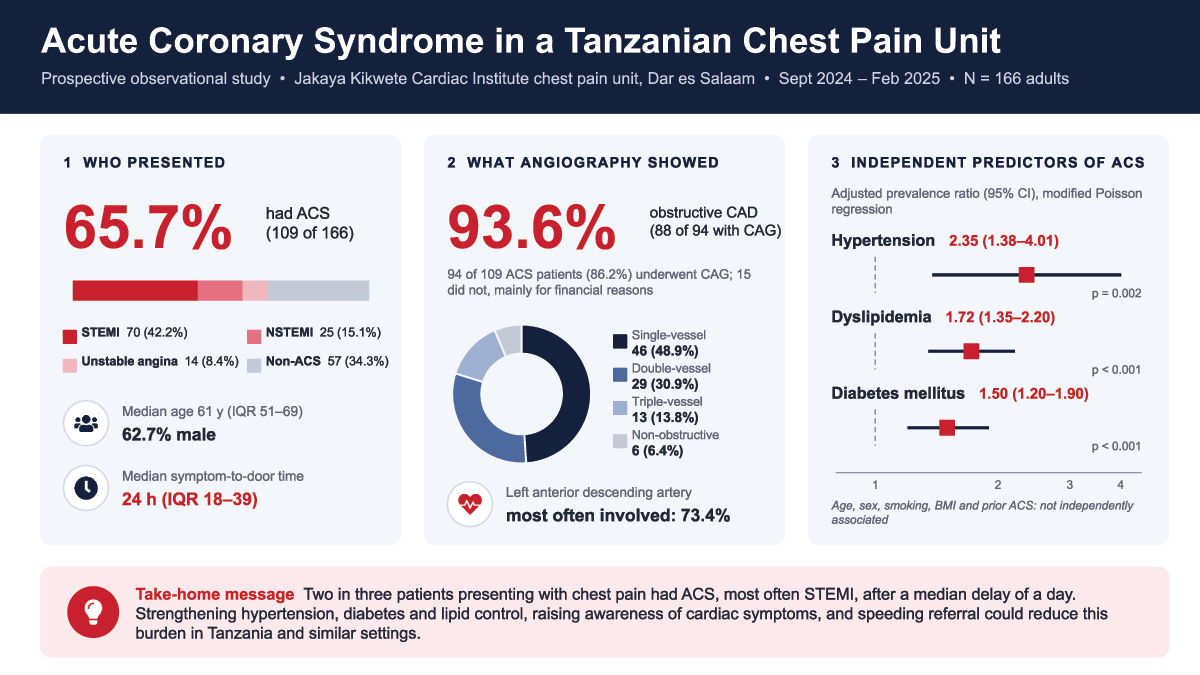
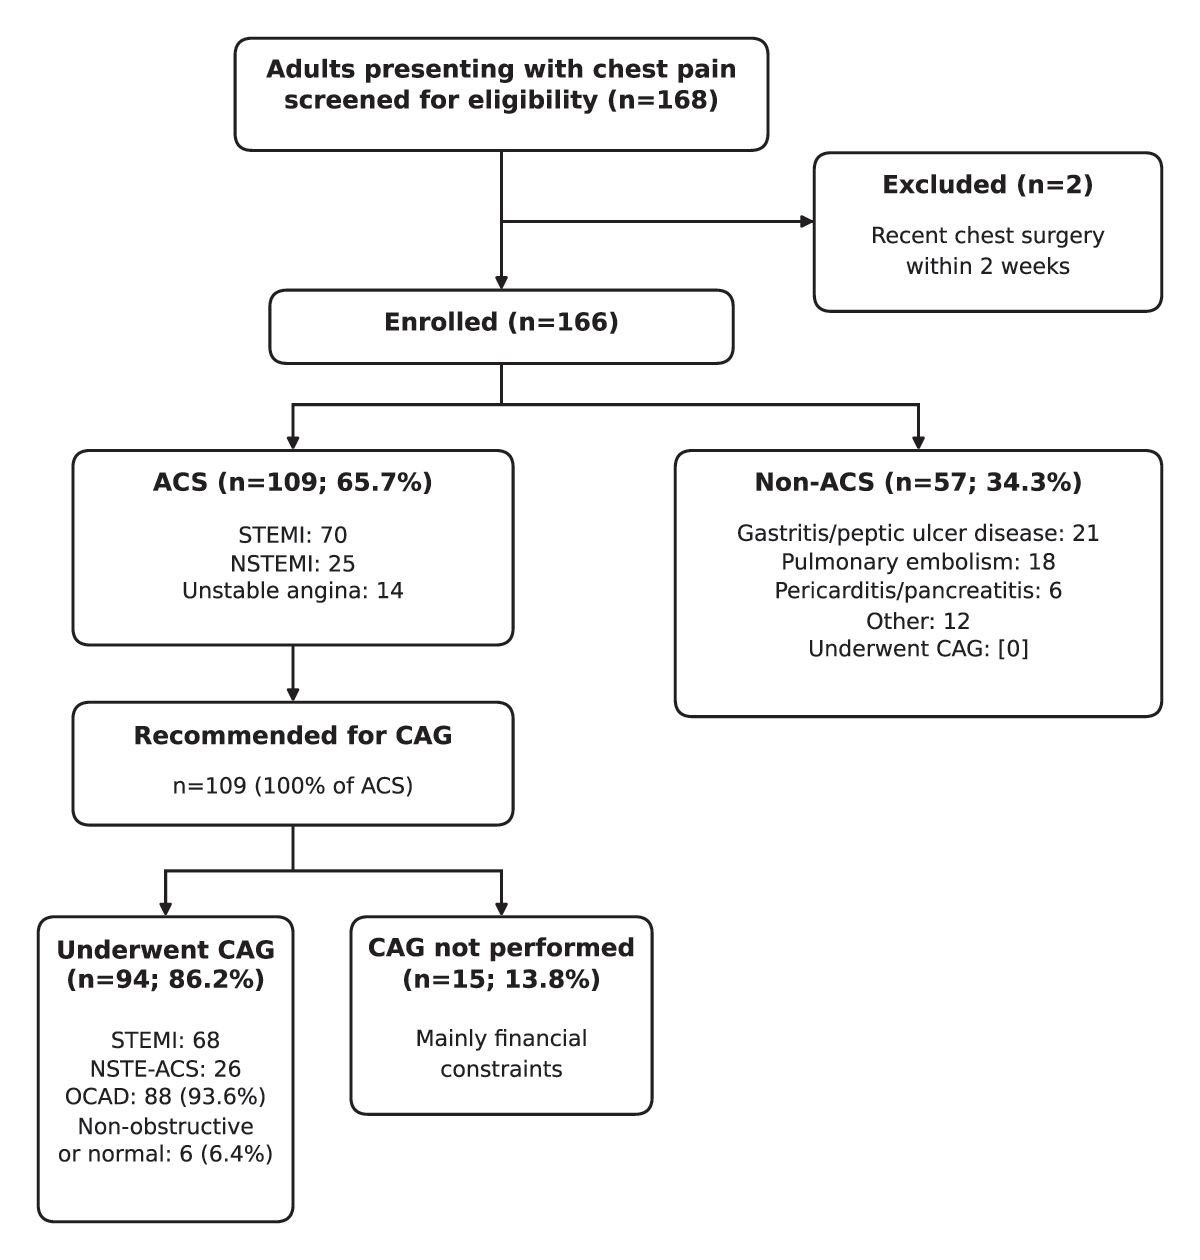
Figure 1
Flow diagram of patient screening, exclusions, final diagnostic categories, and coronary angiography.
Table 1
Sociodemographic characteristics of patients with chest pain attending chest pain unit at JKCI, N = 166.
| VARIABLES | n (%) |
|---|---|
| Demographic Characteristics | |
| Age, median (IQR) | 61 (51–69) |
| Age, mean ± SD | 60.1 ± 12.6 |
| Age group in years, n (%) | |
| >65 | 71 (42.8) |
| 45–64 | 76 (45.8) |
| <45 | 19 (11.4) |
| Sex, n (%) | |
| Male | 104 (62.7) |
| Female | 62 (37.3) |
| Insurance, n (%) | |
| Yes | 120 (72.3) |
| No | 46 (27.7) |
| Education level, n (%) | |
| No formal education | 1 (0.6) |
| Primary | 29 (17.5) |
| Secondary | 34 (20.5) |
| Tertiary and above | 102 (61.4) |
| Comorbidities/risk factors | |
| Hypertension | |
| Yes | 126 (75.9) |
| No | 40 (24.1) |
| Diabetes mellitus | |
| Yes | 80 (48.2) |
| No | 86 (51.8) |
| Dyslipidemias | |
| Yes | 79 (47.6) |
| No | 87 (52.4) |
| BMI category | |
| Normal (18.5–24.9 kg/m²) | 58 (34.9) |
| Overweight (25.0–29.9 kg/m²) | 63 (38) |
| Obese (≥30.0 kg/m²) | 45 (27.1) |
| Smoking/tobacco use | |
| Current/past | 35 (21.1) |
| Never | 131 (78.9) |
Table 2
Clinical and laboratory characteristics of patients with chest pain attending chest pain unit at JKCI, N = 166.
| VARIABLES | |
|---|---|
| Clinical history | n (%) |
| Chest pain characteristic | |
| Cardiac | 95 (57.2) |
| Non-cardiac | 71 (42.8) |
| Onset to presentation in hours, median (IQR) | 24 (18–39) |
| Previous history of ACS, n (%) | |
| Yes | 7 (4.2) |
| No | 159 (95.8) |
| Family history of CVD, n (%) | |
| Yes | 15 (9) |
| No | 151 (91) |
| HEART score, n (%) | |
| 0–3 | 47 (28.3) |
| 4–6 | 20 (12.0) |
| 7–10 | 99 (59.6) |
| Clinical examination | Median (IQR) |
| Systolic blood pressure (mmHg) | 125 (111–145.25) |
| Diastolic blood pressure (mmHg) | 75 (66.75–84) |
| Pulse rate (b/min) | 81 (73–94.25) |
| Anthropometric measurement | Median (IQR) |
| Weight (kg) | 75 (70–80) |
| Height (cm) | 166 (160–170) |
| Laboratory investigation | Median (IQR) |
| hs-cTnI (ng/L)a | 84.7 (6.51–1688.38) |
| Total cholesterol (mmol/l) | 4.5 (3.9–5.87) |
| LDL (mmol/l) | 3.1 (2.4–3.9) |
| HDL (mmol/l) | 1.19 (1.02–1.3) |
| Random blood glucose (mmol/l) | 10.2 (7.6–15.28) |
| Serum creatinine (micromol/l) | 95.32 (77–124.12) |
| BUN (mmol/l) | 4.99 (3.63–7.71) |
[i] a Normal range ≤40 ng/L (99th-percentile upper reference limit).
Table 3
Spectrum of diagnoses among patients presenting with chest pain at the JKCI chest pain unit (N = 166).aIncludes musculoskeletal and non-specific chest pain.
| DIAGNOSTIC CATEGORY | n (%) |
|---|---|
| ACS (total) | 109 (65.7) |
| STEMI | 70 (42.2) |
| NSTEMI | 25 (15.1) |
| Unstable angina | 14 (8.4) |
| Non-ACS (total) | 57 (34.3) |
| Pulmonary embolism | 18 (10.8) |
| Gastritis/peptic ulcer disease | 21 (12.7) |
| Pericarditis/pancreatitis | 6 (3.6) |
| Othersa | 12 (7.2) |
Table 4
Angiographic profile of patients presenting with chest pain at JKCI chest pain unit.
| ACS | |||
|---|---|---|---|
| ALL ACS (N = 94) | STEMI (N = 68) | NSTE-ACS (N = 26) | |
| Distribution of the coronary artery involved | |||
| OCAD, n (%)a | 88 (93.6) | 67 (98.5) | 21 (80.8) |
| SVD, n (%) | 46 (48.9) | 34 (50.0) | 12 (46.2) |
| DVD, n (%) | 29 (30.9) | 23 (33.8) | 6 (23.1) |
| TVD, n (%) | 13 (13.8) | 10 (14.7) | 3 (11.5) |
| Non-OCAD, n (%) | 6 (6.4) | 1 (1.5) | 5 (19.2) |
| Type of coronary artery involved | |||
| LM, n (%) | 5 (5.3) | 4 (5.9) | 1 (3.8) |
| LAD, n (%) | 69 (73.4) | 53 (77.9) | 16 (61.5) |
| LCX, n (%) | 28 (29.8) | 21 (30.9) | 7 (26.9) |
| RCA, n (%) | 42 (44.7) | 33 (48.5) | 9 (34.6) |
[i] a≥70% luminal stenosis in a major epicardial coronary artery or ≥50% stenosis in the left main coronary artery.
Table 5
Modified Poisson regression analysis for factors associated with ACS among patients with chest pain who attended the JKCI chest pain unit.
| VARIABLES | ACS, n (%) | UNIVARIABLE cPR (95% CI) | p-VALUE | MULTIVARIABLEa aPR (95% CI) | p-VALUEb |
|---|---|---|---|---|---|
| Sex | |||||
| Female | 37 (59.7) | Ref | |||
| Male | 72 (69.2) | 1.16 (0.91–1.48) | 0.23 | 1.11 (0.93–1.32) | 0.27 |
| Age group | |||||
| <45 | 9 (50) | Ref | |||
| 45–64 | 50 (64.1) | 1.28 (0.79–2.1) | 0.32 | 0.84 (0.53–1.34) | 0.47 |
| >65 | 50 (71.4) | 1.43 (0.88–2.32) | 0.15 | 0.85 (0.56–1.30) | 0.45 |
| Hypertension | |||||
| No | 10 (25) | Ref | |||
| Yes | 99 (78.6) | 3.14 (1.82–5.42) | <0.001 | 2.35 (1.38–4.01) | 0.002 |
| Smoking/tobacco use | |||||
| No | 80 (61.1) | Ref | |||
| Current/past | 29 (82.9) | 1.36 (1.11–1.66) | 0.003 | 1.08 (0.87–1.34) | 0.48 |
| Diabetes mellitus | |||||
| No | 36 (41.9) | Ref | |||
| Yes | 73 (91.3) | 2.18 (1.68–2.82) | <0.001 | 1.50 (1.20–1.90) | <0.001 |
| Previous history of ACS | |||||
| No | 102 (64.2) | Ref | |||
| Yes | 7 (100) | 1.56 (1.39–1.75) | <0.001 | 1.28 (0.94–1.73) | 0.11 |
| Dyslipidemia | |||||
| No | 35 (40.2) | Ref | |||
| Yes | 74 (93.7) | 2.33 (1.79–3.03) | <0.001 | 1.72 (1.35–2.20) | <0.001 |
| BMI status | |||||
| Normal | 37 (63.8) | Ref | |||
| Overweight | 43 (68.3) | 1.07 (0.83–1.38) | 0.61 | 0.89 (0.72–1.09) | 0.27 |
| Obese | 29 (64.4) | 1.01 (0.76–1.35) | 0.95 | 0.85 (0.69–1.06) | 0.15 |
[i] aAdjusted for age group, sex, smoking or tobacco use, hypertension, diabetes mellitus, dyslipidemia, BMI category, and previous history of ACS.
bBold values indicate p < 0.05.
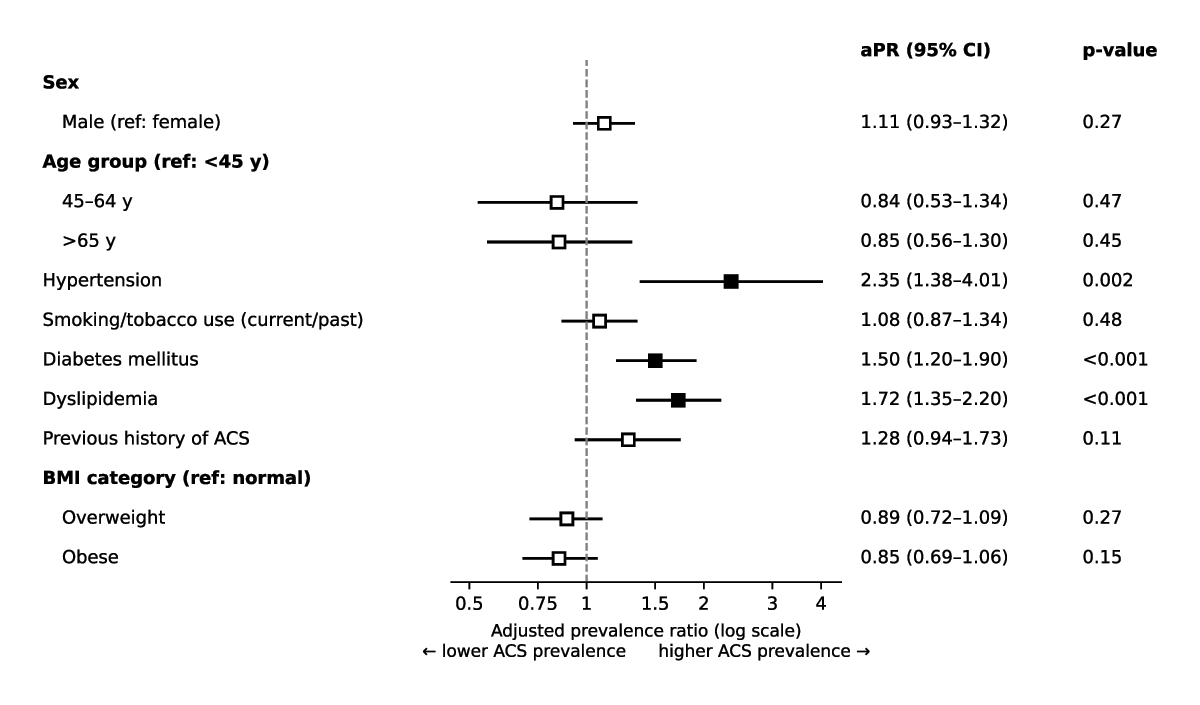
Figure 2
Forest plot of aPR with 95% confidence intervals for factors associated with ACS in the multivariable modified Poisson regression model (N = 166).a, b
aThe dashed vertical line indicates no association (aPR = 1.0); the horizontal axis is log-scaled.
bFilled squares indicate p < 0.05.