
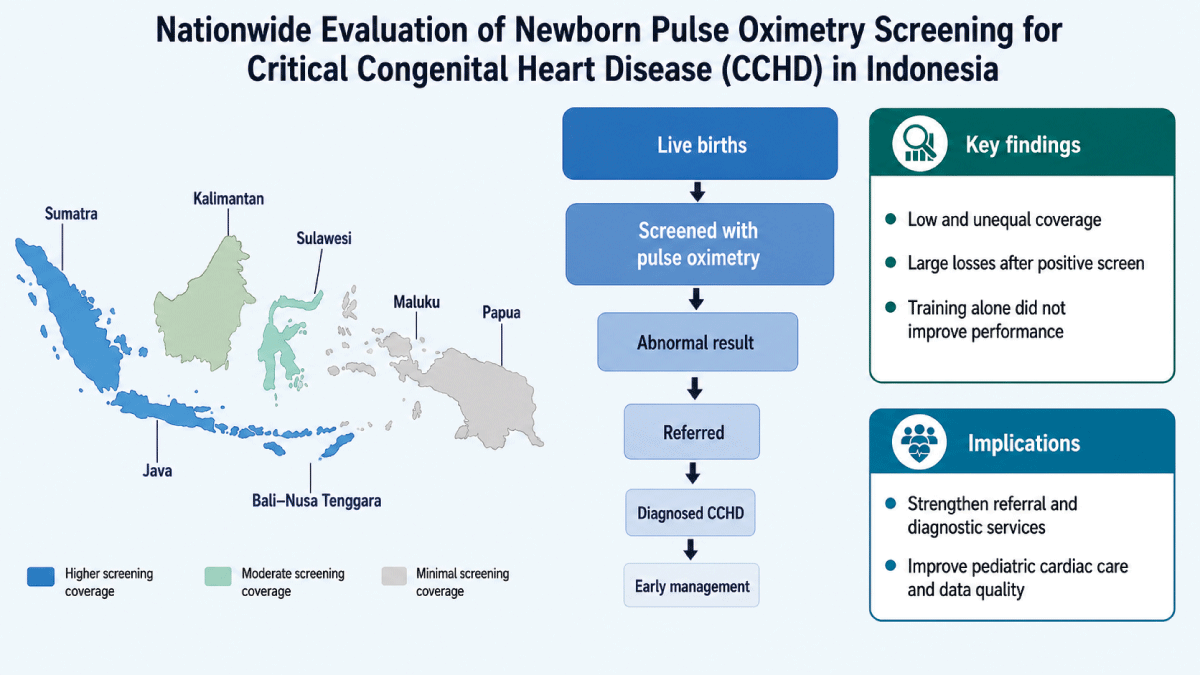
Table 1
National newborn CCHD screening cascade volumes and median provincial coverage in Indonesia, 2024 and January–May 2025.
| INDICATOR | 2024 TOTAL, n | 2025 TOTAL, n* |
|---|---|---|
| Live births (n_bbl) | 4,591,122 | 2,166,946 |
| Newborns screened (n_skrining) | 1,645,706 | 584,460 |
| Abnormal screening results (n_positifgagal) | 1,756 | 873 |
| Second screenings completed (n_skrining2) | 1,482 | 706 |
| CHD diagnoses (n_chd) | 524 | 332 |
| Confirmed CCHD cases (n_cchd) | 273 | 210 |
| Early management provided (n_earlym) | 261 | 228 |
| Deaths among confirmed CHD/CCHD (n_death)† | 4,873 | 20 |
| Lost to follow-up among confirmed CHD/CCHD (n_lfu) | 58,446 | 0 |
| Median provincial screening coverage, % | 21.8 | 8.6 |
[i] *2025 data represent January–May only; reporting completeness varies by province.
†Deaths reflect all reported deaths among infants with CHD in the cascade, not necessarily limited to CCHD.
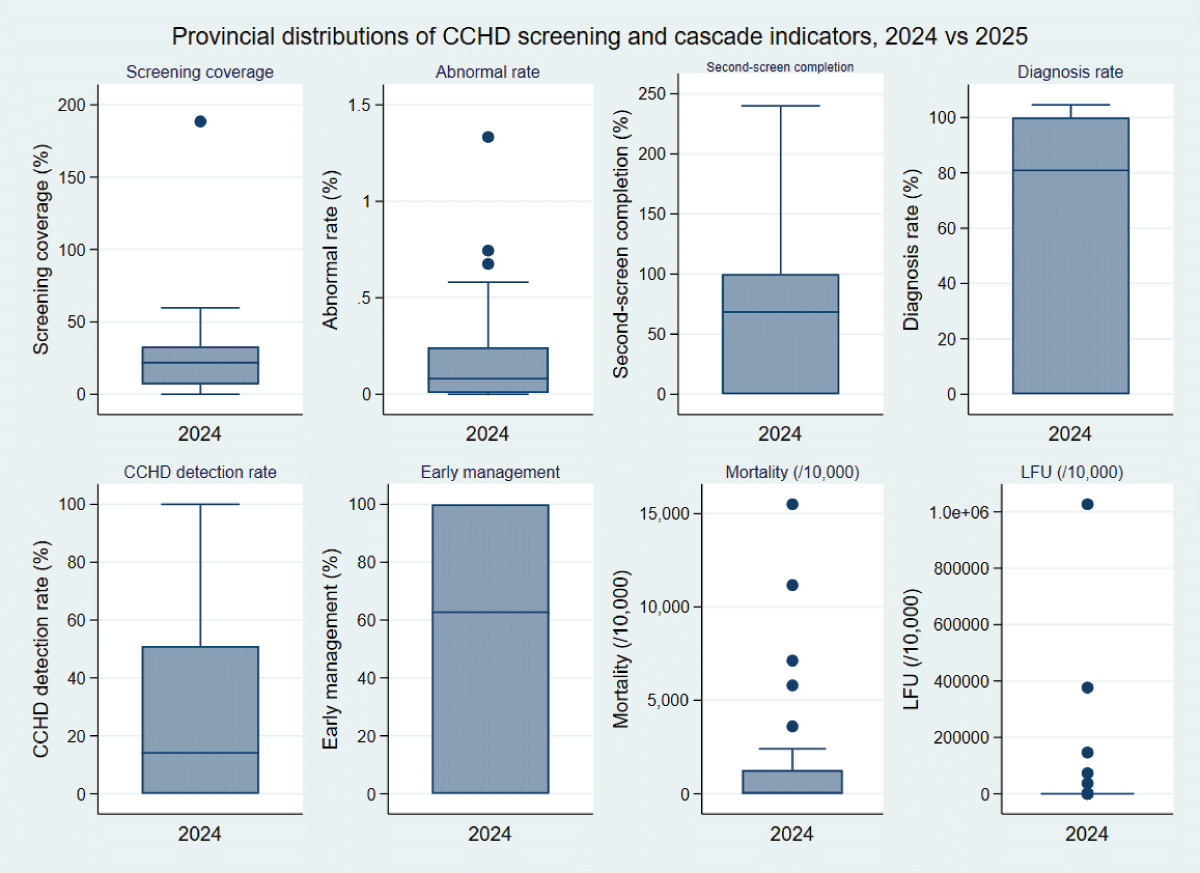
Figure 1
Provincial distributions of CCHD screening coverage, cascade completion, and outcomes in Indonesia, 2024 and January–May 2025.
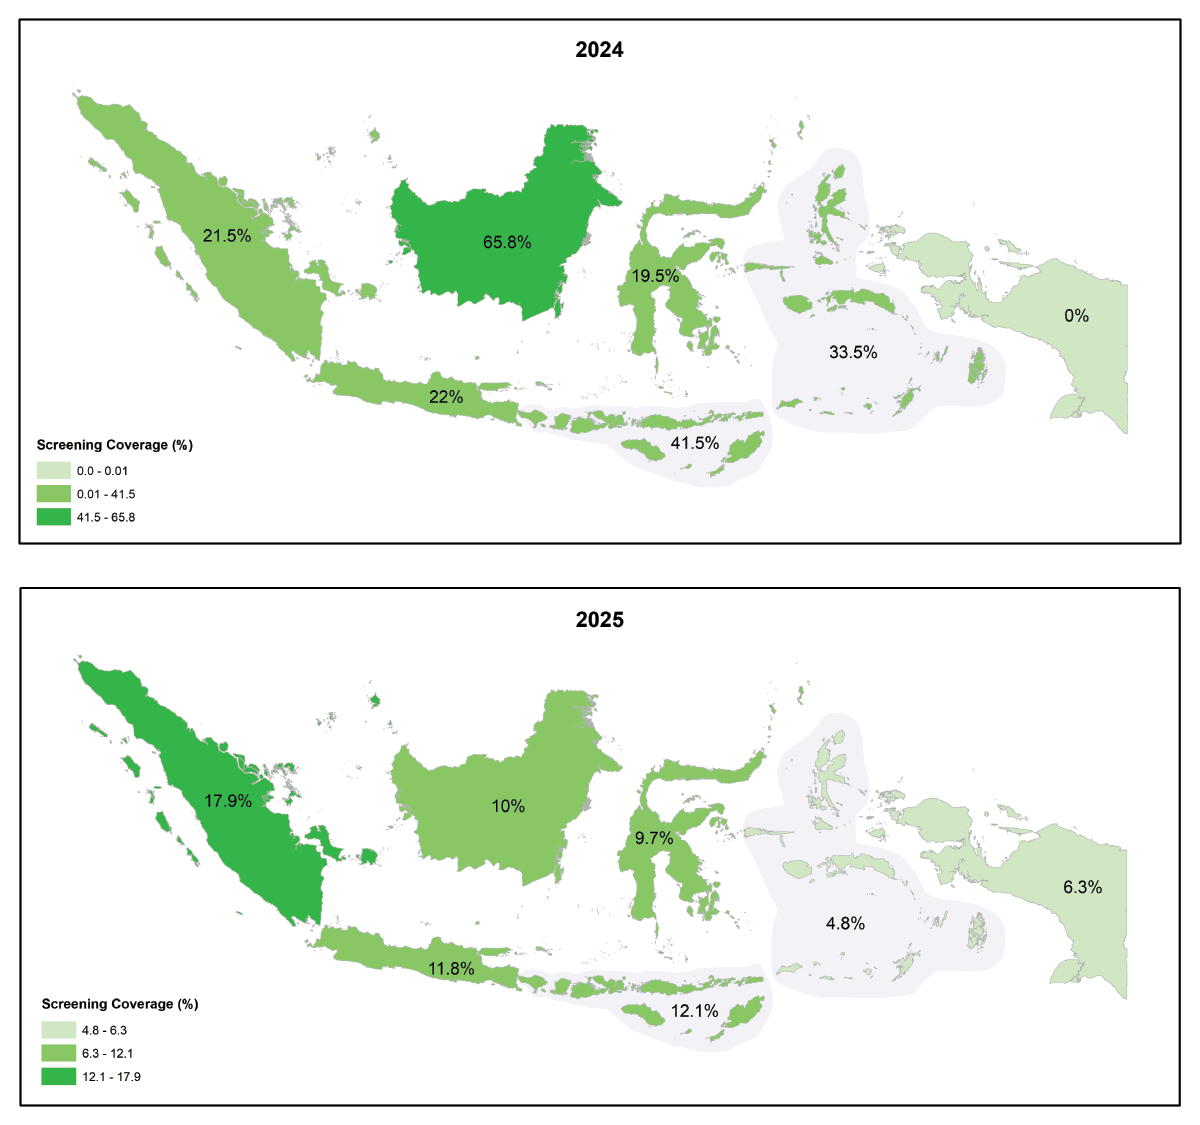
Figure 2
Regional mean screening coverage for newborn CCHD screening in Indonesia, 2024 and January–May 2025.
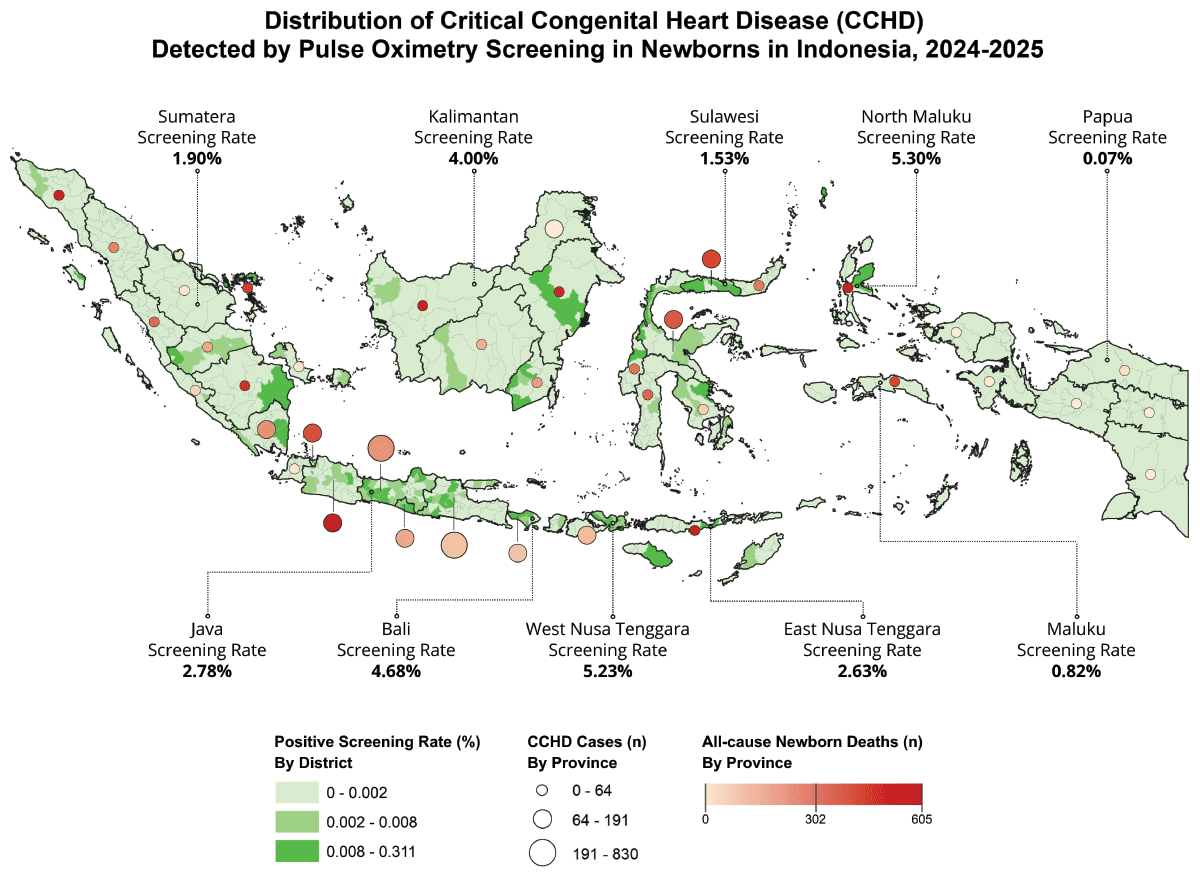
Figure 3
Spatial distribution of CCHD detections and deaths among infants with congenital heart disease in Indonesia.
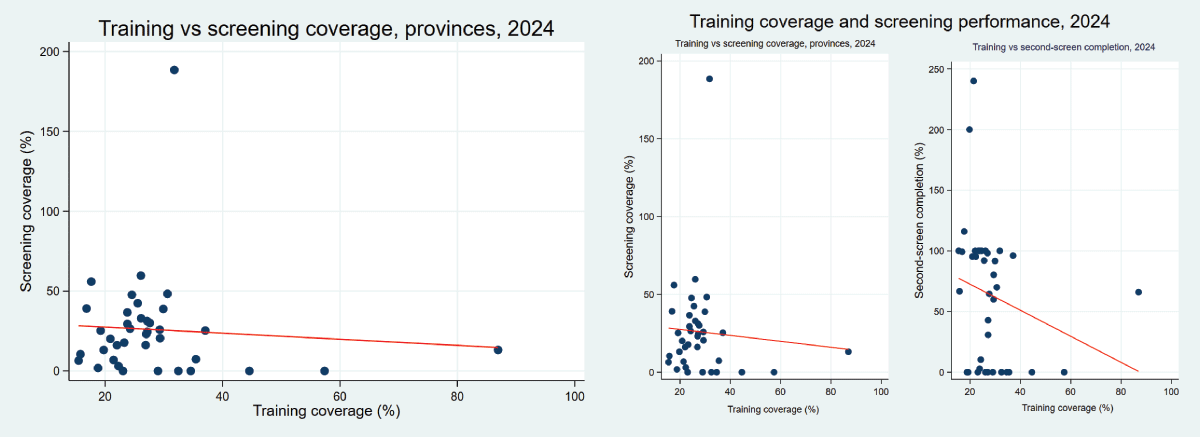
Figure 4
Pairwise correlations between training coverage and screening cascade indicators across provinces, Indonesia, 2024.
Table 2
Linear regression models assessing the association between training coverage and provincial screening coverage in Indonesia, 2024–2025.
| MODEL | PREDICTOR | β COEFFICIENT | 95% CI | p-VALUE |
|---|---|---|---|---|
| Unadjusted | Training coverage (%) | –0.191 | –1.040 to 0.658 | 0.651 |
| Adjusted for region | Training coverage (%) | 0.036 | –0.841 to 0.913 | 0.934 |
| Region (overall effect)* | 0.046 |
[i] *The overall effect for region reflects joint significance across all regional categories based on F-test results.