
Introduction
Cardiovascular (CV) disease is the leading cause of morbidity and mortality worldwide. Current global health policy goals include achieving a 25% reduction in premature mortality from noncommunicable diseases (NCDs) by 2025 (1).
There is a strong association between respiratory infections and acute CV events. All strains of influenza and Streptococcus pneumoniae infections can trigger a range of CV alterations that may lead to hospitalization or death (23456). Evidence has shown that influenza vaccination (IV) and pneumococcal vaccination (PV) are associated with reduced rates of several CV outcomes, including myocardial infarction (MI), heart failure (HF) hospitalization, and CV mortality (7891011121314151617).
Despite these benefits, several challenges limit the implementation of vaccination strategies. Barriers include patient-related factors (vaccine hesitancy, prior experiences, and misinformation), healthcare providers’ knowledge and attitudes toward vaccination, and healthcare system constraints. Collectively, these factors contribute to lower-than-expected immunization rates in Latin America and worldwide (18192021222324252627).
Despite efforts by the World Health Organization, governmental authorities, and health leaders across many countries to encourage compliance with vaccination recommendations, uptake remains low. Currently, there is no accurate information on vaccination rates among patients undergoing primary or secondary prevention of cardiometabolic diseases in the Americas (28).
In 2021, the Inter-American Society of Cardiology (SIAC) developed a research project evaluating the status of cardiometabolic patients without COVID-19 infection during the pandemic, including their immunization profile against influenza (IV) and pneumococcus (PV) (29). The global vaccination rates reported were lower than expected: IV 46.5% (n = 1963), PV 24.6% (n = 1039), and dual vaccination 21% (n = 887). In a multivariate model, predictors for vaccination included geographic region (IV: OR 2.02, PV: OR 2.42, p < 0.001), age (IV: OR 1.023, PV: OR 1.035, p < 0.001), and income (IV: OR 1.28, PV: OR 1.58, p < 0.001) (29).
Public health strategies based on an understanding of the epidemiological realities of each region and country in Latin America are essential to effectively address the barriers to implementing cardiovascular prevention projects based on vaccination. The CorVacc Study provides, for the first time, comprehensive and detailed information on the barriers and challenges facing Latin American health systems in vaccination. Ministries of health, funders, and scientific societies will have access to validated information to objectively support their policies and actions.
The objective of the present study was to determine influenza and pneumococcal vaccination rates in the general population of the Americas—both healthy and with comorbidities—and to analyze the factors influencing these rates.
Methods, Design, and Statistics
Study population
Observational study
A total of 19 countries were prospectively included in the Inter-American Registry of Vaccination against Influenza and Pneumococcus (CorVacc Study). Outpatients over 18 years of age who provided informed consent were included. Patients unable to provide consent were excluded.
Informed consent
Participants were informed about the survey’s objective and the anonymity of their responses. No identifiable personal data were collected. Ethics approval was obtained from the SIAC Research Ethics Board.
Study design
A 34-question cross-sectional online survey was developed using Google Forms (Mountain View, CA). Patients were invited to complete the questionnaire either in person or via email, social media, phone calls, or paper questionnaires.
The survey was divided into three sections:
Demographic profile
Cardiovascular risk profile
Vaccination profile
The questionnaire included various question formats, such as dichotomous, Likert-type, multiple-choice, and open-ended responses. Respondents were required to answer every question and could select multiple responses when applicable the questionnaire could not be submitted until all the questions were answered. The validity and reliability of the survey were assessed using Cronbach’s coefficient and exploratory factor analysis (Appendix).
Study organization
Cardiologists and other physicians across Latin America were invited to collaborate on the CorVacc Study. Ultimately, 19 countries were represented by cardiologists who agreed to participate. The countries were grouped according to a pre-established geographic distribution (Appendix, Figure 1), and the following number of records was retrieved per region:
North, Central, and Caribbean region (NCC): México, Guatemala, El Salvador, Honduras, Nicaragua, Costa Rica, Panamá, Cuba, Puerto Rico, and Dominican Republic.
Andean region (AR): Venezuela, Colombia, Ecuador, Bolivia, and Perú.
Southern Cone region (SCR): Paraguay, Chile, Uruguay, Brazil, and Argentina.
Statistical analysis
Continuous variables were presented as mean (standard deviation) if normally distributed, and as median (interquartile range) if they did not follow a normal distribution. Normality of distribution was assessed with Shapiro-Wilk and Kolmogorov-Smirnov tests. The unpaired Student T-test or Mann–Whitney U test were used to compare the continuous variables between people with and without vaccination, as appropriate (Figure 1). Categorical variables were expressed as percentages and compared between individuals with and without vaccination using the Pearson χ2 test. Logistic binary regression model was used to model the relationship between different variables and vaccination. All statistical analyses were performed using SPSS for Windows, version 29.0 (IBM Armonk, NY, USA), and a two-tailed p-value < 0.05 was considered statistically significant.

Figure 1
Variables that influence a greater probability of not receiving each of the vaccines.
The total population within Latin American countries is estimated to be approximately 662 million. A sample size of 20,000 surveys was calculated to achieve a margin of error of 5%, a confidence level of 90%, and an error of distribution of 50%.
Survey
A survey platform was created for patient enrollment. To improve the response rate, periodic reminders were sent by mail, text message, or social media. In addition, information on the evolution of the surveys by country was made available. The survey consists of 34 questions (Appendix, Table 1), which has been published in the Mexican Archives of Cardiology, Immunization and cardiovascular disease in Latin America. The CorVacc study: rationale and design (30).
Results
A total of 21,389 responses were obtained, distributed as follows: 8915 from the North, Central, and Caribbean region; 7492 from the Andean region; and 4801 from the Southern Cone region. Baseline characteristics are reported in Table 1.
Table 1
Baseline characteristics of the sample.
| INFLUENZA VACCINE | PNEUMOCOCCUS | SARS CoV-2 | |||||
|---|---|---|---|---|---|---|---|
| N | % | N | % | N | % | ||
| Vaccinated | 15,871 | 74.2% | 7,657 | 35.8% | 20,726 | 96.9% | |
| Gender | Female | 6,943 | 63.8% | 4,751 | 62.2% | 12,686 | 61.2% |
| Male | 3,946 | 36.2% | 2,882 | 37.8% | 8,049 | 38.8% | |
| Region | North America | 822 | 7.5% | 492 | 6.4% | 1,115 | 5.4% |
| Andean | 3,756 | 34.4% | 2,611 | 34.1% | 7,231 | 34.8% | |
| Brazil | 740 | 6.8% | 320 | 4.2% | 1,092 | 5.3% | |
| Caribbean | 1,081 | 9.9% | 909 | 11.9% | 3,324 | 16.0% | |
| Central America | 2,223 | 20.4% | 1,818 | 23.8% | 4,358 | 21.0% | |
| South Cone | 2,284 | 20.9% | 1,498 | 19.6% | 3,645 | 17.6% | |
| Job position | Retired | 2,820 | 25.9% | 2,056 | 26.9% | 5,231 | 25.2% |
| Formal worker | 5,503 | 50.5% | 3,724 | 48.7% | 9,946 | 47.9% | |
| Informal worker | 2,583 | 23.7% | 1,868 | 24.4% | 5,588 | 26.9% | |
| Residence | Rural | 1,055 | 9.7% | 753 | 9.8% | 1,885 | 9.1% |
| >500,000 inhabitants | 3,956 | 36.3% | 2,736 | 35.8% | 7,299 | 35.2% | |
| 100,000 to 500,000 inhabitants | 1,886 | 17.3% | 1,360 | 17.8% | 3,522 | 17.0% | |
| <100,000 inhabitants | 1,693 | 15.5% | 1,144 | 15.0% | 3,110 | 15.0% | |
| Education level | None | 62 | 0.6% | 42 | 0.5% | 105 | 0.5% |
| Primary school | 401 | 3.7% | 236 | 3.1% | 927 | 4.5% | |
| College | 1,573 | 14.4% | 1,087 | 14.2% | 3,617 | 17.4% | |
| University/Technician | 8,870 | 95.8% | 6,283 | 96.4% | 16,116 | 4.9% | |
| Income (US dollars) | <499 | 2,777 | 25.5% | 2,270 | 29.7% | 6,173 | 29.7% |
| 500–999 | 2,335 | 21.4% | 1,542 | 20.2% | 4,338 | 20.9% | |
| 1,000–1,499 | 1,831 | 16.8% | 1,095 | 14.3% | 3,158 | 15.2% | |
| 1,500–1,999 | 1,044 | 9.6% | 755 | 9.9% | 1,833 | 8.8% | |
| 2,000–2,499 | 843 | 7.7% | 575 | 7.5% | 1,453 | 7.0% | |
| 2,500–2,999 | 612 | 5.6% | 424 | 5.5% | 1,060 | 5.1% | |
| >3000 | 1,464 | 13.4% | 987 | 12.9% | 2,750 | 13.2% | |
| Age | <20 | 264 | 2.4% | 300 | 3.9% | 851 | 4.1% |
| >80 | 217 | 2.0% | 143 | 1.9% | 376 | 1.8% | |
| 21–30 | 2,184 | 20.0% | 1,809 | 23.7% | 4,012 | 19.3% | |
| 31–40 | 2,168 | 19.9% | 1,463 | 19.1% | 3,803 | 18.3% | |
| 41–50 | 1,893 | 17.4% | 1,177 | 15.4% | 3,735 | 18.0% | |
| 51–60 | 1,828 | 16.8% | 1,120 | 14.6% | 3,829 | 18.4% | |
| 61–70 | 1,645 | 15.1% | 1,094 | 14.3% | 2,953 | 14.2% | |
| 71–80 | 707 | 6.5% | 542 | 7.1% | 1,206 | 5.8% | |
| >80 | 217 | 2.0% | 143 | 1.9% | 376 | 1.8% | |
| Hypertension | 2,915 | 26.7% | 1,905 | 24.9% | 5,442 | 26.2% | |
| Obesity | 2,447 | 22.4% | 1,607 | 21.0% | 4,050 | 19.5% | |
| COPD | 387 | 3.5% | 325 | 4.2% | 601 | 2.9% | |
| Dyslipidemia | 1,649 | 15.1% | 1,049 | 13.7% | 2,907 | 14.0% | |
All three vaccines demonstrated consistent associations with age, sex, educational level, occupation, and type of health service. Higher age, higher educational attainment, and professional occupation were linked to a greater likelihood of vaccination, with the strongest effect observed for SARS-CoV-2 vaccination. Women reported higher vaccination rates compared to men. The Southern Cone and North American regions showed the highest vaccination coverage. Some comorbidities—such as dyslipidemia, immunosuppression, and COPD—did not show a statistically significant association with influenza or pneumococcal vaccination, despite their clinical relevance as risk factors.
Influenza vaccination model
The probability of being vaccinated against influenza was higher in men (OR: 1.3; 95% CI: 1.1–1.6) and in individuals with obesity (OR: 1.26; 95% CI: 1.13–1.40). Age also showed a positive effect (OR: 1.08 per 10 years; 95% CI: 1.06–1.11). Health personnel had a substantially higher likelihood of vaccination (OR: 3.57; 95% CI: 3.14–4.05), whereas being a non-health-related professional was associated with lower coverage (OR: 0.65; 95% CI: 0.58–0.73). Graduate-level education was linked to a lower probability of vaccination (OR: 0.42; 95% CI: 0.27–0.65), with no significant differences observed for other educational levels.
No significant association was found with COPD (OR: 1.06; 95% CI: 0.81–1.38) or dyslipidemia (OR: 0.95; 95% CI: 0.85–1.07). Geographically, vaccination rates were lower in the Andean region (OR: 0.62; 95% CI: 0.50–0.78), the Caribbean (OR: 0.30; 95% CI: 0.23–0.39), and Central America (OR: 0.59; 95% CI: 0.46–0.76) compared with the Southern Cone. Access to social security (OR: 1.40; 95% CI: 1.27–1.54) or care at the Ministry of Health (OR: 1.28; 95% CI: 1.17–1.40) was associated with higher vaccination coverage (Figure 2).
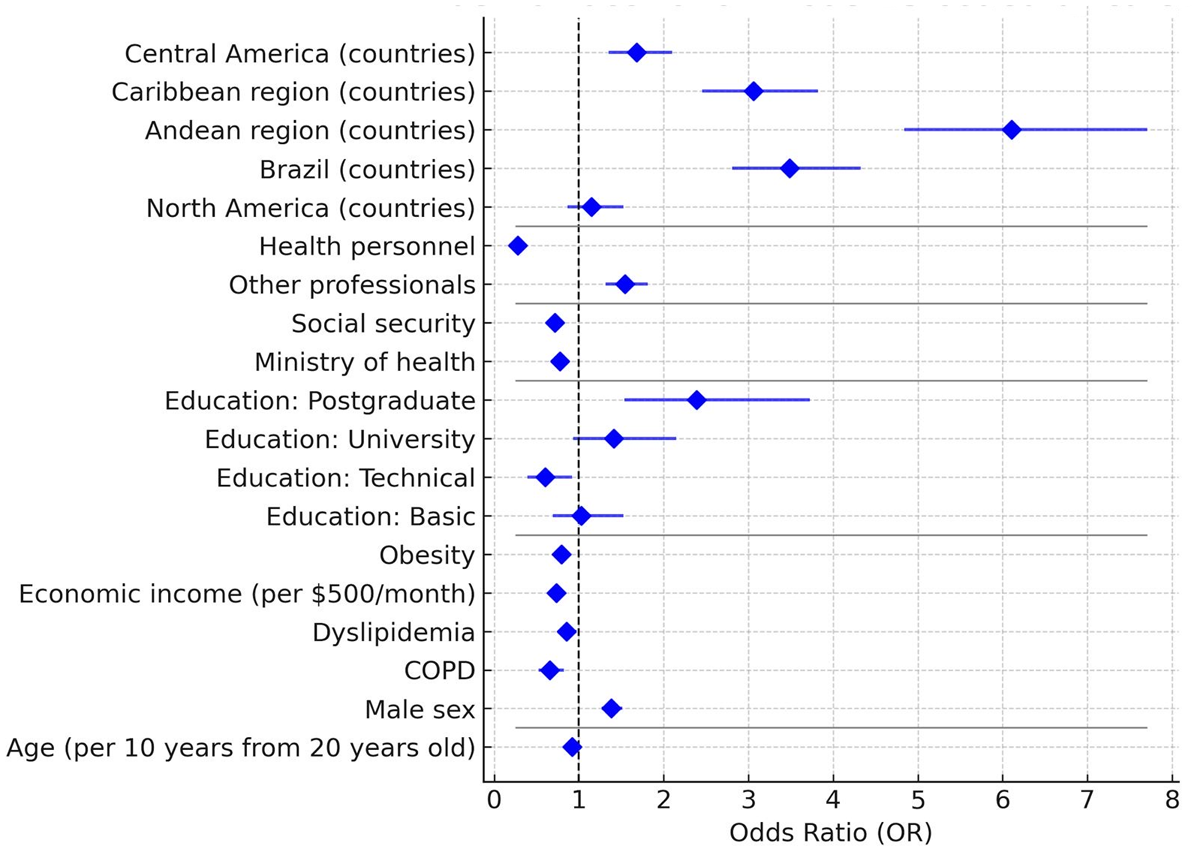
Figure 2
Forest Plot—Factors associated with influenza vaccination.
Pneumococcal vaccination model
Older age was associated with a higher likelihood of vaccination (OR: 1.018 per 10 years; 95% CI: 1.002–1.036). Living with a partner (OR: 1.41; 95% CI: 1.09–1.83), being health personnel (OR: 1.99; 95% CI: 1.83–2.16), and accessing care through social security services (OR: 1.33; 95% CI: 1.17–1.49) or ministries of health (OR: 1.89; 95% CI: 1.68–2.12) were all associated with a higher probability of vaccination. Being a professional was also positively associated (OR: 1.18; 95% CI: 1.07–1.30).
Unlike the influenza model, none of the educational levels were significant predictors. COPD, however, was associated with a lower probability of vaccination (OR: 0.51; 95% CI: 0.33–0.79). Regionally, North America (OR: 0.64; 95% CI: 0.54–0.77) and Brazil (OR: 0.68; 95% CI: 0.59–0.77) demonstrated lower coverage compared with the Southern Cone (Figure 3).
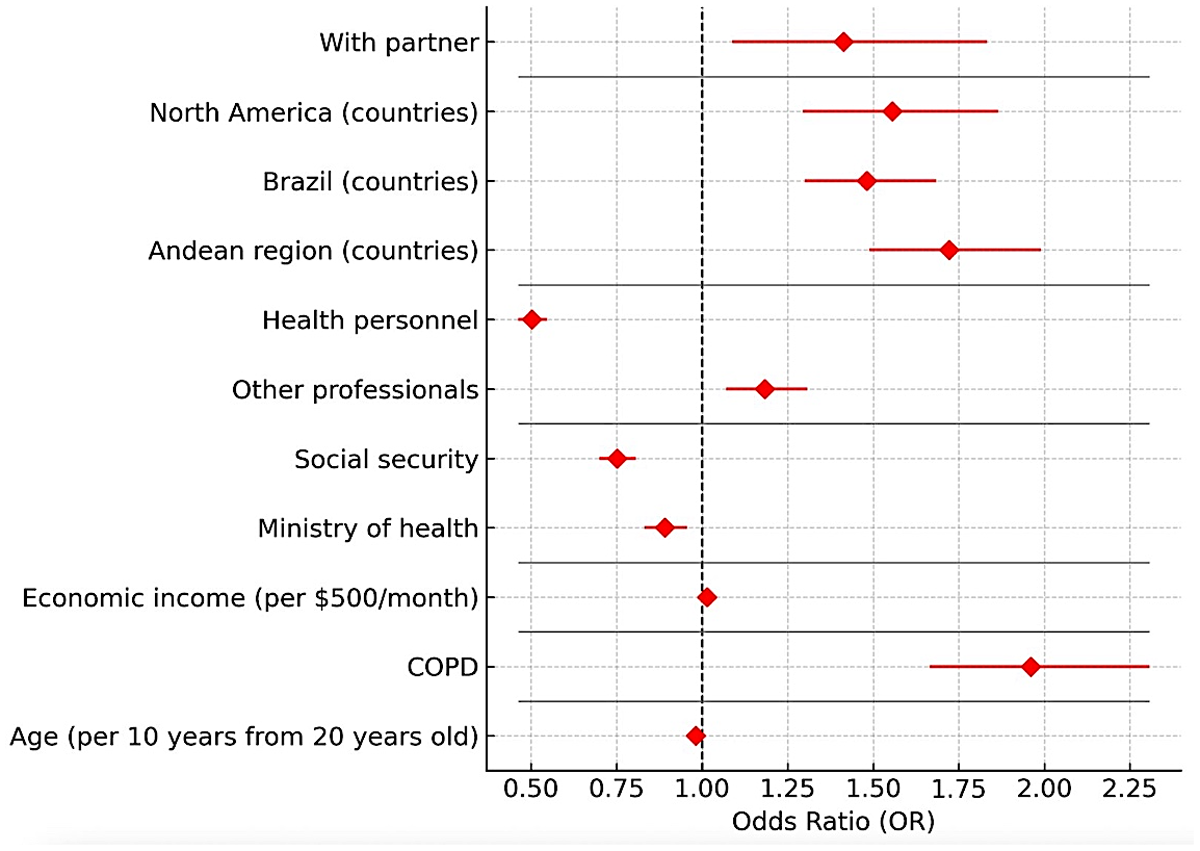
Figure 3
Forest Plot—Factors associated with pneumococcal vaccination.
SARS CoV-2 vaccination model
Every 10-year increase in age was associated with a higher likelihood of vaccination (OR: 1.058; 95% CI: 1.017–1.101). Educational attainment also showed strong positive associations compared with no schooling: basic (OR: 3.41; 95% CI: 2.18–4.59), technical (OR: 6.37; 95% CI: 3.37–12.02), university (OR: 5.67; 95% CI: 4.00–8.07), and postgraduate (OR: 9.70; 95% CI: 5.09–18.47). Being a health worker was linked to a higher probability of vaccination (OR: 2.23; 95% CI: 1.83–2.71).
Regional differences were also observed: compared with the Southern Cone, residing in North America (OR: 4.62; 95% CI: 2.28–10.16) or Central America (OR: 3.06; 95% CI: 1.62–5.77) was associated with greater vaccination coverage. Access to healthcare services played a role as well—receiving care through ministries of health (OR: 1.53; 95% CI: 1.12–1.63) or having no formal medical services (OR: 2.85; 95% CI: 1.94–4.19) were both linked to higher coverage.
Comorbidities such as arterial hypertension (OR: 1.56; 95% CI: 1.22–1.78) and COPD (OR: 1.57; 95% CI: 1.12–2.25) were also positively associated with vaccination (Figure 4).

Figure 4
Forest Plot—Factors associated with COVID-19 vaccination.
Analysis and Discussion
The CorVacc Study surveyed 21,389 participants across 19 Latin American countries to evaluate vaccination rates against influenza, pneumococcus, and COVID-19. Vaccination rates were lower than expected for influenza and pneumococcus infection prevention. These data were influenced by multiple factors, including age, sex, educational level, occupation, and type of health service. Older individuals, those with higher educational attainment, and healthcare personnel were more likely to be vaccinated. Women reported higher vaccination rates compared to men. The Southern Cone and North–Central American regions demonstrated the highest vaccination coverage.
The CorVacc Study could have relevant implications for Latin-American health systems and practitioners. This observational study could help to identify under vaccinated populations, understand vaccination patterns, attitudes and behaviors toward vaccination, and hesitancy and challenges to vaccination that could improve vaccines coverage and vaccination rates.
A random-digit–dialed cellular telephone survey of US adults estimated by December 2023 that 42.2% of adults aged >18 years received influenza vaccine and 18.3% the updated 2023–2024 COVID-19 vaccine. These rates were even lower than in CorVacc Study. The percentage of persons reporting that they probably or definitely will not get an influenza vaccination oscillated between 24% and 32.2% depending on race and ethnicity. At the same time, 31.3% to 43.2% of the surveyed answered that they probably or definitely will not receive a COVID-19 vaccine. Coverage and living in urban or suburban areas increased the rates of vaccination. These data could guide planning, implementation, and strengthening vaccination activities (31).
A cross-sectional survey was conducted in 1556 adults with type 1 and type 2 diabetes mellitus between December 2023 and March 2025 attending endocrinology clinics across three sites in Saudi Arabia. A structured questionnaire evaluated vaccination awareness, uptake, and barriers. Uptake rates were 60.8% for influenza, 88.7% for COVID-19, and 27.1% for pneumococcal vaccines. Overall, 82.6% recognized the purpose of vaccination and 70.4% agreed that DM patients should be vaccinated. Healthcare providers were the main information source for influenza (45.6%) and pneumococcal vaccines (23.6%), while social media predominated for COVID-19 (49.1%). This study, again, shows in a high-risk population that vaccine uptake remains suboptimal although a reasonable awareness level (32).
The gap between influenza, pneumococcal, and COVID-19 vaccine uptake and willingness were evaluated in a nationwide cross-sectional survey conducted in China. The vaccination rate for COVID-19, influenza, in previous season, and pneumococcal was 85.86%, 22.44%, and 7.72%, while the willingness rates were 71.34%, 73.84%, and 47.41%, respectively. Age was positively associated with influenza but negatively with COVID-19. Chronic comorbidity was positively associated with pneumococcal vaccination but negatively associated with COVID-19. Females had higher vaccination rates for both influenza and COVID-19. Participants with higher education levels had higher vaccination rates across all types (33). In the CorVACC study the probability of being vaccinated against influenza was higher in men, obese subjects, aging, and higher accessibility and coverage. Older age was associated with a higher likelihood of pneumococcal vaccination. Aging, educational level, comorbidities, and accessibility increased the likelihood of COVID-19 vaccination. These data highlight that the phenotype of the individual most likely to receive vaccines depends on the presence of multiple covariates.
A machine-learning-assisted literature search on negative public sentiment toward vaccination. The research showed that the distribution was markedly imbalanced, largely shaped by country-specific economic factors. The authors concluded that these inequities reflect systematic imbalances in global health and the need to focus the agenda on the necessities of affected communities. In their opinion, this will require funding and publication reforms that promote equitable collaborations and elevate local priorities alongside long-standing global health objectives (34).
Limitations
This was an open, anonymous, and voluntary survey, which raises concerns about potential bias in the sample. Certain groups—such as individuals living in rural areas or small towns, or those with limited access to health services—may be underrepresented. The reported data are therefore based on survey responses across diverse healthcare access settings. Nevertheless, despite these limitations, the sample size exceeded expectations and provides meaningful insights into Latin American respondents’ beliefs, expectations, and perceptions of the feasibility of vaccination.
Conclusions
Latin America lacks epidemiological data related to influenza, pneumococcal, and COVID-19 vaccination. This information is essential for designing public health campaigns that promote vaccination. The CorVacc study is, to our knowledge, the first to describe the region’s health situation related to this issue. This information should be of paramount importance to public health authorities.
The study highlights the importance of implementing targeted vaccination campaigns to improve coverage, particularly in regions with lower rates. It also emphasizes the need for enhanced education and awareness of the benefits of vaccination among both healthcare providers and the general population. Overcoming barriers such as vaccine hesitancy, misinformation and coverage will be crucial to increasing vaccination uptake and, ultimately, reducing the burden of cardiovascular disease.
Appendices
Appendix
Table 1
Description of the questions included in the survey.
| QUESTIONS | POSSIBLE RESPONSES |
|---|---|
| Region | 1. North, Central America and the Caribbean 2. Andean 3. Southern Cone |
| Age | |
| Gender | 1. Female 2. Male 3. Transgender 4. Other |
| What perception do you have of your state of health? | Scale of 1–10 (Unhealthy to Very healthy) |
| Number of inhabitants city/town of residence | 1. <10,000 population 2. 10,000–100,000 population 3. 100,000–500,000 population 4. >500,000 population 5. Don’t know |
| Marital relationship | 1. Married 2. Divorced 3. Single 4. United to 5. Widower 6. None of the above |
| Work relationship | 7. Dependent asset 8. Independent asset 9. Retired/Pensioned/Retired 10. Independent worker 11. Irregular worker 12. None of the above |
| Education level | 13. None 14. Primary 15. Secondary 16. University 17. Master’s degree |
| If you are a professional, could you describe your occupation? | 18. Lawyer 19. Business Administration 20. Architect 21. Engineer 22. Entrepreneur 23. Finance 24. Doctor 25. Marketing/Advertising 26. Business 27. Health area personnel 28. Others |
| Economic income in US dollars per month | 1. <499 2. 500–999 3. 1000–1499 4. 1500–1999 5. 2000–2499 6. 2500–2999 7. >3000 |
| Access to health services | 1. Private with direct payment 2. Private with medical insurance 3. Social Security 4. Public Health Service 5. None |
| What Chronic Diseases do you have? | 1. Cancer 2. Mellitus diabetes 3. Diseases of the immune System 4. Psychiatric mental illness 5. Psychological 6. Chronic lung diseases 7. Renal disease 8. Fatty liver 9. Arterial hypertension 10. Hypothyroidism 11. Polycystic ovary 12. Cholesterol and/or triglyceride problems 13. Overweight/Obesity 14. Smoking 15. None of the above |
| Have you been diagnosed by a doctor with the following diseases? | 1. Angina pectoris 2. Arrhythmias 3. Disease of the arteries of the lower limbs and/or aorta 4. Stroke 5. Myocardial infarction 6. Heart failure 7. None of the above |
| Have you had any of the following procedures? | 1. Cardiac catheterization with stent placement in any coronary artery 2. Cardiac surgery for heart valve prostheses 3. Bypass surgery or revascularization of the coronary arteries 4. Lower limb vascular surgery 5. Pacemaker 6. None of the above |
| For his chronic illnesses, I take my medications | 1. Every day without fail, at the corresponding time 2. Every day without fail, but not at the corresponding time 3. I remember from time to time 4. I forget from time to time 5. I don’t take them 6. I don’t need medication |
| How many medications do you take? | 1. 1 2. 2 3. 3 4. 4 5. 5 6. More than 5 7. None 8. I don’t like taking medications |
| Please select your medication scheme | 1. Single-drug pills 2. One pill with two medications 3. One pill with three medications 4. They told me it’s called Polypill 5. None of the above |
| Have you had the flu? | 1. Yes 2. No 3. Don’t know |
| Have you had pneumococcus infection? | 4. Yes 5. No 6. Don’t know |
| How confident are you in the influenza vaccination? | Scale 1–10 (Not at all confident to Very confident) |
| How confident are you in the pneumococcus vaccination? | Scale 1–10 (Not at all confident to Very confident) |
| How often do you get the influenza vaccine? | 1. Annually in season 2. Every 2 years 3. Every 3 years 4. When I remember 5. From time to time 6. I don’t put it on |
| Have you had a pneumococcus vaccine? | 1. Yes 2. No |
| Who prescribes the vaccines? | 1. General Physician 2. Internal Medicine 3. Family Medicine 4. Cardiologist 5. Endocrinologist 6. Geriatrician 7. Gynecologist 8. Pulmonologist 9. Neurologist 10. Pediatrician for my children/grandchildren 11. Others (gastroenterologist, rheumatologist, etc.) 12. I prescribe myself 13. None of the above |
| What health service does vaccination provide you? | 1. Public 2. Private 3. Social Security 4. Annual vaccination campaign in my country 5. I buy it at the pharmacy without prescription 6. None of the above |
| How much do you know about the cardiovascular benefits of vaccination? | Scale 1–10 (I don’t know them to I know them) |
| If you are not a doctor, do you suggest other Vaccinations? | 1. Yes 2. No 3. Does not apply |
| If you are a doctor, do you indicate vaccination for Influenza and Pneumococcus? | 1. Yes 2. No 3. Does not apply |
| Do you know when the influenza season is in your country? | 1. Yes 2. No |
| Are there vaccination campaigns for influenza and pneumococcus in your country? | 1. Yes 2. No 3. Don’t know |
| Have you been vaccinated for COVID-19? | 1. Yes 2. No |
| Number of doses given | 1. 1 2. 2 3. 3 4. 4 5. 5 6. None 7. All necessary |
| What type of vaccine do you use? | 1. Abdala (Cuban) 2. Moderna 3. J&J/Janssen 4. Oxford/Astra Zeneca 5. Pfizer/BioNTech 6. Sinopharm (China) 7. Sinovac/Biotech (China) 8. Sputnik 5 (Russia) 9. None |
| How confident are you in the COVID-19 vaccination? | Scale 1–10 (Not at all confident to Very confident) |

Figure 1
Distribution of participating countries by region.
North, Central, and Caribbean region (NCC): Mexico, Guatemala, El Salvador, Honduras, Nicaragua, Costa Rica, Panama, Cuba, Puerto Rico, and Dominican Republic.
Andean region (AR): Venezuela, Colombia, Ecuador, Bolivia, and Perú.
Southern Cone region (SCR): Paraguay, Chile, Uruguay, and Argentina
Ethics and Consent
Protection of humans and animals. The authors declare that no experiments were performed on humans or animals for this research.
Confidentiality, informed consent and ethical approval. The authors have followed the confidentiality protocols of their institution, have obtained informed consent from the patients, and have the approval of the Ethics Committee. The recommendations of the SAGER guidelines have been followed, according to the nature of the study.
Competing Interests
The authors have no competing interests to declare.
Author Contributions
The authors declare that they did not use any type of generative artificial intelligence for the writing of this manuscript.